Introduction
Retailers can reduce pricing blind spots by continuously collecting marketplace product, price, availability, and seller information and comparing it against their own offers. Ozon competitor price monitoring using web scraping provides a practical way to turn frequently changing marketplace data into structured competitive intelligence. Instead of manually checking individual listings, retailers can create an automated workflow that captures product prices, discounts, seller information, ratings, reviews, availability, and other relevant attributes at scheduled intervals.
This approach is particularly valuable for brands competing in categories where several sellers offer similar products. A small competitor price change can affect visibility, conversion opportunities, and perceived value. Historical snapshots allow pricing teams to identify patterns instead of reacting to isolated changes.
Businesses can also combine pricing information with Ozon Product and Review Datasets to understand how product positioning, customer feedback, availability, and pricing interact. For Real Data API customers, the objective is not simply to collect marketplace pages. The objective is to create structured, reusable data that can feed pricing dashboards, competitive intelligence systems, market research workflows, and automated alerts.
Why Is Marketplace Price Tracking Important for Retailers?
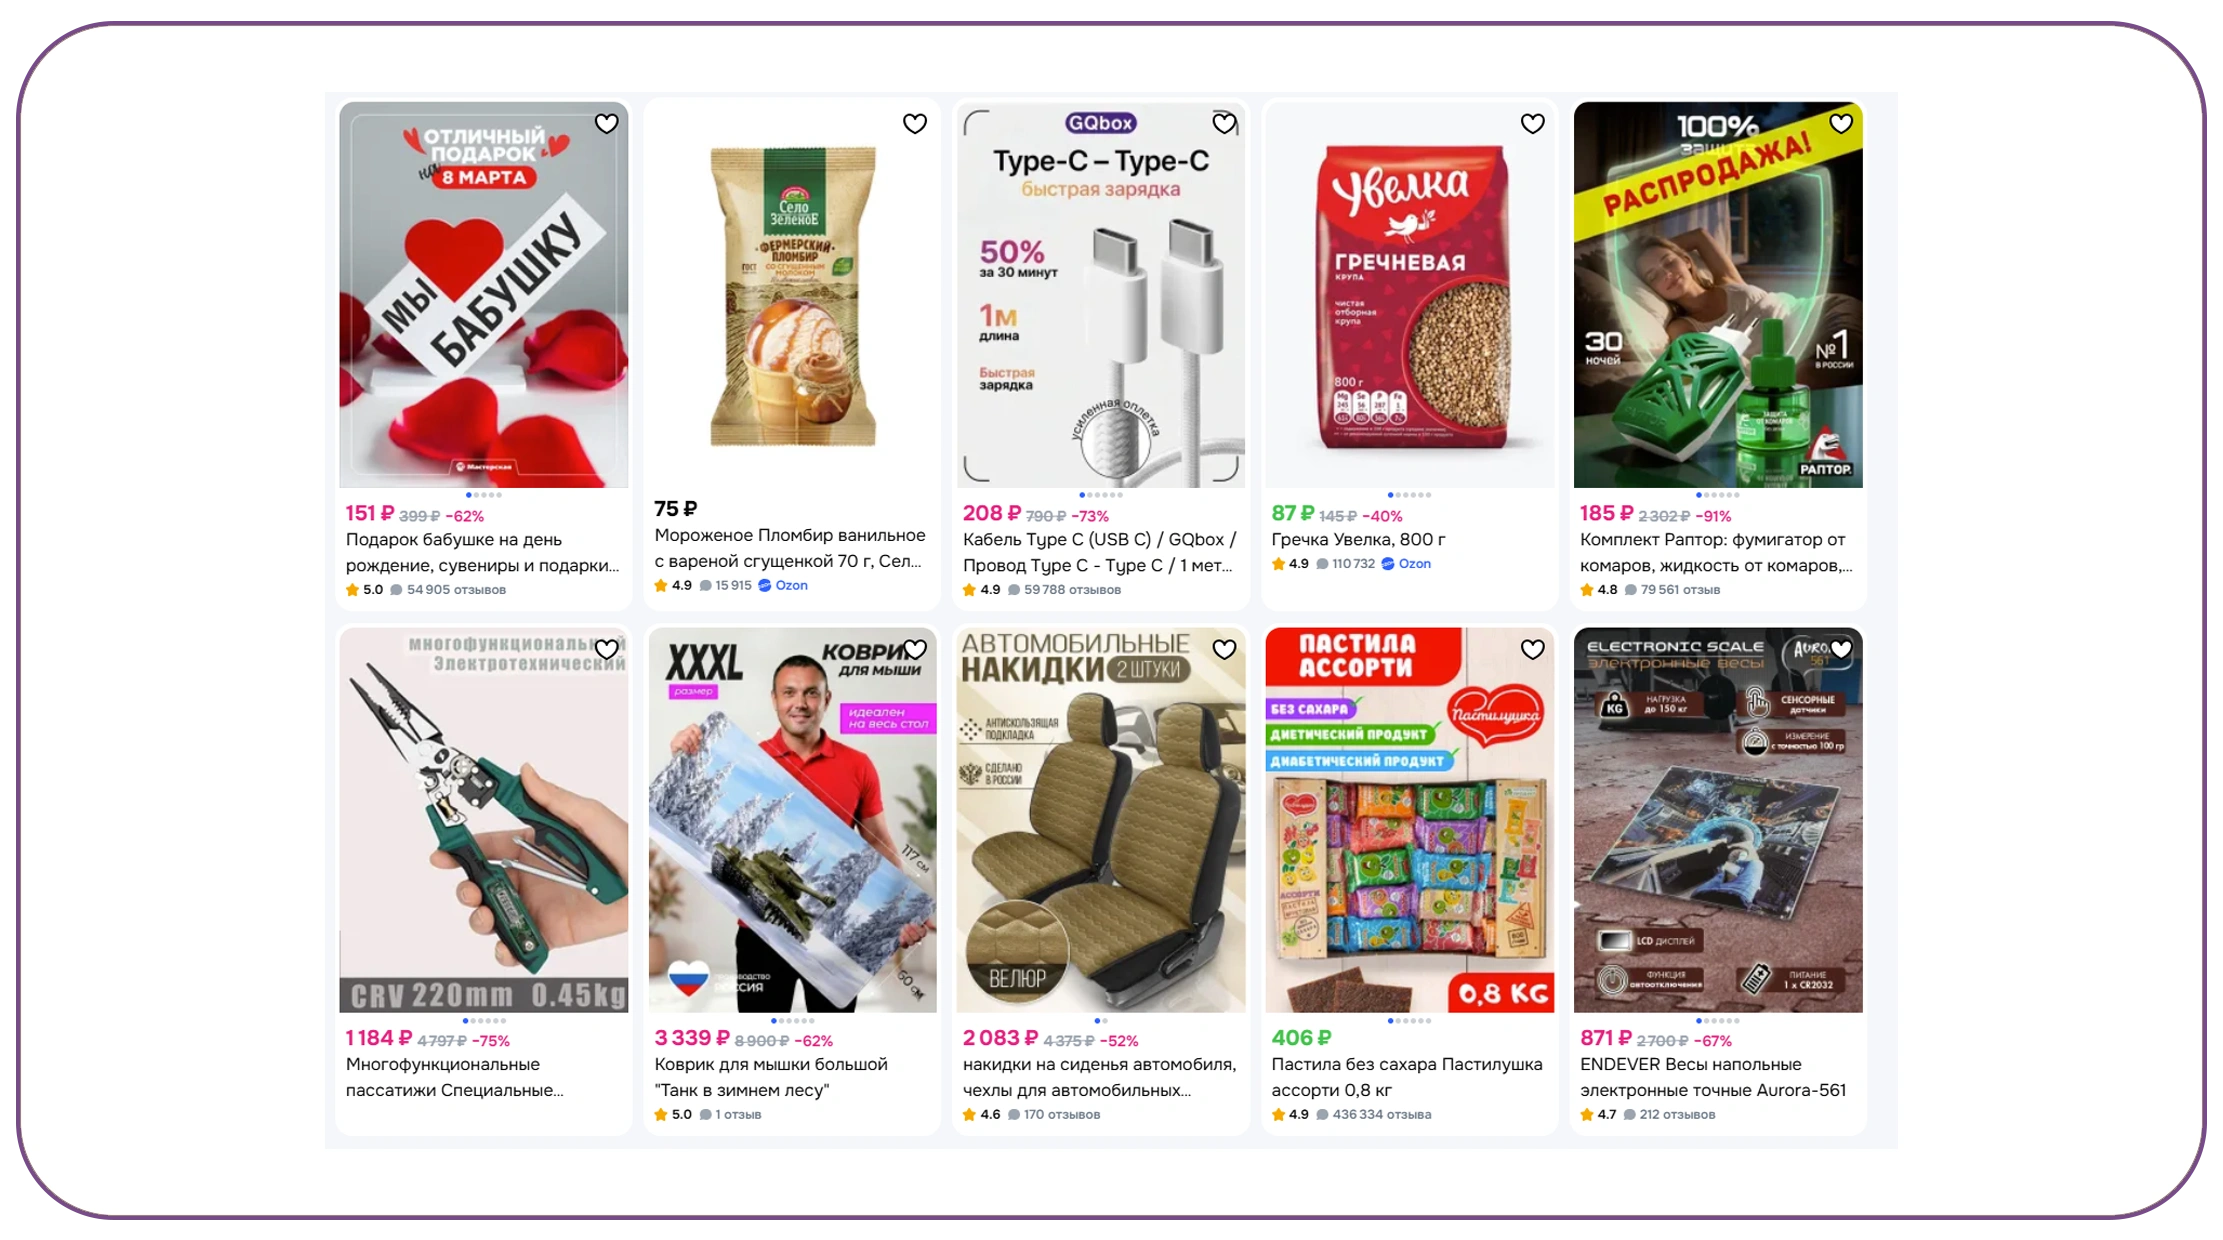
Marketplace pricing is dynamic. Sellers can adjust prices because of promotions, inventory levels, competitor activity, seasonal demand, or broader commercial strategies. When a retailer relies on occasional manual checks, important changes can remain unnoticed.
A structured monitoring program solves this problem by establishing a repeatable observation process. Product identifiers can be matched over time, prices can be normalized, and historical records can be stored with timestamps. Analysts can then calculate price differences, discount depth, price volatility, and changes in seller positioning.
The following table is a research model, showing how a retailer could scale marketplace monitoring between 2020 and 2026. These figures are examples for methodology and are not reported Ozon statistics.
| Year | Example Products Tracked | Example Price Observations | Example Competitors Monitored | Primary Objective |
|---|---|---|---|---|
| 2020 | 10,000 | 25,000 | 100 | Baseline research |
| 2021 | 18,000 | 45,000 | 150 | Competitor benchmarking |
| 2022 | 30,000 | 80,000 | 250 | Price intelligence |
| 2023 | 50,000 | 140,000 | 400 | Automated monitoring |
| 2024 | 80,000 | 230,000 | 600 | Market intelligence |
| 2025 | 120,000 | 350,000 | 850 | Continuous tracking |
| 2026 | 175,000 | 500,000 | 1,100 | Scaled pricing intelligence |
Data note: All figures in this table are examples created to explain a scalable monitoring framework.
For a pricing manager, the business value comes from converting these observations into decisions. A retailer can identify when a competitor undercuts its price, determine whether the change is temporary, and assess whether an immediate response is commercially justified.
How Can Product Data Improve Market Research?
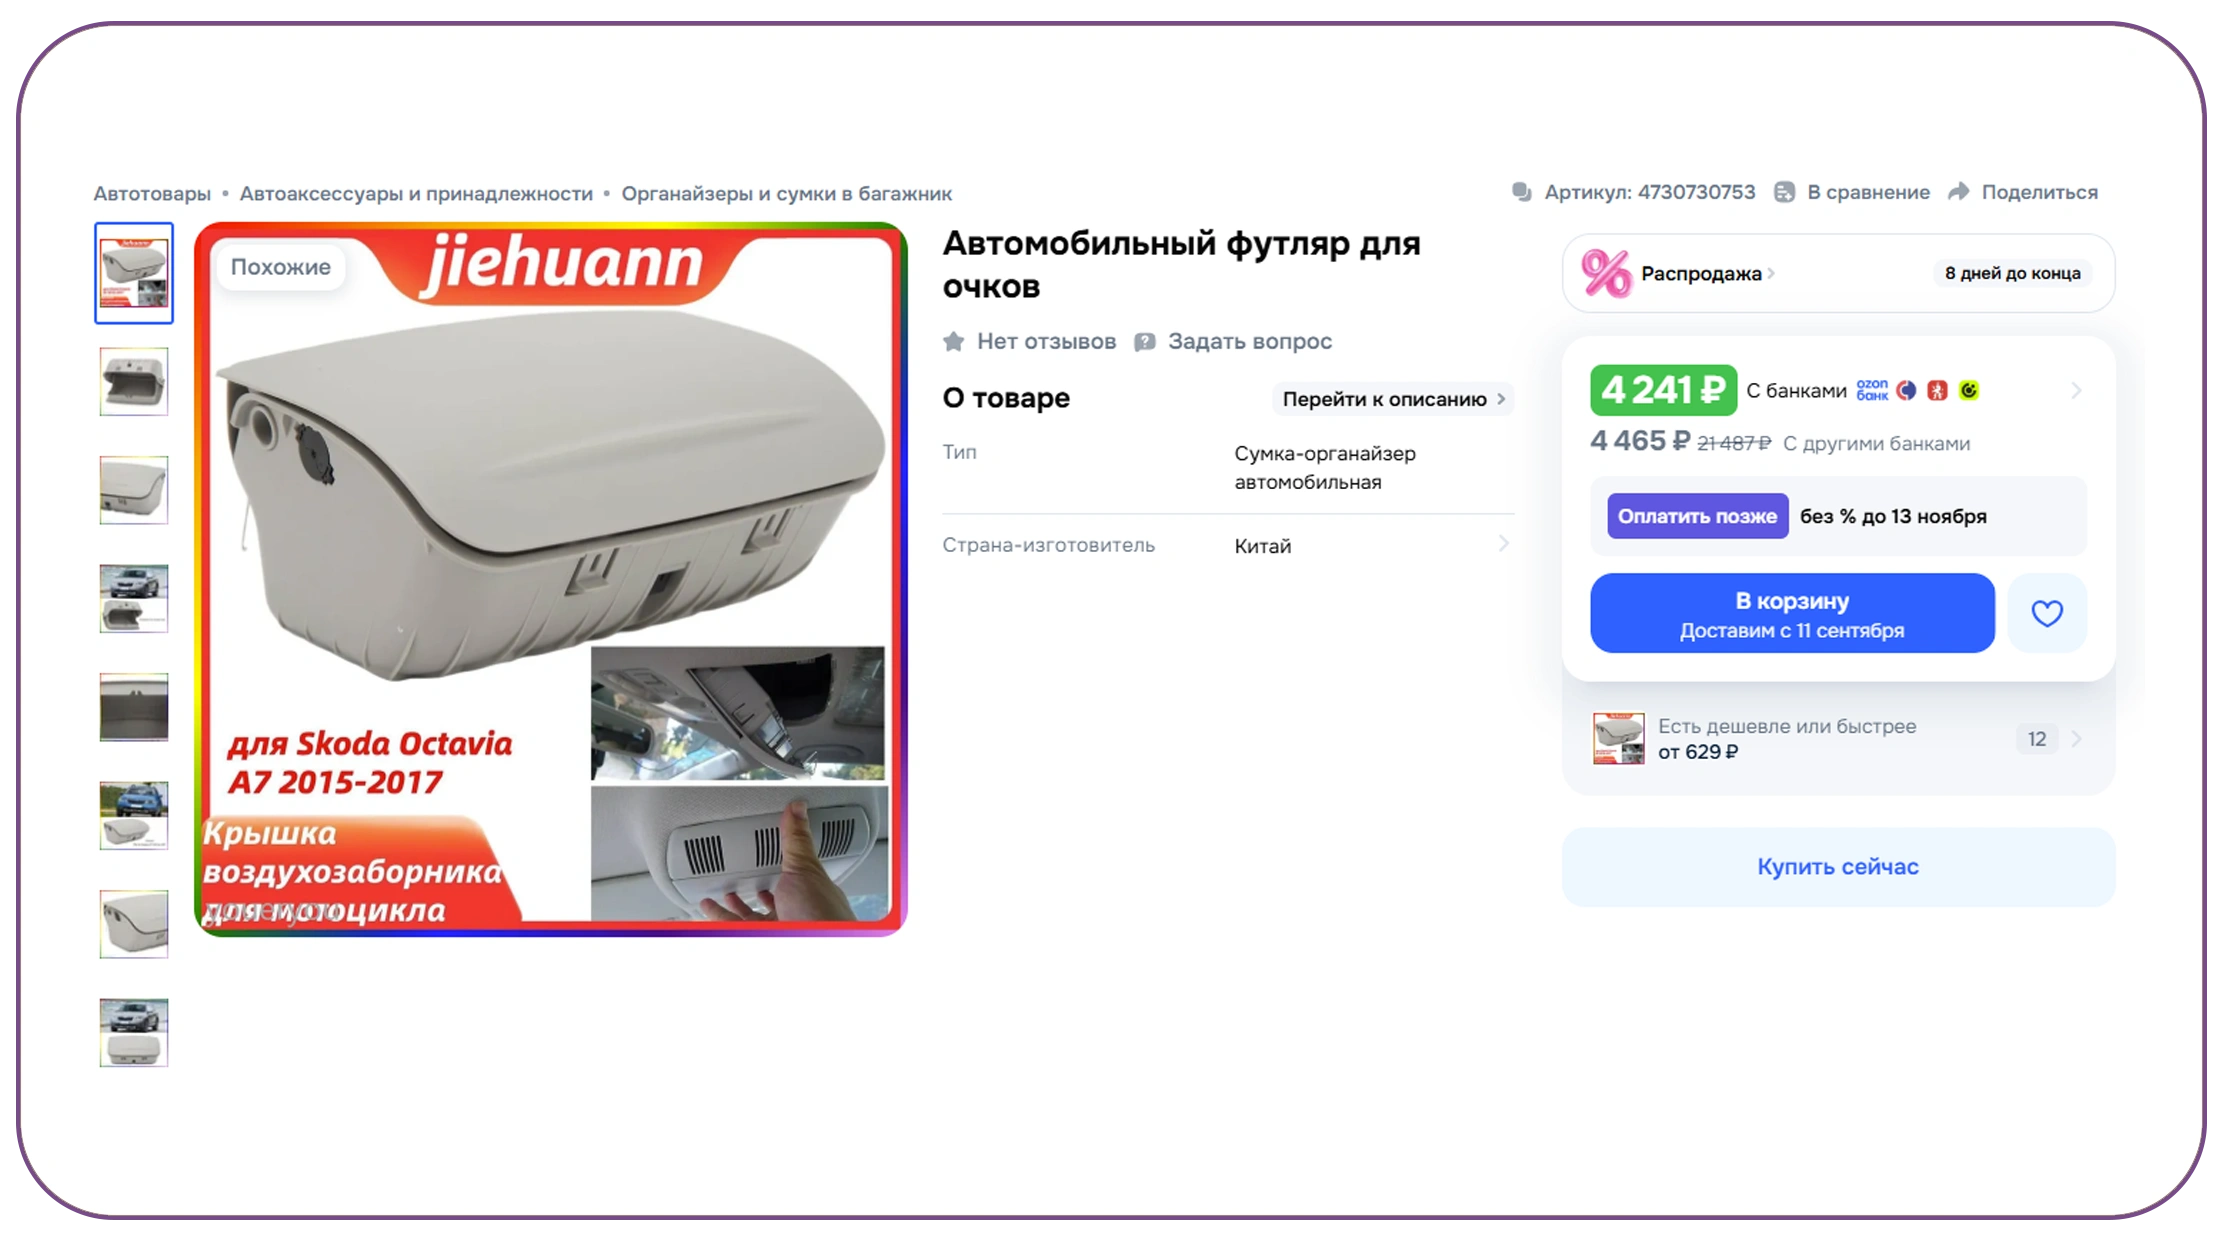
Businesses that extract Ozon product data for market research can move beyond simple price comparisons and examine the broader structure of a marketplace. Product-level information can include product names, categories, brands, prices, discounts, seller details, ratings, review counts, availability, specifications, and product URLs.
The first step is to define a consistent schema. Without standardized fields, historical comparison becomes difficult because product attributes may be represented differently across listings. Product matching is equally important. If the same product appears under multiple sellers, researchers need a reliable method to associate those offers with the correct underlying product.
Once the data is standardized, researchers can analyze price ranges by category, brand positioning, seller concentration, discount behavior, and assortment depth. This can help businesses identify underserved segments and understand where competitive pressure is highest.
| Year | Product Records | Categories Analyzed | Price Fields Captured | Research Focus |
|---|---|---|---|---|
| 2020 | 10,000 | 20 | 3 | Market baseline |
| 2021 | 18,000 | 28 | 3 | Category comparison |
| 2022 | 30,000 | 40 | 4 | Price segmentation |
| 2023 | 50,000 | 55 | 4 | Competitive positioning |
| 2024 | 80,000 | 70 | 5 | Assortment intelligence |
| 2025 | 120,000 | 90 | 5 | Historical benchmarking |
| 2026 | 175,000 | 110 | 6 | Automated market research |
Data note: dataset volumes and field counts, not Ozon-reported data.
The key insight is that product data provides context around price. A retailer should not automatically match every lower competitor price. It should first understand product equivalence, seller conditions, promotions, availability, and market positioning.
How Can Competitive Intelligence Reveal Pricing Opportunities?
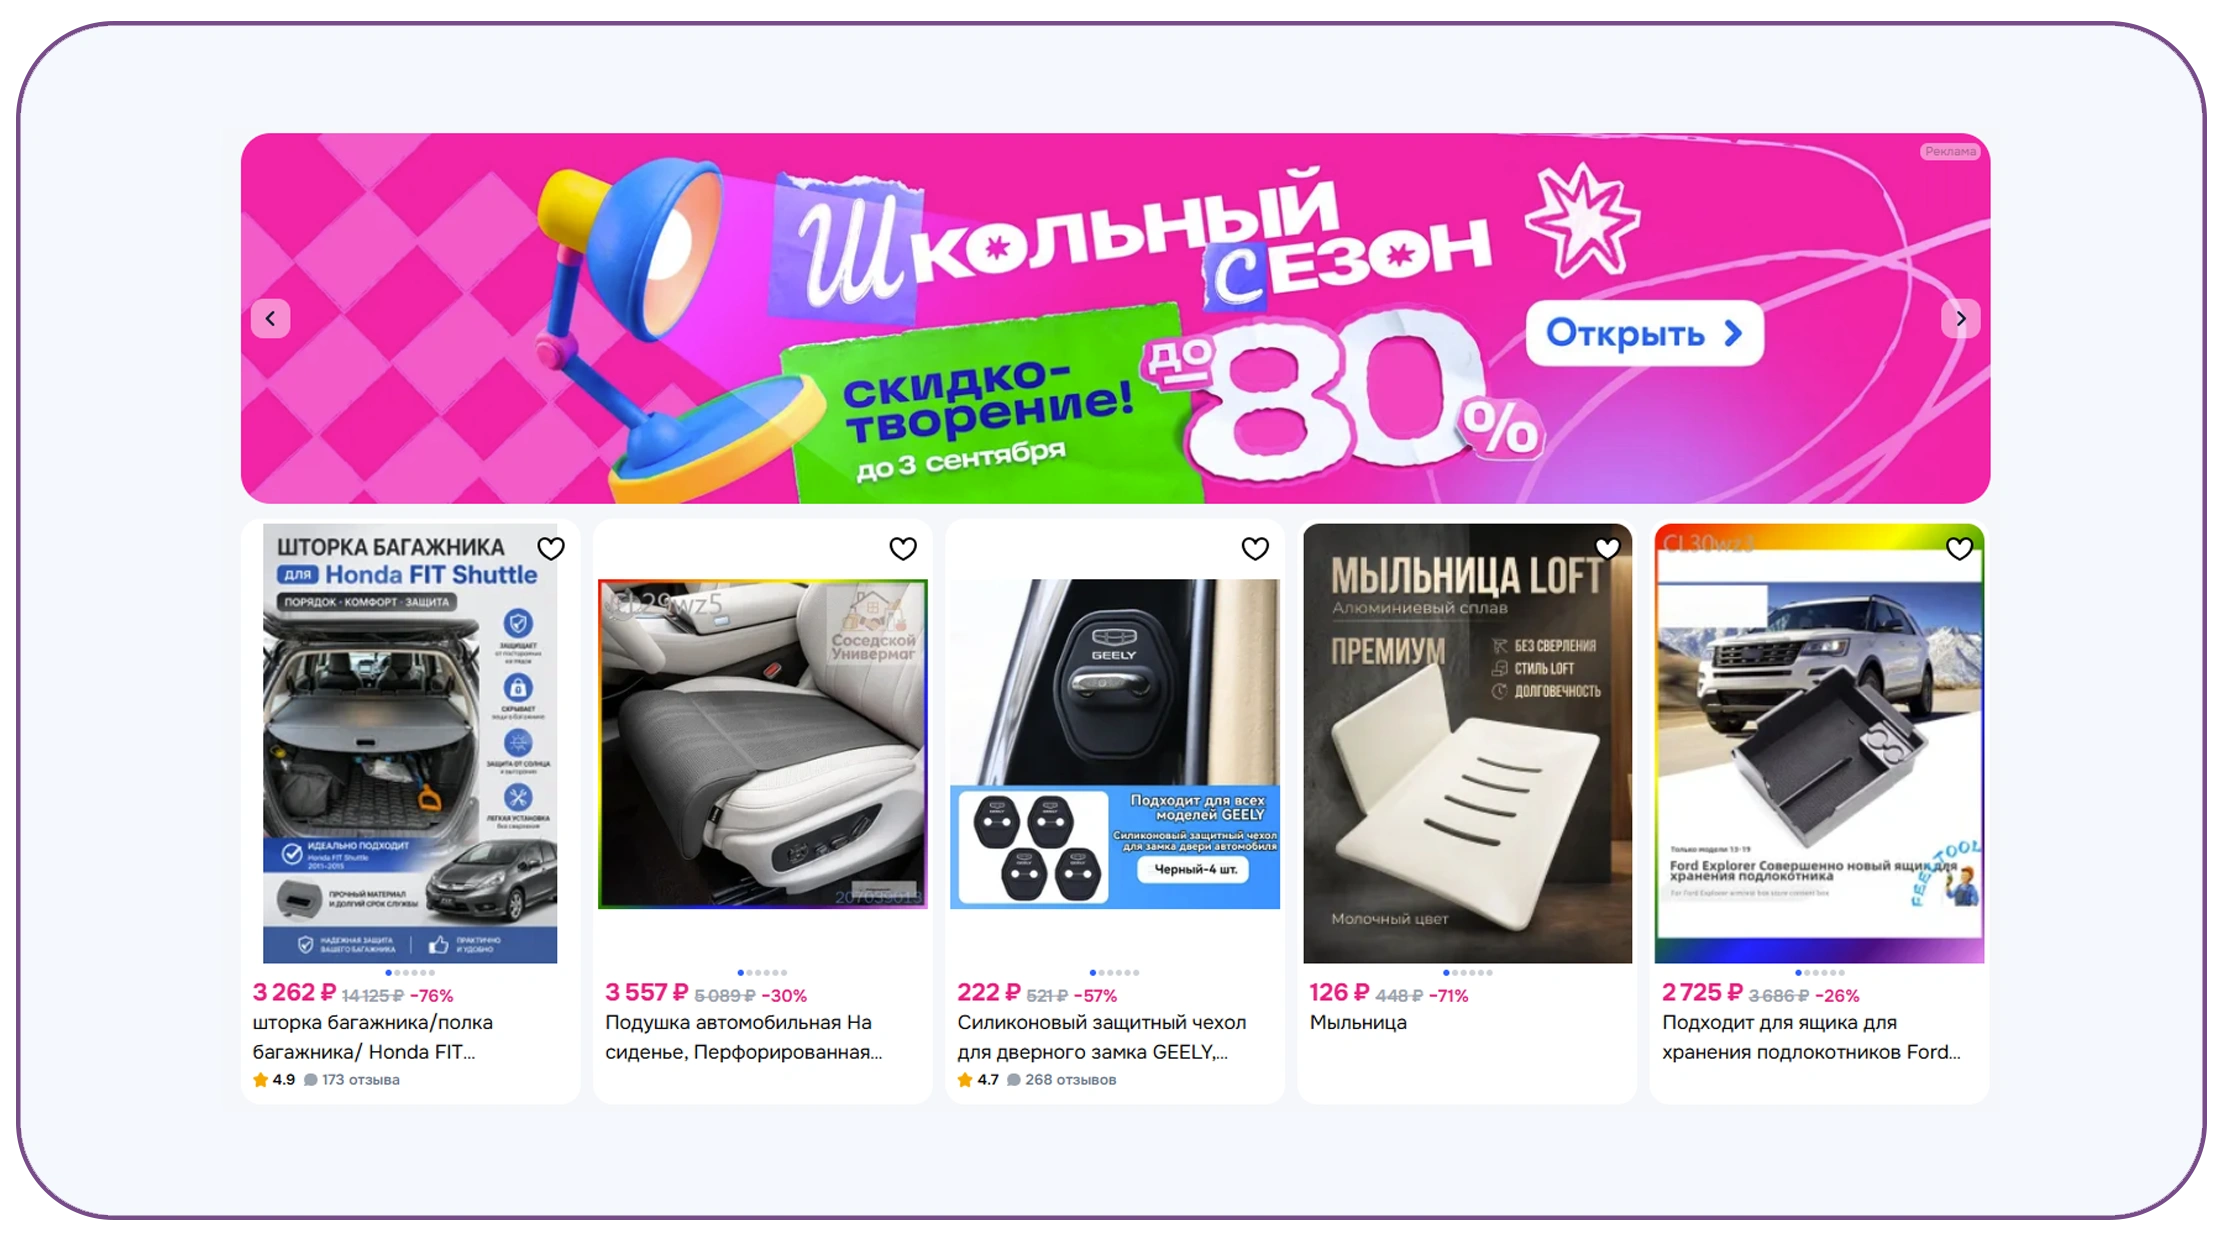
Ozon data scraping for competitive intelligence can help retailers transform marketplace observations into actionable signals. The central challenge is not collecting one competitor price. It is determining how competitor pricing changes over time and whether those changes create a meaningful commercial opportunity.
A competitive intelligence workflow can compare a retailer's price against multiple sellers and calculate the price gap. Historical snapshots can reveal whether a competitor consistently prices below the market or has introduced a temporary promotion.
For example, if a competing seller is 3% cheaper for several days, a retailer may treat the situation differently than a competitor offering a 15% discount for a limited campaign. The dataset should therefore preserve timestamps and relevant promotional attributes.
| Year | Example Price Checks | Example Price-Gap Analyses | Potential Business Use |
|---|---|---|---|
| 2020 | 25,000 | 8,000 | Initial benchmarking |
| 2021 | 45,000 | 15,000 | Competitor comparison |
| 2022 | 80,000 | 28,000 | Pricing opportunity detection |
| 2023 | 140,000 | 50,000 | Automated alerts |
| 2024 | 230,000 | 85,000 | Category-level intelligence |
| 2025 | 350,000 | 130,000 | Continuous benchmarking |
| 2026 | 500,000 | 190,000 | Automated decision support |
Data note: monitoring volumes, not measured Ozon traffic or marketplace statistics.
A mature system can classify price movements into categories such as increase, decrease, unchanged, promotional discount, unavailable, or newly listed. These classifications make dashboards easier to interpret.
For pricing teams, this creates a more disciplined decision process. Instead of reacting whenever someone notices a competitor's price, the business can prioritize changes based on magnitude, product importance, historical behavior, and competitive relevance.
How Can an API Make E-Commerce Data Easier to Use?

An Ozon marketplace API for e-commerce data can provide a structured layer between collected marketplace information and the systems that consume it. For businesses operating at scale, this distinction matters because analysts may need data in dashboards, spreadsheets, databases, BI platforms, internal applications, or automated workflows.
An API-oriented architecture can expose standardized product records while preserving timestamps and historical observations. This allows different teams to use the same underlying data without repeatedly rebuilding collection processes.
For example, a pricing dashboard could request the latest product observations, calculate competitor price gaps, and display products requiring review. A market research team could retrieve historical records for a specific category. A data science team could use structured observations as inputs for forecasting or classification models.
| Year | API Records Served | Integration Focus | Example Consumer |
|---|---|---|---|
| 2020 | 20,000 | Basic exports | Research team |
| 2021 | 40,000 | Structured datasets | Pricing analysts |
| 2022 | 75,000 | Database integration | BI team |
| 2023 | 130,000 | Automated dashboards | E-commerce team |
| 2024 | 220,000 | Enterprise workflows | Pricing department |
| 2025 | 350,000 | Multi-system integration | Data teams |
| 2026 | 500,000 | AI-ready data delivery | Analytics and AI teams |
Data note: API workload examples only.
An API also supports reuse. Rather than collecting and cleaning the same information separately for every project, organizations can maintain a standardized data layer and provide controlled access to the required fields.
For Real Data API users, this can turn marketplace monitoring into an infrastructure capability rather than a one-off research exercise.
How Can Faster Data Collection Improve Pricing Decisions?
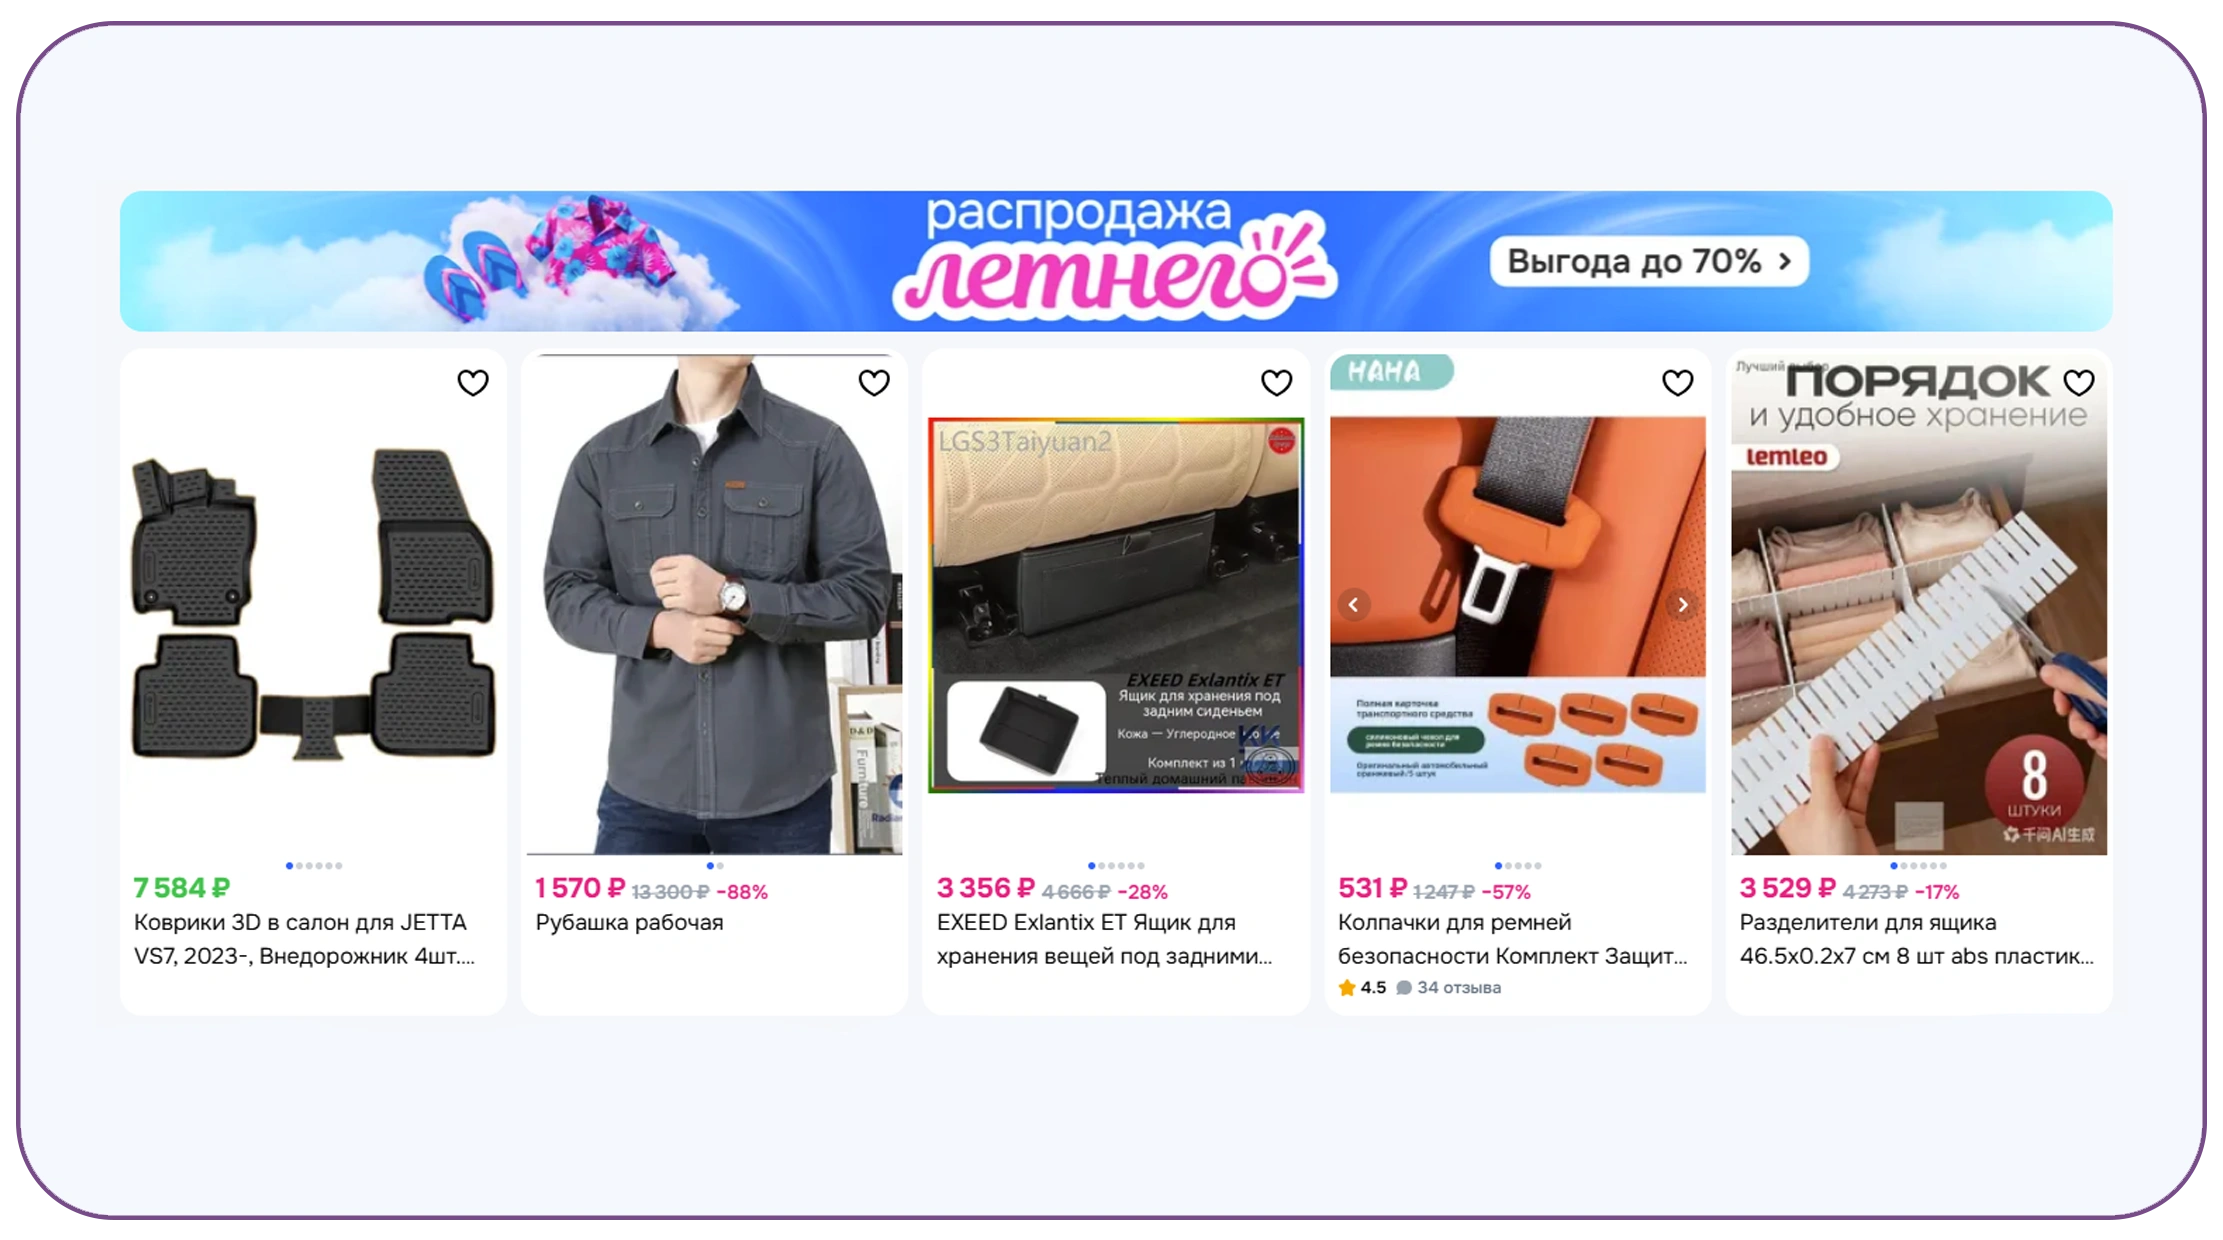
real-time Ozon product data extraction can help retailers shorten the time between a marketplace change and a business response. The exact meaning of "real-time" should be defined according to the business requirement because different categories have different monitoring needs. Some retailers may need frequent updates, while others may only require daily or weekly snapshots.
The important factor is consistency. A collection schedule should match the commercial importance and volatility of the monitored category. High-value or highly competitive products may justify more frequent observations than slow-moving products.
A pricing pipeline can capture current price, previous price, discount status, seller information, availability, and timestamp. The system can then compare the latest observation with historical records.
| Year | Monitoring Frequency | Example Response Window | Main Use |
|---|---|---|---|
| 2020 | Monthly | 30 days | Market research |
| 2021 | Biweekly | 14 days | Price benchmarking |
| 2022 | Weekly | 7 days | Competitive tracking |
| 2023 | Daily | 24 hours | Price monitoring |
| 2024 | Multiple daily checks | Several hours | Dynamic categories |
| 2025 | Hourly/custom | Under 1 day | High-priority products |
| 2026 | Custom schedules | Business-defined | Automated response |
Data note: Frequency examples should be adapted to business requirements and responsible collection practices.
Faster collection does not automatically mean better intelligence. Data quality, product matching, deduplication, validation, and historical storage remain essential. A poorly structured high-frequency dataset can be less useful than a clean daily dataset.
The strongest approach combines appropriate collection frequency with clear business rules. For example, a retailer could trigger an internal alert when a strategically important product becomes materially cheaper than its benchmark.
How Can a Scraping API Support Scalable Marketplace Monitoring?
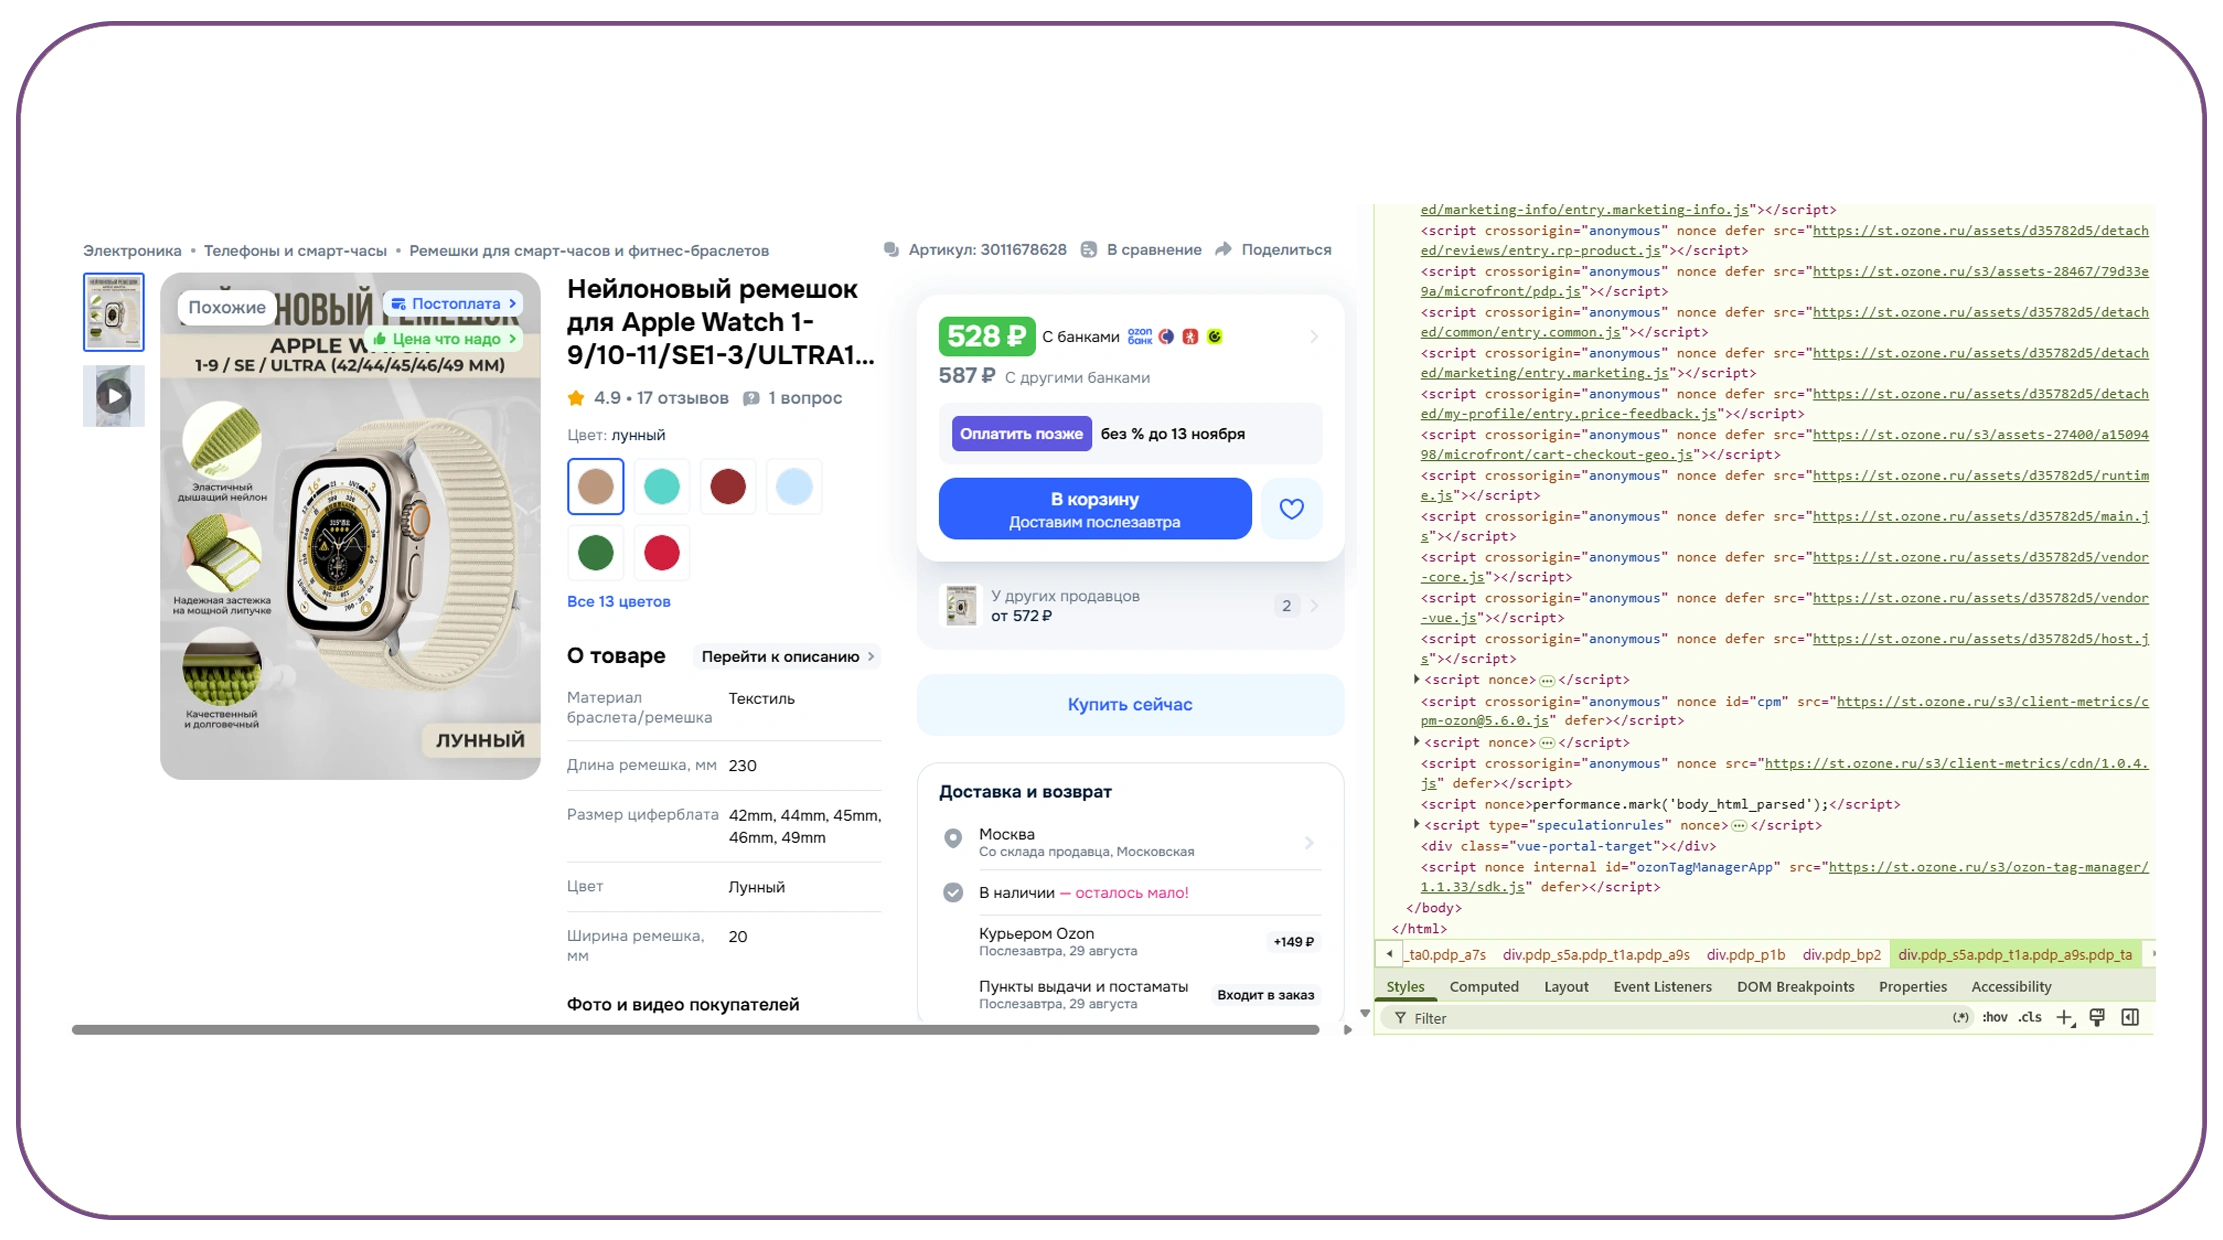
An Ozon Scraping API can help organizations standardize marketplace data collection and delivery across larger product portfolios. Instead of building separate extraction workflows for individual research projects, businesses can establish reusable pipelines that collect selected fields, validate records, and deliver structured results.
Scalability becomes particularly important when monitoring thousands of products. Manual workflows become increasingly difficult to maintain because product pages change, assortments move, prices fluctuate, and new sellers appear.
A scalable pipeline can include discovery, extraction, normalization, validation, storage, and API delivery. Each stage has a different purpose. Discovery identifies relevant products, extraction captures the required attributes, normalization creates consistency, validation detects anomalies, storage preserves history, and API delivery makes the information accessible to downstream systems.
| Year | SKU Coverage | Validation Checks | Delivery Method | Business Objective |
|---|---|---|---|---|
| 2020 | 10,000 | 3 | CSV | Research |
| 2021 | 18,000 | 4 | JSON | Data integration |
| 2022 | 30,000 | 5 | API | Monitoring |
| 2023 | 50,000 | 6 | API + database | Automation |
| 2024 | 80,000 | 7 | API + dashboard | Intelligence |
| 2025 | 120,000 | 8 | Automated pipeline | Enterprise monitoring |
| 2026 | 175,000 | 10 | API + analytics | Continuous intelligence |
Data note: technical scaling model, not actual Ozon platform volume.
Businesses should also establish responsible crawling policies, appropriate request rates, error handling, data retention rules, and compliance reviews. Automation should improve research efficiency while respecting applicable laws and website terms.
For a retailer, the end goal is simple: make reliable competitive data available to the people and systems that need it.
How Can a Unified Dataset Prevent Lost Sales?
A structured E-Commerce Dataset, Ozon competitor price monitoring using web scraping strategy can connect individual marketplace observations into a broader competitive intelligence system. Instead of looking only at current prices, retailers can analyze product availability, seller activity, discounts, ratings, reviews, and historical price movements together.
This is important because a price difference does not always indicate a genuine competitive threat. A competitor may have limited inventory, a temporary promotion, different product specifications, or a different seller reputation. Combining multiple fields helps pricing teams evaluate the situation more accurately.
A unified dataset can also support segmentation. Products can be grouped by category, brand, price band, seller, or strategic importance. Monitoring rules can then be customized for each segment.
| Year | Dataset Size | Signals Combined | Strategic Outcome |
|---|---|---|---|
| 2020 | 15,000 | Price + product | Basic benchmarking |
| 2021 | 25,000 | Price + availability | Stock-aware pricing |
| 2022 | 45,000 | Price + seller | Seller intelligence |
| 2023 | 75,000 | Price + reviews | Product positioning |
| 2024 | 120,000 | Price + reviews + availability | Competitive scoring |
| 2025 | 180,000 | Multiple marketplace signals | Automated monitoring |
| 2026 | 250,000 | Unified historical signals | Advanced intelligence |
Data note: dataset sizes and analytical signals.
The commercial benefit is improved prioritization. Rather than reviewing every price movement manually, teams can focus on products where the competitive gap, sales importance, and historical behavior indicate a meaningful risk.
This helps address one of the most common marketplace problems: discovering competitive changes after the opportunity has already passed.
Why Should Retailers Choose Real Data API?
An eCommerce Scraping API, Ozon competitor price monitoring using web scraping solution can provide the technical foundation required to collect, structure, and deliver marketplace intelligence at scale. Real Data API can help businesses design data workflows around their specific product fields, monitoring requirements, output formats, and analytical objectives.
For pricing teams, structured delivery is particularly valuable. Instead of receiving raw web pages that require extensive processing, businesses can work with organized records suitable for databases, analytics systems, dashboards, and research workflows.
Real Data API can also support recurring data collection and historical datasets. This enables businesses to compare current observations with previous snapshots and identify meaningful changes over time.
The right architecture should be designed around the business problem first. A retailer monitoring a few hundred strategic products may need a different schedule and schema from an enterprise tracking a large catalog across multiple categories. Data validation, normalization, product matching, timestamping, error handling, and scalable delivery should therefore be considered as part of the overall solution.
The result is a reusable data layer that can support competitive pricing analysis, assortment research, seller intelligence, product research, and automated business workflows.
What Should Retailers Do Before Starting a Price-Monitoring Project?
A successful monitoring program begins with a clear definition of what constitutes a competitive event. A simple price comparison is rarely enough. Retailers should establish which products matter most, which competitors should be monitored, how often data should be collected, and which changes require action.
The data schema should then be designed around those decisions. Core fields can include product identifier, product name, brand, category, seller, current price, previous price, discount, availability, rating, review count, product URL, currency, and timestamp.
Historical storage should be treated as a core requirement rather than an optional feature. Without historical observations, analysts cannot reliably distinguish normal price fluctuations from significant competitive movements.
Data-quality checks are equally important. Duplicate products, inconsistent currencies, missing values, unexpected price formats, and product-matching errors can distort competitive analysis. Automated validation can identify these issues before the information reaches business dashboards.
Finally, retailers should establish an action framework. Not every competitor change requires a price response. The best systems provide context so decision-makers can assess the commercial importance of each event.
What Business Metrics Can Be Built From the Data?
Once marketplace observations are structured, retailers can calculate several useful metrics. Price gap measures the difference between a retailer's offer and selected competitors. Discount depth measures how far a listed price has moved from a reference price. Price volatility measures how frequently or significantly prices change within a defined period.
Availability rate can indicate how often a product is observed as available, while assortment turnover can show how quickly the competitive catalog changes. Seller concentration can help identify categories dominated by a small number of sellers.
A practical dashboard might combine these metrics into a competitive score. Products with a significant price gap, high strategic importance, and frequent competitor changes can receive a higher monitoring priority.
This approach turns a large dataset into a manageable workflow for pricing and e-commerce teams.
How Can Historical Data Help Prevent Reactive Pricing?
Historical marketplace data allows retailers to distinguish between temporary events and persistent competitive patterns. Suppose a competitor reduces a product's price for one day. That observation may represent a short promotion rather than a permanent pricing strategy.
If the same competitor repeatedly maintains a lower price across several weeks, the situation deserves more attention. Historical records make this distinction measurable.
The same principle applies to assortment changes. A newly listed product may not immediately represent a competitive threat. But if similar products continue appearing in the same category while competing products disappear, the pattern may indicate a broader assortment strategy.
This is why timestamped data is more valuable than isolated snapshots. It creates a commercial history that pricing and market research teams can use to evaluate trends, benchmark decisions, and improve future strategies.
Conclusion
Ozon competitor price monitoring using web scraping gives retailers a structured way to identify competitive price movements, monitor product availability, analyze seller activity, and build historical marketplace intelligence. The strongest solution does not focus exclusively on collecting prices. It combines product, pricing, availability, seller, rating, review, and timestamp information so teams can understand why a competitive change matters.
For retailers, the practical workflow is straightforward: identify strategic products, define monitoring rules, collect structured marketplace data, preserve historical snapshots, validate the records, calculate competitive metrics, and deliver prioritized insights to pricing and e-commerce teams.
Real Data API can help transform this workflow into a scalable data infrastructure designed around your specific marketplace intelligence requirements.
Contact Real Data API today to create a scalable web data solution for competitive pricing, product monitoring, and e-commerce research!
Latest posts
E-commerce data scraper for inventory analysis 2027 - Real-Time Stock Tracking and Demand Forecasting

How Meesho API data extraction for product research Helps E-Commerce Brands Improve Product Selection and Market Intelligence?
How AliExpress API integration for automated data collection Streamlines Product Monitoring, Price Tracking, and Seller Intelligence
How H&M data scraping for fashion retail analytics Enhances Stock Monitoring, Apparel Pricing, and Product Category Insights






.png)



