Quick Summary
- An E-commerce data scraper for inventory analysis helps retailers monitor product availability, identify stock changes, and improve replenishment decisions using timestamped online product observations.
- E-Commerce Datasets for Competitive Analysis can help brands compare assortment, listed prices, and competitor availability to support more informed inventory planning.
- Historical sales statistics show the growing importance of online retail, while reliable forecasting still requires business-specific sales, stock, lead-time, and seasonal data.
Introduction
An E-commerce data scraper for inventory analysis helps online retailers, brands, distributors, and inventory planners collect product-level information from accessible e-commerce listings to monitor availability, track stock signals, and support demand forecasting. By combining these observations with internal sales and inventory records, businesses can make more informed replenishment decisions and reduce the risk of avoidable stockouts or excess inventory.
For businesses competing across multiple online marketplaces, E-Commerce Datasets for Competitive Analysis provide another source of market intelligence. Product listings can reveal visible assortment differences, advertised prices, promotional activity, and availability signals that help teams understand how competitors present their products.
Inventory planning has become increasingly data-dependent as online retail grows. The U.S. Census Bureau reported that seasonally adjusted retail e-commerce sales reached $340.2 billion in the second quarter of 2026, representing 17.1% of total U.S. retail sales. E-commerce sales were 12.2% higher than in the second quarter of 2025. These figures demonstrate the scale of online retail, although they do not measure inventory accuracy or stockout rates. Source: U.S. Census Bureau.
For inventory managers, the practical challenge is connecting what is visible online with what the business actually needs to stock. Product availability on a competitor's website does not establish its warehouse inventory, and a listing disappearing from a page does not necessarily mean the product is sold out. A reliable workflow therefore combines consistent data collection, timestamped observations, validation, and internal operational records.
This guide explains how businesses can use real-time product observations for inventory monitoring, pricing analysis, competitor research, and demand forecasting, with verified public retail statistics from 2020 through 2026.
How can product-level records improve inventory visibility?
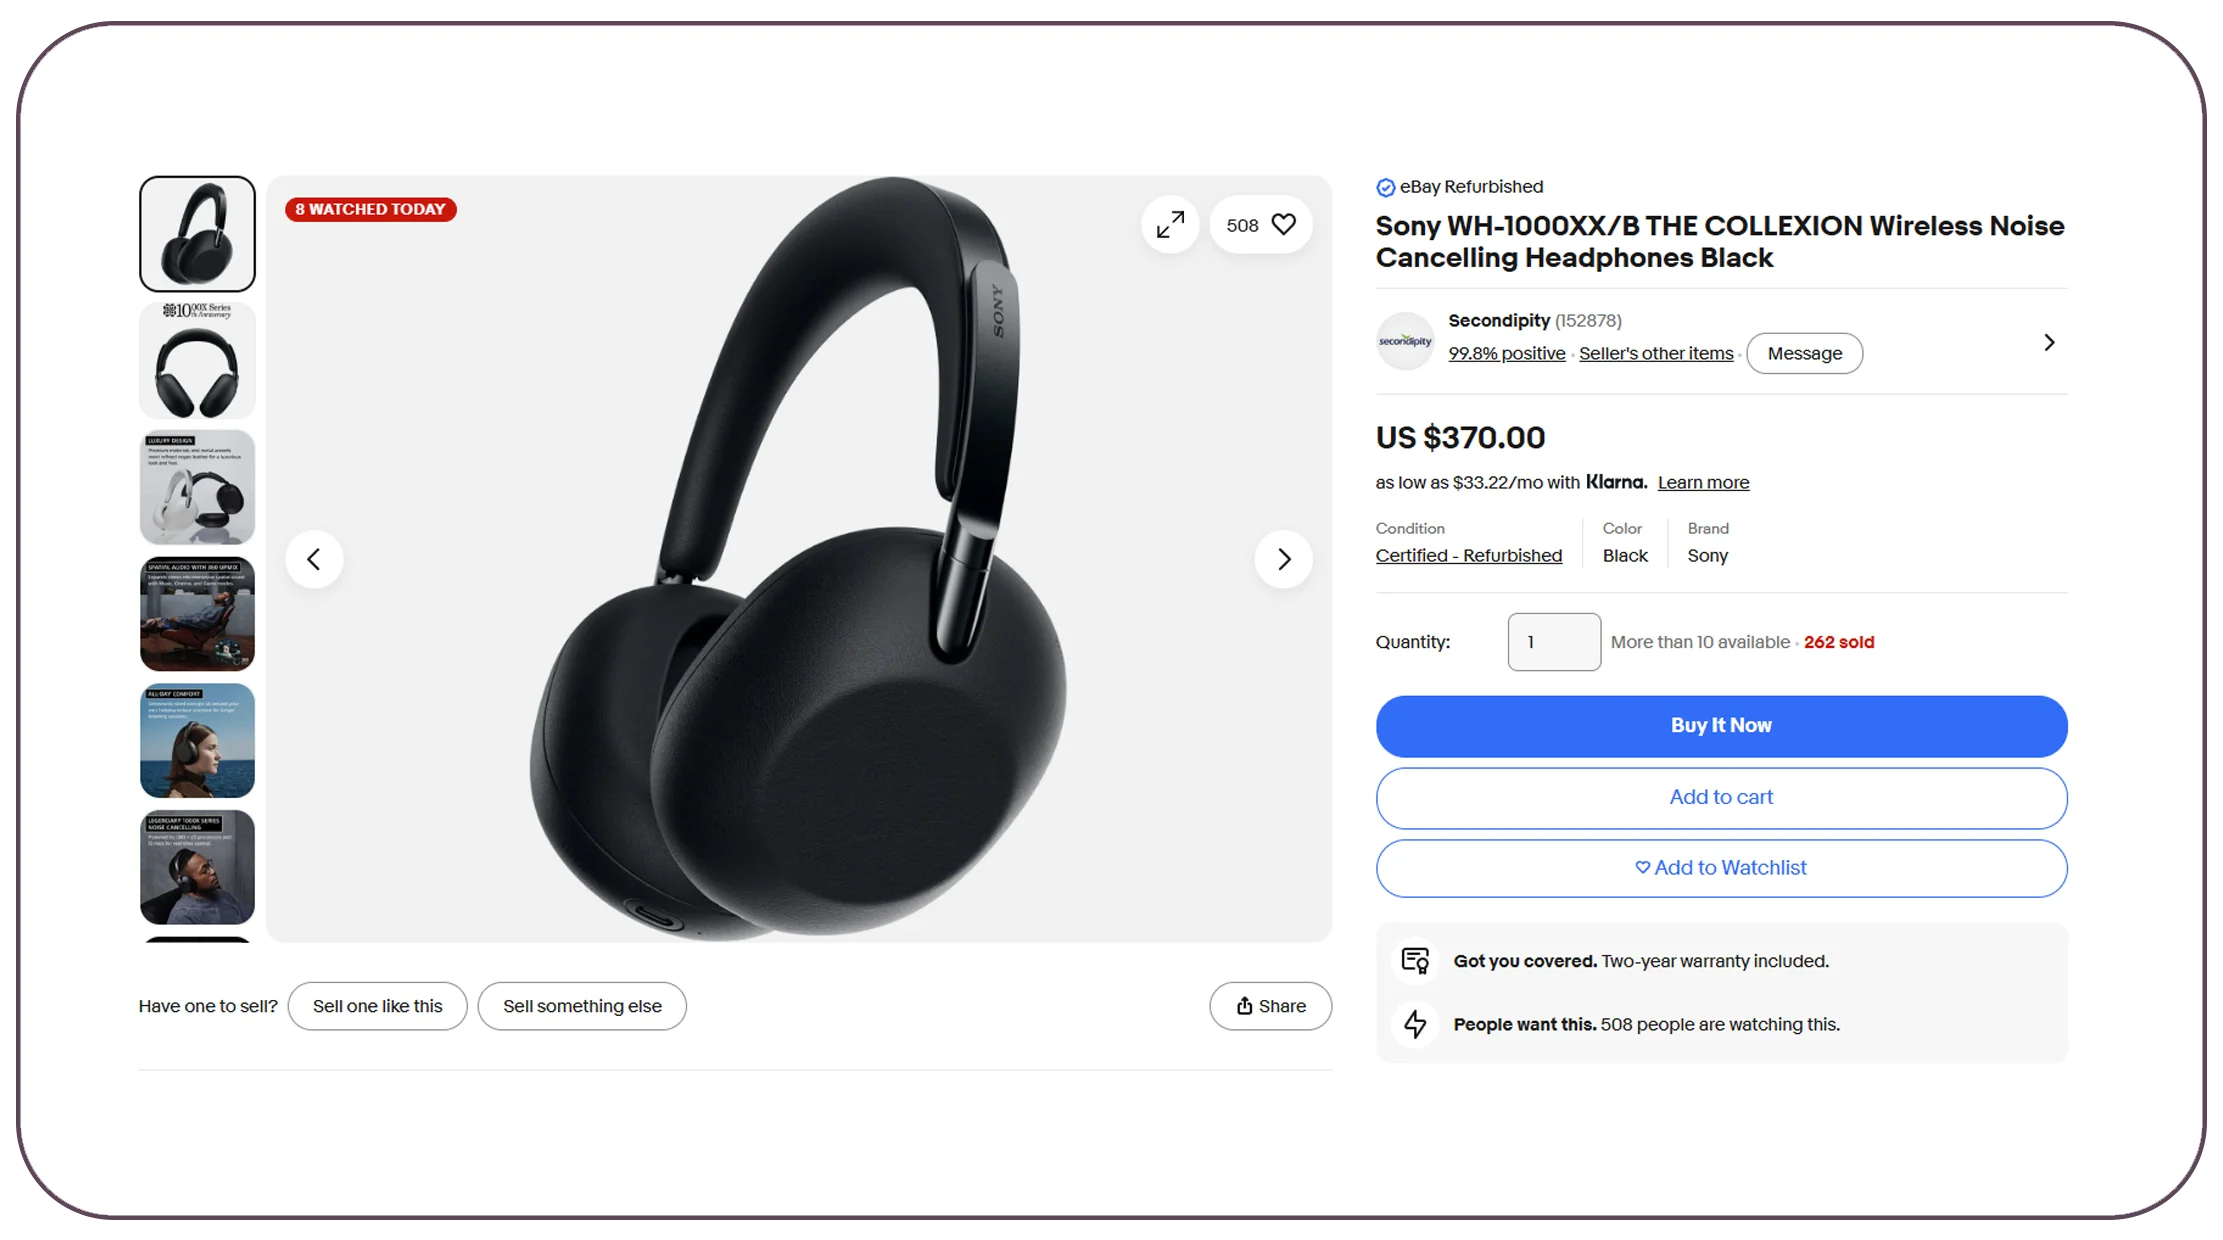
e-commerce product data gives inventory teams a structured view of the products that appear on online retail pages. Depending on the source, useful fields may include product title, SKU or product ID, brand, pack size, listed price, availability status, seller, product URL, and observation timestamp.
The main benefit is consistency. When the same product is checked repeatedly, businesses can compare observations and identify changes in its visible status. A retailer might use these signals to prioritize manual checks, investigate listing gaps, or compare its assortment with publicly visible competitor listings.
However, an online listing is not a direct inventory feed. A product may appear unavailable because of delivery restrictions, a temporary technical issue, or a location-specific setting. Businesses should classify such results as observed listing statuses unless they have a verified connection to actual stock records.
What do real retail sales figures reveal about the opportunity?
U.S. Census Bureau data show the scale of online retail growth. The following annual values are reported through the Bureau's annual e-commerce sales series via FRED for 2020–2024, followed by the Census Bureau's 2025 estimate. Values are nominal, rounded to the nearest billion dollars.
| Year | U.S. e-commerce sales | Data status |
|---|---|---|
| 2020 | $784.6 billion | Annual reported data |
| 2021 | $916.4 billion | Annual reported data |
| 2022 | $972.3 billion | Annual reported data |
| 2023 | $1,083.0 billion | Annual reported data |
| 2024 | $1,182.9 billion | Annual reported data |
| 2025 | $1,233.7 billion | Census Bureau estimate |
| 2026 | $340.2 billion in Q2 | Quarterly, seasonally adjusted |
Sources: U.S. Census Bureau annual data via FRED and the Census Bureau's 2026 second-quarter release. The 2026 figure is one quarter, not a full-year total; annual and quarterly values should not be compared as equivalent periods.
These figures demonstrate why online inventory visibility matters, but they do not indicate how many products were out of stock. To measure inventory performance, businesses still need their own stock, order, sales, and replenishment records.
How can price observations support smarter replenishment?
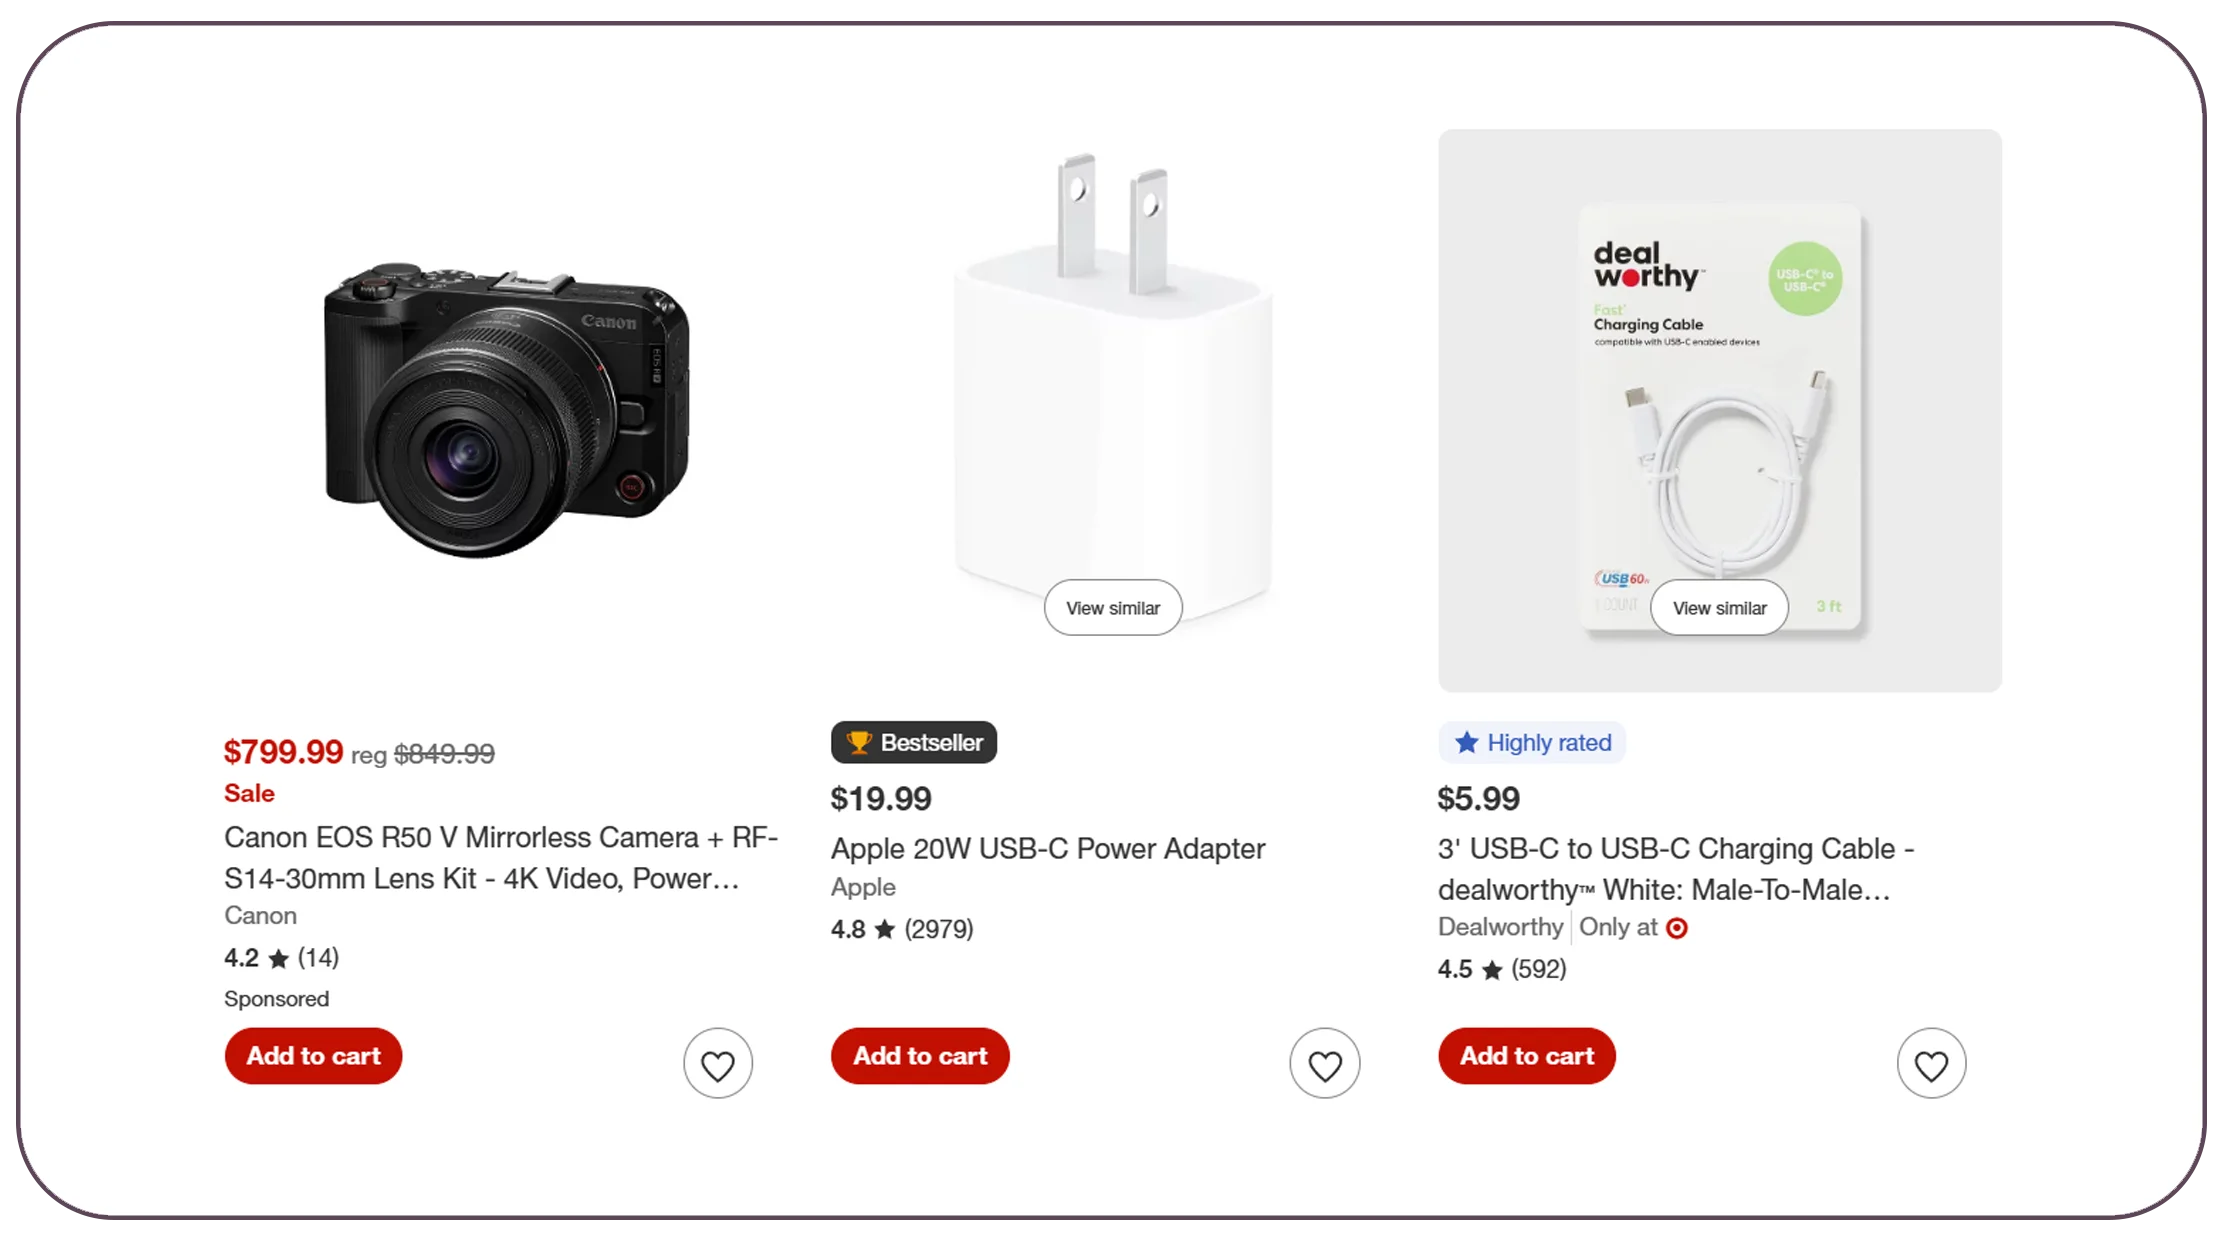
extraction for pricing analysis helps businesses track listed prices, promotional labels, pack sizes, and changes across observation dates. Although price data alone cannot establish demand, it can add context to inventory decisions.
For example, a product that repeatedly appears at a lower displayed price may warrant closer monitoring if the retailer also observes increased order volume. But the price change should not automatically trigger a larger replenishment order. Internal sales velocity, available stock, supplier lead time, margin, and forecast demand must also be considered.
A useful workflow links each price observation to a normalized product identifier and timestamp. It should distinguish regular listed prices from promotional prices where the source makes that distinction available. Pack sizes and variants must also be matched carefully: a one-kilogram product should not be compared directly with a 500-gram product without calculating unit prices.
Which signals should inventory teams monitor?
| Signal | How it can support decisions | Important limitation |
|---|---|---|
| Listed-price change | Flags a possible competitor pricing change | Does not prove demand changed |
| Promotional label | Helps identify visible offers | May omit personalized or checkout offers |
| Product availability | Highlights a listing that may need review | Does not confirm warehouse stock |
| Pack-size change | Prevents misleading price comparisons | Requires accurate variant matching |
| Repeated observations | Helps distinguish isolated changes from patterns | Depends on collection frequency and coverage |
The actionable step is to combine price observations with the business's actual sales and inventory data. If sales velocity rises while available stock falls, a replenishment review may be justified. If the only signal is a competitor price reduction, the team should investigate before changing purchasing quantities.
Businesses should also document when observations were collected and which locations or channels they cover. Without this context, an inventory manager could mistake a temporary promotion or a different service area for a broad market shift.
How can competitor monitoring uncover inventory risks?
An e-commerce competitor data scraper for market research can help teams observe visible competitor assortment, product listings, prices, and availability indicators. These signals provide context for evaluating product positioning and identifying listings that deserve further investigation.
For a brand selling through multiple retailers, competitor monitoring can reveal that a product is listed in one channel but not another. A distributor may use this information to review assortment coverage, while a manufacturer may compare the visibility of equivalent product variants. These observations can support questions for sales teams and retail partners; they should not be treated as proof of competitor sales or inventory quantities.
A reliable monitoring process should use consistent product matching, capture timestamps, retain source references, and flag uncertain matches. Where competitor pages are personalized or location-specific, the report should state the conditions under which the observations were made.
What should a useful monitoring report contain?
- Product name, brand, variant, and standardized identifier where available.
- Competitor and source page reference.
- Observed price and promotional text, if displayed.
- Availability status exactly as presented.
- Capture date, time, and applicable region or service area.
- A data-quality flag for duplicates, missing fields, or uncertain matches.
The report should distinguish three levels of evidence: a product was listed, a product appeared available for a selected location, and a product's actual inventory was verified. These are not interchangeable claims.
For inventory planners, the most useful result is a prioritized exception list. It might flag products whose visible availability changes repeatedly, whose competitor assortment differs substantially, or whose prices change at the same time as internal sales patterns. Staff can then verify the issue and decide whether it requires a stock transfer, supplier discussion, listing correction, or no action.
Need better inventory visibility? Contact Real Data API to discuss a data collection workflow aligned with your products, sources, and reporting needs!
Get Insights Now!How can frequent product checks improve stock monitoring?
Businesses can extract real-time e-commerce product data to create a more current view of visible product listings. The term "real-time" should be used carefully: the information is only as current as the latest successful observation, and collection frequency depends on source accessibility, technical limits, and the agreed monitoring schedule.
For inventory operations, frequent observations can help identify changes that require attention. A listing that changes from available to unavailable may trigger a verification task. A product that repeatedly disappears and reappears could require investigation into location-specific availability, listing reliability, or a possible inventory issue. The scraper itself cannot determine the underlying cause without additional evidence.
What does the latest 2026 retail data show?
The U.S. Census Bureau reported seasonally adjusted e-commerce sales of $340.2 billion for the second quarter of 2026, up 3.8% from the first quarter and 12.2% from the second quarter of 2025. E-commerce accounted for 17.1% of total U.S. retail sales during the quarter. These figures are adjusted for seasonal variation but not price changes.
This is useful context for inventory planning because online retail represents a substantial share of the U.S. market. However, aggregate sales growth cannot tell an individual retailer which SKU to reorder, how much stock to hold, or whether a competitor has a stockout. Those decisions require product- and business-specific evidence.
A practical monitoring process should define which products to check, how often to check them, what counts as a meaningful status change, and how to handle failed observations. It should also avoid treating a page timeout or missing product card as confirmed unavailability.
For high-priority products, businesses can combine frequent listing observations with internal inventory alerts. A useful exception workflow includes the product ID, last successful observation, current displayed status, previous status, source URL, and a review outcome. This helps teams distinguish actionable changes from collection errors and avoid unnecessary replenishment decisions.
How can pricing patterns improve demand forecasts?
real-time retail pricing intelligence can provide supporting indicators for forecasting, but it should not be treated as a replacement for transaction and inventory history. Prices, promotions, product availability, holidays, seasonality, and delivery lead times can interact in different ways across product categories.
For example, a retailer may observe that a product's displayed price falls during a seasonal campaign. If its own historical data also shows higher sales during comparable periods, the business can test whether a similar uplift is likely to recur. The external price observation provides context; the retailer's own sales history supplies the evidence needed to estimate demand.
Which inputs make forecasts more reliable?
| Input | Forecasting purpose |
|---|---|
| Historical units sold | Establishes the baseline sales pattern |
| Current sellable inventory | Shows the stock available to fulfil orders |
| Supplier lead time | Helps calculate when replenishment must begin |
| Confirmed purchase orders | Identifies stock expected to arrive |
| Promotions and price changes | Adds context for possible demand shifts |
| Seasonality and holidays | Helps account for recurring demand patterns |
| Availability observations | Flags potential competitor or listing changes for review |
A basic reorder point can be calculated as:
Reorder point = Average daily demand × Lead time in days + Safety stock
This formula is a starting point, not a universal inventory policy. Average daily demand should be estimated from appropriate sales history, and safety stock should reflect demand variability, lead-time uncertainty, and the business's service-level target.
Businesses should also separate actual stockouts from periods when products were simply not listed or not deliverable. If historical sales are suppressed because a product was unavailable, the sales record may understate true demand. Analysts should flag these periods before training a forecasting model.
Forecast accuracy should be evaluated against a simple baseline using a consistent holdout period. Mean absolute error (MAE) can show the average size of forecast errors in units, while weighted absolute percentage error can help compare errors across products with different sales volumes. No model should be described as improving forecast accuracy until testing supports that claim.
How should businesses build a dependable data collection workflow?
E-Commerce Data Scraping is most useful when it is designed around a clear operational decision. Collecting thousands of product records without consistent identifiers, timestamps, or validation can create more work for analysts rather than improving inventory visibility.
A dependable workflow begins with scope. Businesses should define the products, websites or marketplaces, regions, fields, refresh schedule, and delivery format they need. The next step is to confirm which information is accessible and whether the proposed collection method complies with relevant website terms, access restrictions, and applicable laws.
What should an implementation plan include?
- Source assessment: Confirm available fields, page structure, location requirements, and permitted access.
- Product normalization: Standardize titles, brands, pack sizes, units, and identifiers where available.
- Scheduled collection: Capture observations at a defined frequency and retain timestamps for each record.
- Quality assurance: Detect duplicates, malformed prices, missing values, and inconsistent product matches.
- Historical storage: Preserve previous observations so teams can compare changes rather than rely on the latest snapshot alone.
- Business integration: Combine external observations with internal inventory, sales, and supplier data.
- Performance review: Measure data completeness, freshness, forecast errors, and the usefulness of alerts.
A collection pipeline should preserve the original source value alongside normalized fields. This makes it easier to investigate discrepancies and update parsing rules when a retailer changes its page layout.
The system should also record failed requests separately from product statuses. If a page could not be retrieved, the status should be "not observed" or another clearly defined technical state—not automatically "out of stock." That distinction prevents data collection problems from generating false operational alerts.
Finally, access controls and data retention should be planned from the beginning. Product-level public information can still be subject to source-specific conditions, so collection policies should be reviewed before launch and revisited as sources change.
Why choose Real Data API?
Real Data API can be considered for businesses that need structured product observations to support inventory planning, competitive monitoring, and price tracking. The appropriate service design depends on source coverage, the fields that can be accessed, update frequency, quality requirements, and how the data will be used internally.
A business-focused implementation should prioritize useful and verifiable records over raw volume. Depending on the agreed scope, a solution may support:
- Structured product information for inventory and catalog analysis.
- Timestamped observations to help track visible changes.
- Consistent field formats for reporting and analytics.
- Data-quality checks for missing values and duplicate records.
- Delivery formats that fit existing analysis or business intelligence tools.
- Documentation that explains coverage, refresh frequency, and known limitations.
An Ecommerce Scraping API may be suitable when a business needs programmatic access to structured product data rather than manual collection. Before selecting an approach, teams should confirm the available endpoints, supported sources, rate limits, authentication requirements, data fields, and service terms. These details should be verified against the actual service offering rather than assumed.
Real Data API should be evaluated against practical criteria: whether the required products and sources are supported, whether records arrive at the necessary frequency, whether product identifiers remain consistent, and whether the output can be reconciled with internal systems. A small pilot using representative products can help establish coverage and data quality before a larger rollout.
The goal is to make inventory-related decisions more informed. Data collection can reveal useful signals, but purchasing quantities, safety stock, and demand forecasts still need to be based on validated business data and appropriate operational rules.
Conclusion
Online retail data can help businesses monitor visible product availability, compare competitor listings, evaluate pricing changes, and add context to demand forecasts. The most valuable results come from combining external observations with internal sales history, current stock, supplier lead times, and replenishment rules.
A well-designed workflow should preserve timestamps, validate product matches, separate technical errors from availability statuses, and measure forecasting performance against a baseline. It should also document which sources and locations are covered so that teams understand the limits of each report.
For retailers, brands, and distributors, E-Commerce Datasets can support more informed inventory planning when the underlying records are accurate, consistent, and relevant to a defined business objective.
Ready to improve your inventory visibility and forecasting workflow? Contact Real Data API to discuss your product coverage, data refresh requirements, and a structured data collection solution tailored to your business!
FAQs
1. How does an inventory scraper help reduce stockouts?
An E-commerce data scraper for inventory analysis tracks visible product-status changes. Combined with internal stock and sales records, these signals help teams prioritize verification and replenishment decisions.
2. Which datasets are useful for competitor monitoring?
E-Commerce Datasets for Competitive Analysis can organize product listings, prices, assortment, and observed availability, helping businesses compare competitors while distinguishing public listing signals from verified inventory quantities.
3. Can product data improve pricing decisions?
Yes. e-commerce product data can reveal listed prices, pack sizes, and promotional labels, supporting comparisons when products are correctly matched and observations are timestamped.
4. What should market research collection include?
An e-commerce competitor data scraper for market research should capture source references, product identifiers, timestamps, prices, and displayed statuses while documenting coverage limitations and validation rules.
5. What should businesses check before choosing a provider?
Real Data API should be assessed for source coverage, data freshness, field consistency, quality checks, integration options, and transparent limitations before businesses commit to a larger inventory monitoring project.
Latest posts
E-commerce data scraper for inventory analysis 2027 - Real-Time Stock Tracking and Demand Forecasting

How Meesho API data extraction for product research Helps E-Commerce Brands Improve Product Selection and Market Intelligence?
How AliExpress API integration for automated data collection Streamlines Product Monitoring, Price Tracking, and Seller Intelligence
How H&M data scraping for fashion retail analytics Enhances Stock Monitoring, Apparel Pricing, and Product Category Insights







.png)



