Quick Summary
- grocery data scraping for competitive benchmarking helps grocery retailers and FMCG brands compare listed prices, product assortments, promotions, and availability to identify competitive opportunities.
- Grocery Scraping API Use Cases include recurring price monitoring, discount analysis, assortment comparisons, and structured data delivery for business intelligence systems.
- Official U.S. grocery price statistics show why consistent monitoring matters: food-at-home prices rose 11.4% in 2022, increased 1.2% in 2024, and rose 2.3% in 2025. These changes reinforce the need to analyze category-level movements rather than rely on isolated price snapshots.
Introduction
grocery data scraping for competitive benchmarking helps retailers, supermarket chains, grocery delivery businesses, and FMCG brands collect publicly accessible product information to compare prices, promotional activity, assortment, and visible availability. In 2027, this structured information can support more informed pricing decisions, category planning, and competitor analysis when combined with internal sales and margin data.
Grocery businesses face a specific challenge: prices and promotions can vary by product size, retailer, location, and collection time. A comparison based on one product page or a single snapshot may miss important changes. Teams need consistent records that allow them to compare equivalent products, track changes over time, and distinguish verified observations from assumptions.
Grocery Scraping API Use Cases can include automated price checks, promotional monitoring, product catalog comparison, and recurring data feeds for analytics platforms. The appropriate approach depends on the source, available fields, update requirements, and applicable access restrictions.
Public market statistics provide useful context for these decisions. The U.S. Department of Agriculture's Economic Research Service (USDA ERS) reported that food-at-home prices rose 11.4% in 2022, 5.0% in 2023, 1.2% in 2024, and 2.3% in 2025. For 2026, its September 2026 outlook forecast a 2.4% annual increase. These figures describe U.S. grocery-price inflation, not the prices of any particular retailer or product.
For grocery decision-makers, the central opportunity is to turn scattered online listings into consistent, verifiable data. This guide explains six practical strategies for applying that data to competitive benchmarking, with real-world statistics, structured workflows, and guidance for using the results responsibly.
How can retailers compare equivalent products more accurately?
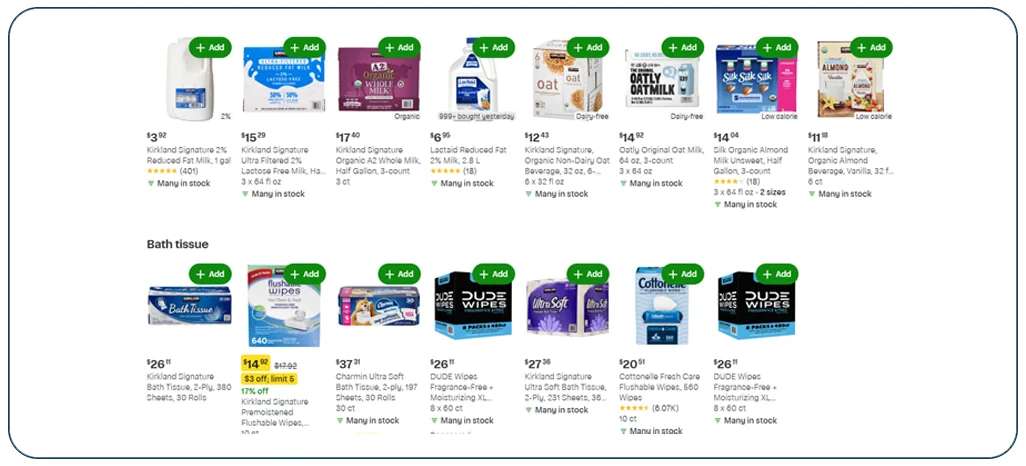
Retailers need to compare like-for-like products before changing prices or negotiating with suppliers. A dataset designed to extract grocery competitor data for pricing strategies should include product names, brands, variants, package sizes, listed prices, displayed MRPs where available, and observation timestamps.
Product matching is especially important in grocery retail. Two listings may describe similar products but differ in weight, formulation, count, or packaging. Comparing their total prices without normalizing these attributes can lead to incorrect conclusions. For example, a 1-kilogram pack and a 500-gram pack should be compared using a common unit price, not simply their displayed totals.
A useful comparison workflow includes:
- Standardize product names, brand names, variants, and units.
- Match equivalent pack sizes or calculate unit prices.
- Record the retailer, source URL, location where relevant, and capture time.
- Separate regular listed prices from promotional prices when the source identifies them.
- Flag uncertain matches for manual review rather than forcing a comparison.
What do real grocery price trends show?
USDA ERS data demonstrate that grocery inflation can vary significantly between years. The table below shows annual average price changes for U.S. food purchased for consumption at home, commonly used as a measure of grocery-price inflation. The 2026 figure is a forecast, not a final annual result.
| Year | Annual change in food-at-home prices | Data status |
|---|---|---|
| 2020 | +3.5% | Reported annual change |
| 2021 | +3.5% | Reported annual change |
| 2022 | +11.4% | Reported annual change |
| 2023 | +5.0% | Reported annual change |
| 2024 | +1.2% | Reported annual change |
| 2025 | +2.3% | Reported annual change |
| 2026 | +2.4% | USDA ERS forecast, September 2026 |
Source: USDA Economic Research Service, Food Price Outlook and historical price summaries. Figures represent U.S. food-at-home CPI changes, not individual grocery retailers' prices.
The 2022 increase was substantially higher than the changes recorded in 2024 and 2025. For grocery businesses, this is a reminder that pricing decisions should account for category-specific movements and the date of each observation. A broad inflation measure cannot explain why one brand, package, or local product changed price.
The actionable lesson is to create a consistent baseline. Compare equivalent products across retailers and dates, retain original source values, and use unit prices wherever pack sizes differ. This produces more useful evidence for pricing reviews and competitive decisions than a simple list of headline prices.
How can retailers evaluate discounts without misleading comparisons?
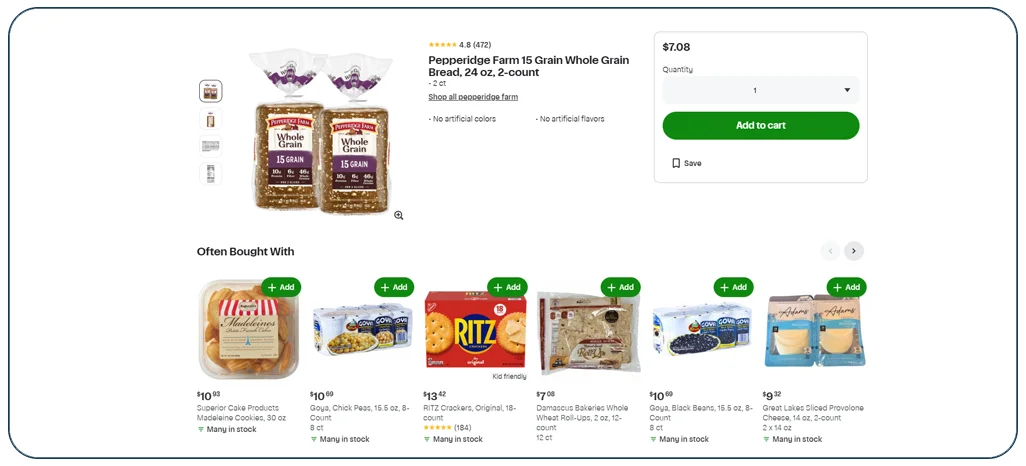
real-time grocery discount tracking for retailers helps teams monitor visible promotional labels, displayed prices, and changes in offer frequency. This can be useful for grocery category managers, pricing analysts, and FMCG brand teams that need to understand how competitors position similar products.
A discount should not be assessed by its percentage alone. The reference price, package size, offer conditions, and observation date all matter. A product advertised at 20% off may still have a higher unit price than a comparable product from another retailer. Likewise, a temporary promotion may be visible in one location but unavailable in another.
Which fields should a promotion report include?
| Field | Why it matters |
|---|---|
| Product and variant | Confirms which item is being compared |
| Displayed price | Records the visible selling price |
| MRP or reference price | Supports discount calculations where provided |
| Offer text | Preserves the promotion as displayed |
| Package size | Enables fair unit-price comparisons |
| Retailer and location | Provides context for the observation |
| Timestamp | Shows when the offer was recorded |
When both a valid reference price and displayed price are available, teams can calculate the displayed discount:
Displayed discount (%) = ((Reference price − Displayed price) ÷ Reference price) × 100
The result describes the difference between the recorded prices. It does not necessarily represent the final checkout price, which may be affected by coupons, loyalty programs, delivery fees, or payment-specific promotions.
How should businesses act on these signals?
Review promotions over a defined period rather than reacting to one observation. Measure how often products are seen with promotional labels, compare unit prices, and flag unusually large changes for verification. Then combine these findings with internal sales, margins, and promotion costs before adjusting pricing.
This process helps businesses distinguish meaningful competitive patterns from isolated offers and makes promotional decisions more defensible.
How can a consistent product catalog strengthen category analysis?
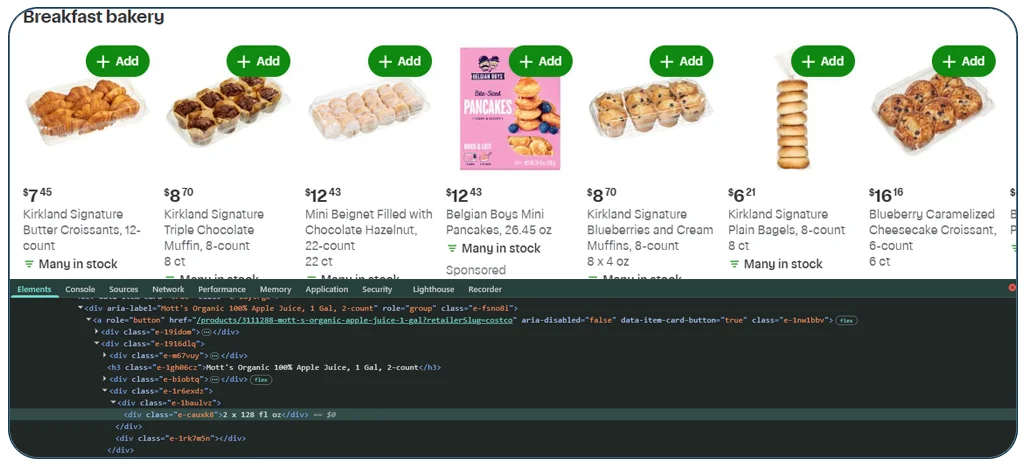
A grocery product data scraper can help organize online grocery listings into a structured catalog containing product titles, brands, categories, pack sizes, prices, product links, and other fields that are actually available from the source.
Catalog consistency matters because retailers often use different naming conventions for equivalent products. A brand may appear with abbreviations, alternate pack descriptions, or variations in punctuation. Without normalization, the same product can be counted several times, while similar but different products may be mistakenly grouped together.
A robust workflow should retain the original product title and create separate normalized fields for brand, variant, quantity, and category. Stable identifiers such as GTINs or retailer SKUs can improve matching when available, but businesses should not assume every listing exposes them.
What does the wider retail market tell us?
The U.S. Census Bureau reported that total U.S. retail e-commerce sales reached $340.2 billion in the second quarter of 2026, accounting for 17.1% of total retail sales. This figure covers all retail e-commerce, not grocery alone, but it demonstrates the scale of the online retail environment in which digital product information is used.
For grocery category teams, the practical implication is to maintain a catalog that supports both retailer-level and product-level comparisons. Track product counts by category, the share of listings with valid prices, the number of uncertain matches, and changes in assortment between observation periods.
Do not equate the number of online listings with sales volume or consumer demand. A larger visible assortment may reflect pack-size variations or duplicate pages rather than more products sold.
Need a clearer view of competitor assortments and product listings? Contact Real Data API to discuss your grocery data requirements, source coverage, and structured reporting needs!
Get Insights Now!How can price histories help retailers identify meaningful changes?
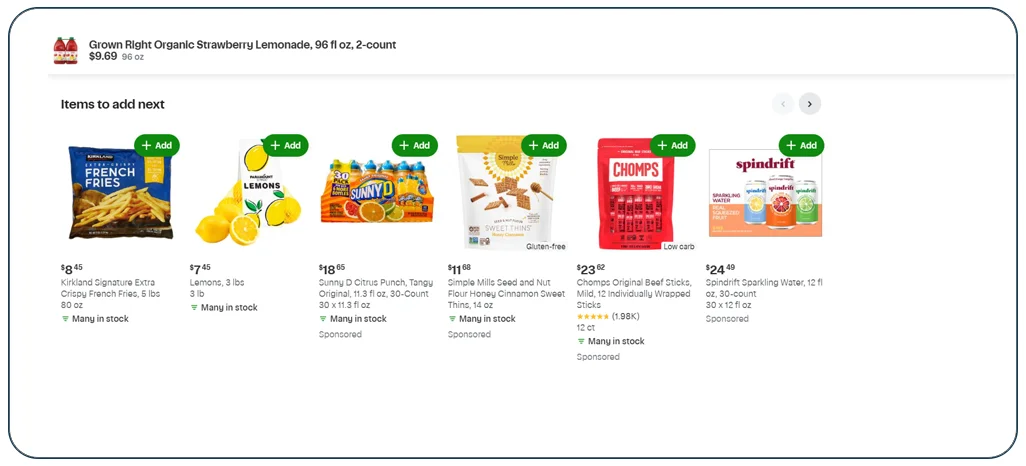
grocery price data extraction for retailers can create timestamped records that make it easier to compare prices across products, stores, and time periods. A single snapshot shows what was listed at one moment. A validated historical series helps teams understand whether a change is temporary, recurring, or part of a longer pattern.
The collection process should preserve product identity, package size, displayed price, source, retailer, location where relevant, and capture time. When prices are missing or a page fails to load, the record should indicate that the product was not successfully observed. It should not automatically assign a zero price or mark the item as unavailable.
How can teams use historical observations?
- Identify price changes: Compare current observations with the previous valid price.
- Measure price stability: Calculate the frequency and size of changes over a consistent period.
- Review category patterns: Compare price movement across equivalent products and categories.
- Investigate outliers: Flag unusually large changes for verification before decisions are made.
- Support pricing reviews: Combine competitor observations with internal margins and sales data.
Historical context is particularly useful during periods of volatile food prices. USDA ERS reported that food-at-home prices increased 11.4% in 2022, followed by slower annual increases in 2023 and 2024. Those national figures do not prove that any particular grocery listing followed the same pattern; they show why businesses benefit from monitoring their own products rather than assuming every category moves together.
Retailers should also distinguish nominal price changes from changes in product size. A product may retain the same shelf price while its package quantity changes. Unit-price calculations can expose this difference and improve the quality of competitive comparisons.
A dependable historical dataset supports informed investigation, but it does not explain the cause of every price movement. Procurement costs, promotions, regional availability, and supplier terms may all contribute and should be evaluated separately.
How can recurring data collection support better decisions?
Grocery Data Scraping is most useful when it follows a repeatable process with clear objectives, consistent field definitions, and data-quality checks. Collecting a large volume of listings without reliable timestamps or product matching can create more work for analysts and lead to inaccurate conclusions.
A practical collection workflow starts by defining the business question. A pricing team may prioritize comparable prices and promotional labels, while a category manager may focus on product assortment and availability. The source, geographic scope, fields, refresh frequency, and delivery format should be agreed upon before implementation.
What should a reliable workflow include?
- Source assessment: Confirm accessible fields, page behavior, location requirements, and permitted access.
- Structured collection: Capture relevant product details consistently and preserve the source reference.
- Normalization: Standardize product names, brands, units, categories, and package sizes.
- Validation: Check duplicates, missing prices, malformed values, and questionable product matches.
- Historical storage: Retain earlier observations for trend analysis and auditability.
- Business integration: Connect external observations with internal sales, margin, and inventory data.
- Performance review: Measure data completeness, freshness, and the usefulness of resulting insights.
Collection frequency should match the decision being supported. A retailer tracking fast-moving promotions may need more frequent observations than a team conducting a monthly category review. Higher frequency is not automatically better if it creates duplicate records or exceeds source access limits.
Businesses should also document technical failures separately from product statuses. A timeout, blocked request, or missing page is not evidence that a product is out of stock. Clear status definitions reduce false alerts and prevent analysts from confusing data-collection problems with market changes.
Finally, teams should review website terms, access controls, applicable laws, and data-retention requirements before launching recurring collection. Responsible collection practices help protect the reliability and sustainability of the workflow.
How can an API make grocery data easier to use?
A Grocery Scraping API can provide a programmatic way to request or receive structured product observations where the service supports the required sources and fields. Instead of manually collecting data from individual pages, a business can integrate agreed data outputs into its reporting, analysis, or business intelligence workflows.
Before selecting an API-based solution, buyers should verify the details that directly affect the use case:
- Supported retailers, sources, and product categories.
- Available product, price, offer, and availability fields.
- Update frequency and how timestamps are provided.
- Authentication, rate limits, error handling, and service terms.
- Output formats and integration requirements.
- Data validation, historical coverage, and documentation.
- Geographic limitations and any known gaps in source coverage.
An API does not guarantee that every grocery listing can be collected, that every source updates instantly, or that historical data exists before collection begins. Those details must be confirmed during project scoping.
What should a pilot test measure?
Start with a representative sample of products and retailers. Measure the percentage of records with valid product names and prices, the proportion of products matched correctly, the frequency of missing observations, and the time between collection and reporting. Compare results against a manually verified sample before scaling up.
A pilot should also test how the output handles price changes, discontinued listings, promotions, and technical errors. If a field is not available, the data documentation should state that limitation instead of filling the gap with an assumption.
For retailers and brands, the goal is to obtain data that can be used consistently—not simply to automate collection. An API-driven workflow becomes valuable when its records are accurate enough to support pricing reviews, category comparisons, and decisions that can be checked against internal business results.
Why choose Real Data API?
Grocery businesses need data that fits their decisions, systems, and reporting schedules. Real Data API can be evaluated as a data collection partner based on the sources supported, available fields, collection frequency, validation approach, and integration requirements agreed upon for a project.
A useful solution should focus on data quality and business relevance. Depending on source availability and project scope, the workflow may support product catalog collection, price monitoring, promotion analysis, and structured delivery for downstream reporting.
What should grocery businesses expect from a practical solution?
- Consistent data structure: Standardized fields make product and price comparisons easier.
- Documented coverage: Clear source and geographic coverage helps teams understand what the dataset represents.
- Quality checks: Duplicate detection, validation rules, and missing-value flags make errors easier to identify.
- Historical observations: Saved snapshots help teams evaluate changes across collection periods.
- Integration readiness: Structured outputs can support analytics and reporting systems.
- Transparent limitations: Documentation should distinguish observed listing information from verified sales or inventory.
Grocery Datasets are most valuable when they are tailored to a defined business objective. A pricing team may need unit prices and offer details, while a category manager may prioritize product assortment and availability. Defining these requirements before collection helps avoid paying for irrelevant fields or overlooking essential ones.
Before a full rollout, businesses should request a pilot with representative products and sources. The pilot should test field completeness, product-matching accuracy, refresh timing, and error handling. These measurable checks help buyers determine whether the collected data is suitable for operational decisions.
Conclusion
Grocery retailers and FMCG brands can make more informed decisions by comparing equivalent products, monitoring promotional changes, maintaining consistent catalogs, and preserving timestamped price observations. Public inflation statistics demonstrate why price movements deserve attention, but individual pricing decisions must rely on verified product-level observations and internal commercial data.
A successful benchmarking workflow combines reliable collection, clear product matching, data validation, and analysis that accounts for package sizes, locations, promotions, and source limitations. It should help teams investigate meaningful changes rather than automatically react to every difference in a listing.
If your business is planning grocery data scraping for competitive benchmarking, start by defining the retailers, product categories, geographic coverage, and reporting frequency that matter most. Then validate the data against a representative sample before expanding the project.
Contact Real Data API to discuss your grocery data collection needs and explore a tailored approach to product pricing, competitor monitoring, and retail market intelligence!
FAQs
1. How does grocery data help retailers compare competitors?
grocery data scraping for competitive benchmarking helps retailers compare equivalent product prices, promotional labels, and assortment changes using consistent, timestamped observations and verified product matching.
2. Which business processes can benefit from grocery scraping?
Grocery Scraping API Use Cases include recurring price monitoring, promotion analysis, product catalog comparison, and structured data delivery for retail reporting and business intelligence workflows.
3. How can grocery price comparisons remain accurate?
extract grocery competitor data for pricing strategies by matching brands, variants, pack sizes, and units, then comparing timestamped prices and verifying unusual differences before making decisions.
4. Why should retailers track promotional changes frequently?
real-time grocery discount tracking for retailers helps teams observe displayed offer changes, compare unit prices, and investigate promotions while accounting for collection frequency and source limitations.
5. What should buyers check before selecting a data provider?
A grocery product data scraper should be evaluated for source coverage, field completeness, data freshness, product-matching accuracy, integration options, transparent limitations, and compliance with applicable access requirements.
Latest posts
E-commerce data scraper for inventory analysis 2027 - Real-Time Stock Tracking and Demand Forecasting
How Meesho API data extraction for product research Helps E-Commerce Brands Improve Product Selection and Market Intelligence?
How AliExpress API integration for automated data collection Streamlines Product Monitoring, Price Tracking, and Seller Intelligence
How H&M data scraping for fashion retail analytics Enhances Stock Monitoring, Apparel Pricing, and Product Category Insights







.png)



