TL;DR
- e-commerce datasets for competitive analysis help retailers and brands compare competitor pricing, products, promotions, availability, assortment, and market movements from structured historical data.
- Web Scraping Services can automate collection from permitted public sources, transforming scattered ecommerce information into standardized datasets for pricing teams, category managers, market researchers, and business analysts.
- The result is faster benchmarking, stronger pricing decisions, better assortment planning, and earlier visibility into competitor moves.
Introduction
Businesses can solve pricing, product, and market-intelligence challenges by converting fragmented online retail information into structured, historical datasets. These datasets allow decision-makers to compare competitors, identify price changes, monitor assortment, understand availability, and detect emerging market patterns.
e-commerce datasets for competitive analysis give brands a consistent way to move beyond manual competitor checks. Instead of examining individual product pages periodically, teams can analyze standardized records containing product names, brands, categories, SKUs, prices, promotions, ratings, availability, and timestamps.
This matters because ecommerce has become a major component of retail. U.S. ecommerce sales reached $815.4 billion in 2020, a 43% increase from 2019, according to the U.S. Census Bureau. By 2025, annual U.S. retail ecommerce sales had reached an estimated $1.2337 trillion, representing 16.4% of total retail sales.
At the global level, UN Trade and Development estimates that business ecommerce sales across 45 developed and developing economies reached approximately $28 trillion in 2024.
Web Scraping Services can support this expanding intelligence requirement by collecting permitted publicly accessible product and market information at defined intervals.
The core value is not simply more data. It is comparable, timely, historical data that answers specific business questions.
For example:
- Which competitor reduced prices?
- Which products were newly launched?
- Which SKUs disappeared?
- Which brands expanded their assortment?
- Where are products repeatedly unavailable?
- Which categories have become more promotional?
- How has a competitor's positioning changed over time?
These answers can directly influence pricing, merchandising, procurement, category management, and growth strategy.
How Can Product Data Improve Market Research?

web scraping e-commerce product data for market research can help organizations create structured visibility across large and constantly changing product catalogs.
The challenge for market researchers is scale. A single category can contain thousands of SKUs distributed across multiple retailers and marketplaces. Manually recording every product attribute is slow, inconsistent, and difficult to maintain.
A structured collection workflow can capture:
- Product title
- Brand
- SKU
- Product category
- Subcategory
- Product URL
- Current price
- Original price
- Discount
- Availability
- Product variants
- Ratings and reviews where publicly available
- Promotional information
- Collection timestamp
Once standardized, this information becomes much more useful for market research.
The ecommerce market's expansion since 2020 demonstrates why longitudinal product information matters. U.S. ecommerce sales increased sharply during the pandemic and continued growing afterward. Annual ecommerce sales reached $1.1926 trillion in 2024 and $1.2337 trillion in 2025.
| Year | U.S. ecommerce sales / indicator | Research implication |
|---|---|---|
| 2020 | $815.4B | Establish pandemic-era baseline |
| 2021 | $1.028T | Monitor accelerated adoption |
| 2022 | $1.117T | Analyze market normalization |
| 2023 | Continued expansion | Compare category development |
| 2024 | $1.1926T | Analyze mature online competition |
| 2025 | $1.2337T | Benchmark current market scale |
| 2026 | Current-year monitoring | Build forward-looking datasets |
The 2020-2022 annual figures for electronic shopping and mail-order houses come from the Census Bureau's Annual Retail Trade Survey.
For a market researcher, historical snapshots can reveal how categories evolve. A category that contained 500 products in 2022 and 900 products in 2026 has experienced a very different competitive trajectory from a category that remained stable.
The same approach can identify new brands, discontinued products, assortment expansion, premiumization, and category fragmentation.
The practical advantage is that analysts can move from observing individual products to understanding market structure.
How Does Competitor Product Monitoring Improve Strategic Decisions?
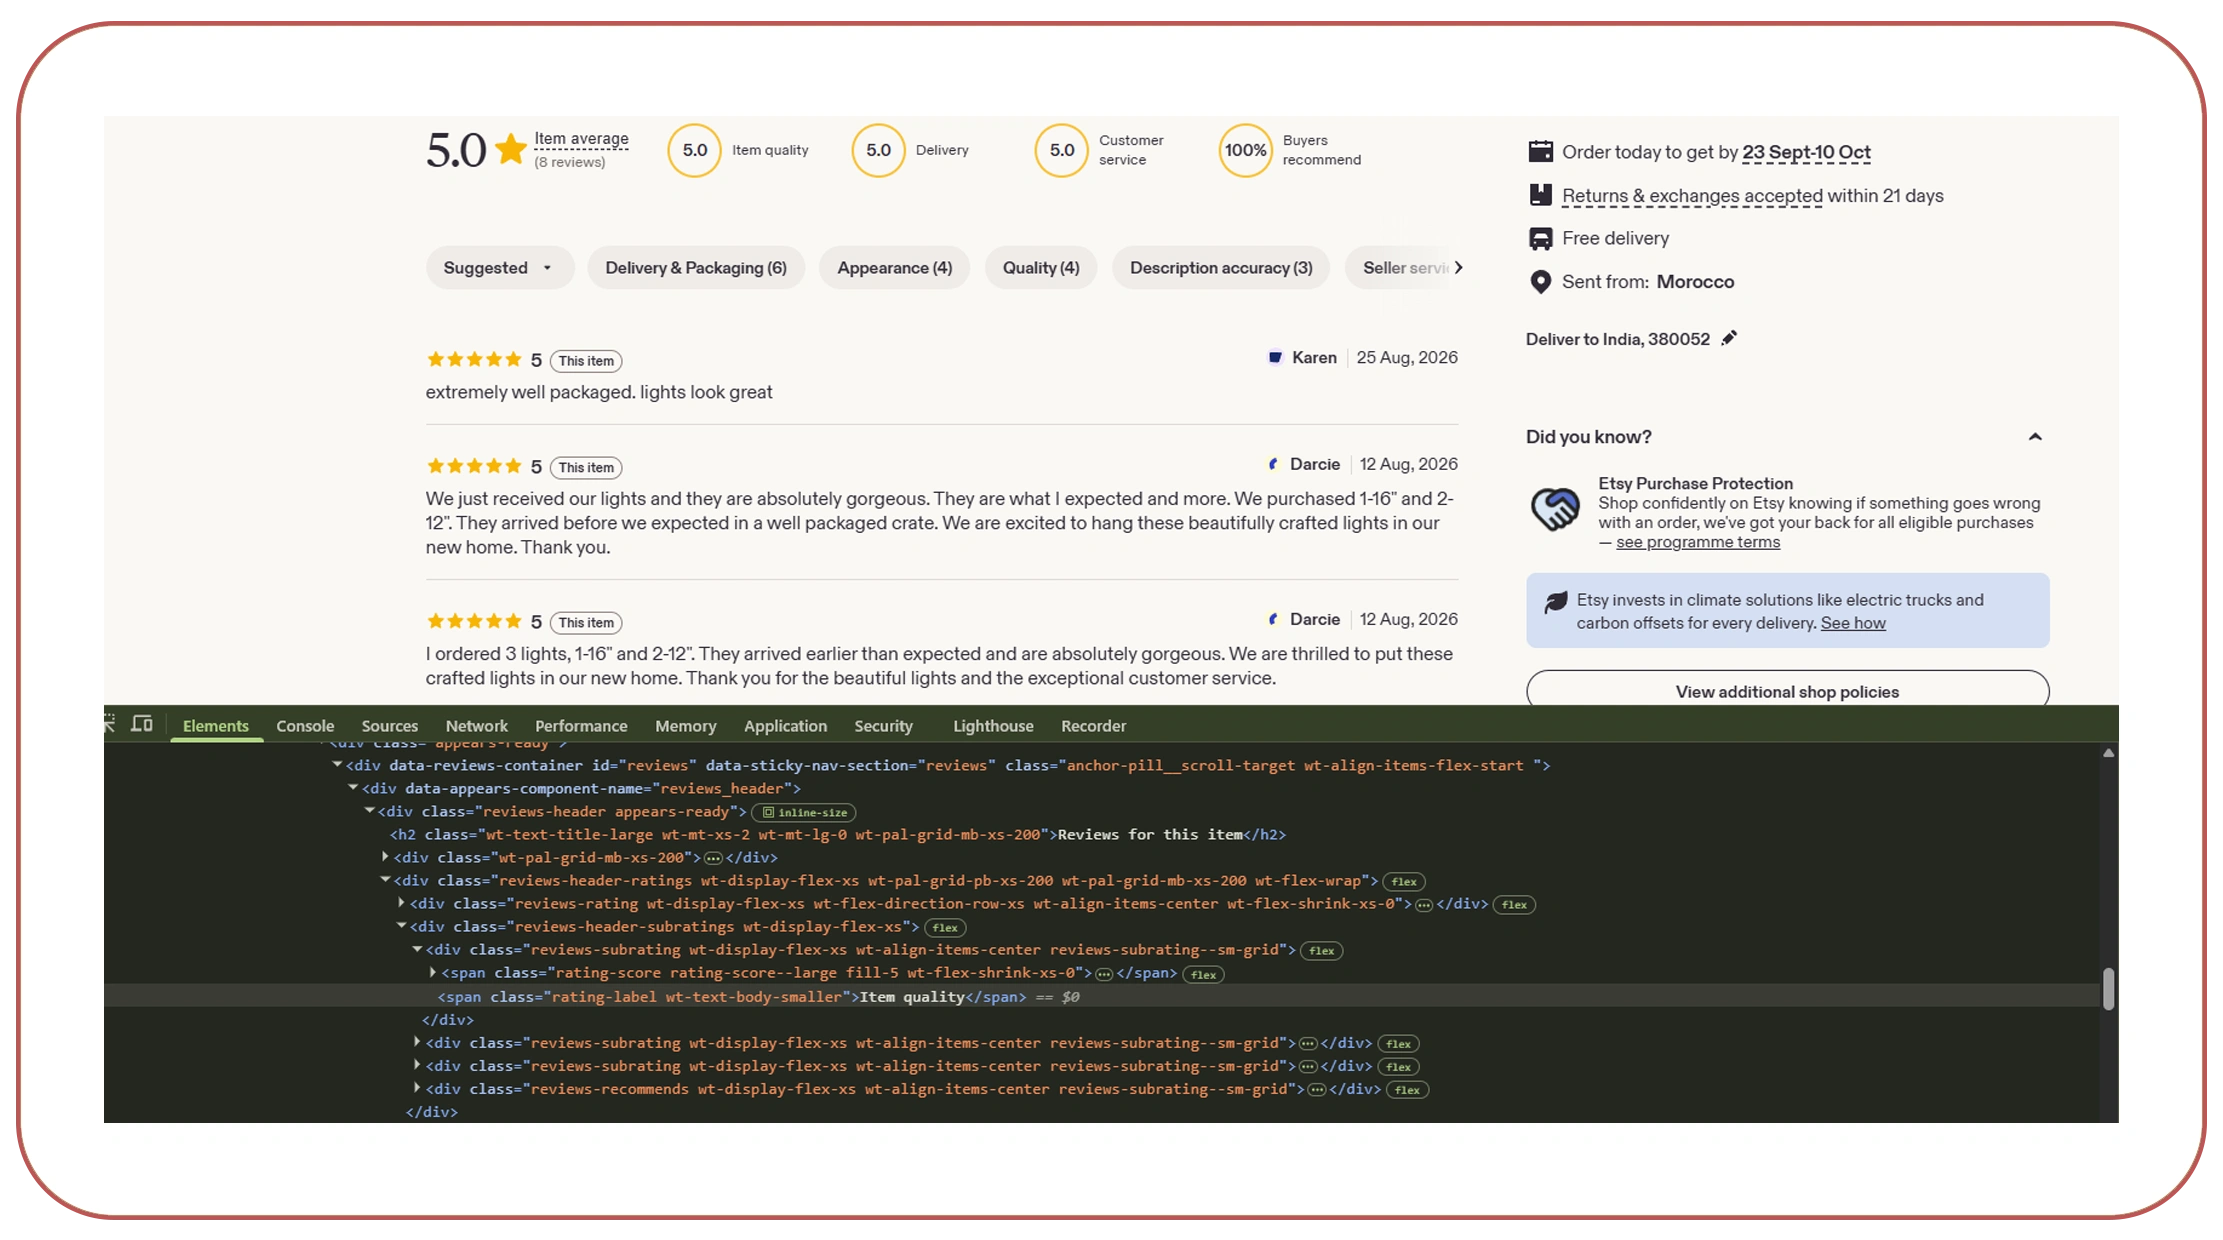
e-commerce product data scraping for competitor research enables businesses to benchmark their product presence against competing retailers and brands.
Competitive research often fails when it relies only on occasional manual checks. A competitor may launch a product, change its description, introduce a new variant, or discontinue an SKU between two manual reviews.
Historical product observations solve this problem.
A structured dataset can show:
- When a product first appeared.
- How its price changed.
- Whether availability fluctuated.
- Whether new variants were introduced.
- Whether the product was promoted.
- When it disappeared.
- How the competitor's overall assortment changed.
This is especially important as online retail continues to expand. UN Trade and Development reports that business ecommerce sales across 43 economies approached $25 trillion in 2021 and were estimated to rise to almost $27 trillion in 2022.
| Year | Ecommerce environment | Competitive research priority |
|---|---|---|
| 2020 | Rapid online transition | Establish competitor baselines |
| 2021 | Accelerated ecommerce | Expand competitor coverage |
| 2022 | Market normalization | Compare product portfolios |
| 2023 | Increasing digital competition | Track launches and removals |
| 2024 | $28T global business ecommerce* | Benchmark categories |
| 2025 | Continued digital expansion | Monitor strategic shifts |
| 2026 | AI-driven intelligence | Automate competitive analysis |
*UNCTAD's 2024 estimate covers 45 economies and represents approximately three quarters of global GDP and exports.
A retailer can use these records to calculate assortment overlap.
For example:
Assortment overlap = Shared competitor SKUs ÷ Total monitored SKUs × 100
This helps identify categories where competitors offer highly similar selections and categories where a brand has differentiated its assortment.
Another useful measure is new-product velocity, which tracks how many new products a competitor introduces over a defined period.
These metrics help category managers identify where competitive pressure is increasing before it becomes obvious through sales performance.
The result is a more proactive strategy. Instead of responding after a competitor captures market share, businesses can identify product and assortment changes earlier.
How Can Pricing Data Reveal Competitive Opportunities?
extract e-commerce pricing data for market research workflows allow businesses to transform changing online prices into historical pricing intelligence.
Price is one of the easiest ecommerce variables for customers to compare, which makes it one of the most important competitive signals.
However, a current price alone tells only part of the story.
A $49 product might be:
- Permanently positioned at $49.
- Temporarily discounted from $69.
- Reduced from $55.
- Matched to a competitor.
- Part of a weekend promotion.
- Available only to certain customers.
Historical observations provide the missing context.
The U.S. ecommerce market illustrates the scale of online pricing competition. Census Bureau data shows annual U.S. retail ecommerce sales increasing from $815.4 billion in 2020 to $1.2337 trillion in 2025.
| Year | U.S. annual ecommerce sales | Pricing intelligence focus |
|---|---|---|
| 2020 | $815.4B | Detect rapid market changes |
| 2021 | $1.028T | Track competitor normalization |
| 2022 | $1.117T | Compare promotional behavior |
| 2023 | Expanding market | Monitor category pricing |
| 2024 | $1.1926T | Benchmark price positioning |
| 2025 | $1.2337T | Analyze mature competition |
| 2026 | Current period | Monitor live market movements |
Businesses can use historical pricing datasets to calculate:
Price gap = Competitor price − Own price
Discount depth = (Regular price − Promotional price) ÷ Regular price × 100
Price index = Own price ÷ Average competitor price × 100
These indicators can reveal where a retailer is overpriced, underpriced, or positioned competitively.
Pricing analysis also becomes more valuable when combined with availability. A competitor with the lowest price but poor stock availability may not represent the same competitive threat as a competitor offering a similar price with consistent inventory.
This is why pricing intelligence should be connected to product, assortment, and availability data rather than analyzed independently.
Want to convert competitor prices into actionable market intelligence? Build a historical pricing dataset that shows not only what competitors charge, but how and when their prices change.
Get Insights Now!How Can Real-Time Product Feeds Improve Decision-Making?
An e-commerce API for real-time product data can help businesses access structured product information through an automated pipeline instead of repeatedly collecting and manually processing individual pages.
This approach is valuable when product information changes frequently.
For example, a pricing team may require hourly updates for highly competitive products, while a market researcher may only need weekly category snapshots.
The appropriate frequency depends on the business problem.
| Year | Market development | Data-delivery requirement |
|---|---|---|
| 2020 | Ecommerce acceleration | Establish frequent snapshots |
| 2021 | Digital adoption expands | Automate collection |
| 2022 | Online retail normalizes | Increase historical coverage |
| 2023 | Competitive monitoring grows | Improve refresh frequency |
| 2024 | Ecommerce reaches $1.19T in U.S. sales | Scale category coverage |
| 2025 | Ecommerce reaches $1.23T | Connect data to analytics |
| 2026 | AI adoption accelerates | Deliver machine-readable feeds |
The Census Bureau estimated U.S. ecommerce sales at $1.2337 trillion for 2025, up 5.4% from 2024. Ecommerce represented 16.4% of total U.S. retail sales in 2025.
Real-time or near-real-time feeds can support:
- Price-change alerts
- New-product alerts
- Stock-status monitoring
- Assortment-change detection
- Promotional monitoring
- Competitor benchmarking
- Category dashboards
- Automated reporting
A useful feed should include timestamps because the same product can have different values throughout the day.
| Product | 9 AM | 1 PM | 6 PM | Change |
|---|---|---|---|---|
| Product A | $39.99 | $39.99 | $34.99 | -12.5% |
| Product B | $24.99 | $22.99 | $22.99 | -8.0% |
| Product C | $59.99 | OOS | OOS | Availability change |
Such records can feed automated alerting systems.
The critical distinction is between data collection and decision automation. An API becomes commercially valuable when its output connects directly to pricing engines, dashboards, BI platforms, internal databases, or analytical models.
What Makes a Competitive Dataset Useful for Business Intelligence?
An E-Commerce Dataset becomes strategically useful when it contains consistent fields, historical observations, reliable timestamps, and enough context to compare products across retailers or marketplaces.
A large dataset is not automatically a good dataset.
For competitive intelligence, quality usually matters more than raw volume.
A decision-ready dataset should ideally provide:
- Unique product identifiers
- Brand and manufacturer
- Product category
- Product title
- Price and currency
- Promotional price
- Discount
- Availability
- Product variants
- Retailer
- URL
- Timestamp
- Historical observations
The need for structured information is supported by the growing size of ecommerce markets. UNCTAD estimates that business ecommerce sales across 45 economies reached $28 trillion in 2024.
| Year | Market signal | Dataset opportunity |
|---|---|---|
| 2020 | Ecommerce accelerates | Create historical baselines |
| 2021 | Business ecommerce approaches $25T across 43 economies | Expand coverage |
| 2022 | Estimated nearly $27T | Track category changes |
| 2023 | Continued expansion | Increase historical depth |
| 2024 | $28T across 45 economies | Strengthen global benchmarking |
| 2025 | Digital commerce continues growing | Integrate analytics |
| 2026 | Current market | Apply predictive intelligence |
A competitive dataset can support several analytical models.
Price benchmarking
Compare the same or comparable products across retailers.
Assortment benchmarking
Measure the number and type of products each competitor carries.
Availability analysis
Identify recurring stock-outs and gaps.
Promotional intelligence
Measure frequency, duration, and depth of discounts.
Market-entry analysis
Identify categories with high product diversity and competitive intensity.
Product lifecycle analysis
Track launches, price maturation, promotions, and discontinuation.
The most advanced organizations can combine these dimensions.
For example, a category manager may discover that a competitor has increased its assortment by 25%, reduced prices on core products, and introduced new premium variants.
That combination is much more strategically meaningful than any single metric.
How Can Automated Data Collection Build Long-Term Competitive Intelligence?
ECommerce Data Scraping can help businesses establish recurring snapshots of online product markets and preserve historical evidence of competitive changes.
The biggest strategic advantage of historical data is context.
A single snapshot answers:
What does the market look like today?
A historical dataset answers:
How did the market get here?
That distinction can materially improve business decisions.
Consider a retailer that observes a competitor's 15% price reduction. Without history, the business may immediately respond with its own discount.
With six months of historical observations, the retailer may discover that the competitor makes similar reductions every quarter and typically restores prices within ten days.
The correct response could therefore be different.
| Year | Data maturity | Strategic use |
|---|---|---|
| 2020 | Basic collection | Establish market baselines |
| 2021 | Automated collection | Monitor competitor changes |
| 2022 | Historical datasets | Analyze recurring patterns |
| 2023 | Cross-retailer analysis | Benchmark market position |
| 2024 | Integrated analytics | Connect data to decisions |
| 2025 | AI-supported analysis | Detect complex patterns |
| 2026 | Predictive intelligence | Anticipate market movements |
This evolution mirrors ecommerce growth. U.S. electronic shopping and mail-order sales increased from $888.5 billion in 2020 to $1.028 trillion in 2021 and $1.117 trillion in 2022.
Long-term collection can reveal:
- Seasonal price patterns
- Repeated promotional cycles
- Competitor launch behavior
- Category expansion
- Product discontinuation
- Availability volatility
- Brand entry and exit
- Price convergence
- Assortment differentiation
Businesses can then convert these patterns into alerts and dashboards.
For example:
Competitive pressure score = Price gap + assortment overlap + promotional intensity + availability strength
The exact weighting should be customized to the business. A luxury brand may prioritize assortment and positioning, while a mass retailer may give greater weight to price and availability.
The key is that historical ecommerce data creates a foundation for explainable competitive intelligence.
Why Choose Real Data API?
Real Data API is designed around a practical problem: businesses need structured market information that can be integrated into existing analytics and decision-making systems.
The value of Price Comparison increases significantly when price observations are combined with product identity, category, availability, promotion, and timestamp information.
Instead of delivering isolated prices, a structured data pipeline can create a historical competitive view.
For example, pricing teams can use the data to benchmark competitor prices. Category teams can compare assortment depth. Market researchers can identify emerging brands. Ecommerce managers can monitor product availability. Executives can use dashboards to understand market movements.
A strong data provider should also support scalable delivery. Depending on the use case, businesses may require APIs, JSON, CSV, databases, cloud storage, or direct integration with business-intelligence platforms.
Data quality is equally important.
Duplicate records, inconsistent product names, missing prices, incorrect categories, and stale availability values can distort competitive analysis. Therefore, normalization and validation should be treated as core parts of the data pipeline.
Real Data API can help businesses build structured workflows around recurring product and market-data requirements.
The broader market makes this increasingly valuable. U.S. retail ecommerce sales reached $1.2337 trillion in 2025, while global business ecommerce sales across 45 economies reached an estimated $28 trillion in 2024.
For a brand competing across digital channels, reliable external-market data can complement internal sales information and create a more complete picture of market performance.
The objective should not be to collect every possible data point. It should be to collect the right competitive signals at the right frequency and make them usable for business decisions.
Conclusion
e-commerce datasets for competitive analysis help businesses move from reactive competitor monitoring to structured, evidence-based market intelligence.
The approach is straightforward:
- Define the competitive questions.
- Identify permitted public data sources.
- Collect relevant product, price, promotion, and availability information.
- Normalize product and category fields.
- Store historical observations.
- Compare competitors using consistent metrics.
- Deliver alerts and insights to decision-makers.
The growth of ecommerce makes this approach increasingly important. U.S. retail ecommerce sales increased from $815.4 billion in 2020 to $1.2337 trillion in 2025. In 2025, ecommerce represented 16.4% of total U.S. retail sales.
At the global level, UNCTAD estimates business ecommerce sales reached $28 trillion across 45 developed and developing economies in 2024.
For brands, retailers, marketplaces, and market-research organizations, these numbers represent more than market growth. They represent a larger and more competitive digital environment in which pricing, assortment, availability, and product positioning can change rapidly.
The winning strategy is not simply to collect more data. It is to build a reliable intelligence layer that transforms changing ecommerce information into decisions.
Partner with Real Data API to build structured, scalable ecommerce datasets designed around your competitive-analysis goals!
FAQs
What are e-commerce datasets for competitive analysis?
They are structured collections of product, pricing, availability, promotion, assortment, and competitor information used to benchmark markets and identify strategic ecommerce opportunities.
How can Web Scraping Services support competitive research?
Web Scraping Services can automate permitted public-data collection, helping businesses monitor competitor products, prices, promotions, availability, and assortment changes across digital retail channels.
What is an E-Commerce Dataset?
An E-Commerce Dataset is a structured collection of online retail information, typically containing products, prices, brands, categories, availability, promotions, and timestamps for analysis.
Why use ECommerce Data Scraping for market intelligence?
ECommerce Data Scraping creates recurring observations that can reveal pricing movements, assortment changes, product launches, promotional patterns, and competitive shifts over time.
How does Price Comparison help retailers?
Price Comparison identifies differences between competitors, helping retailers evaluate positioning, detect pricing gaps, monitor promotions, and make more informed pricing decisions using Real Data API.
Latest posts
How WooCommerce scraper API for product data Helps Businesses Overcome Pricing, Product Availability, and Market Intelligence Challenges?
How Fandango API data extraction for movie market intelligence Helps Track Box Office Demand and Audience Trends
How A Flipkart Scraper For Product Data Extraction Tracks Product Reviews, Ratings, Prices, And Availability
How Amazon API for real-time ecommerce data Solves Pricing, Availability, and Competitor Monitoring Challenges?






.png)



