Introduction
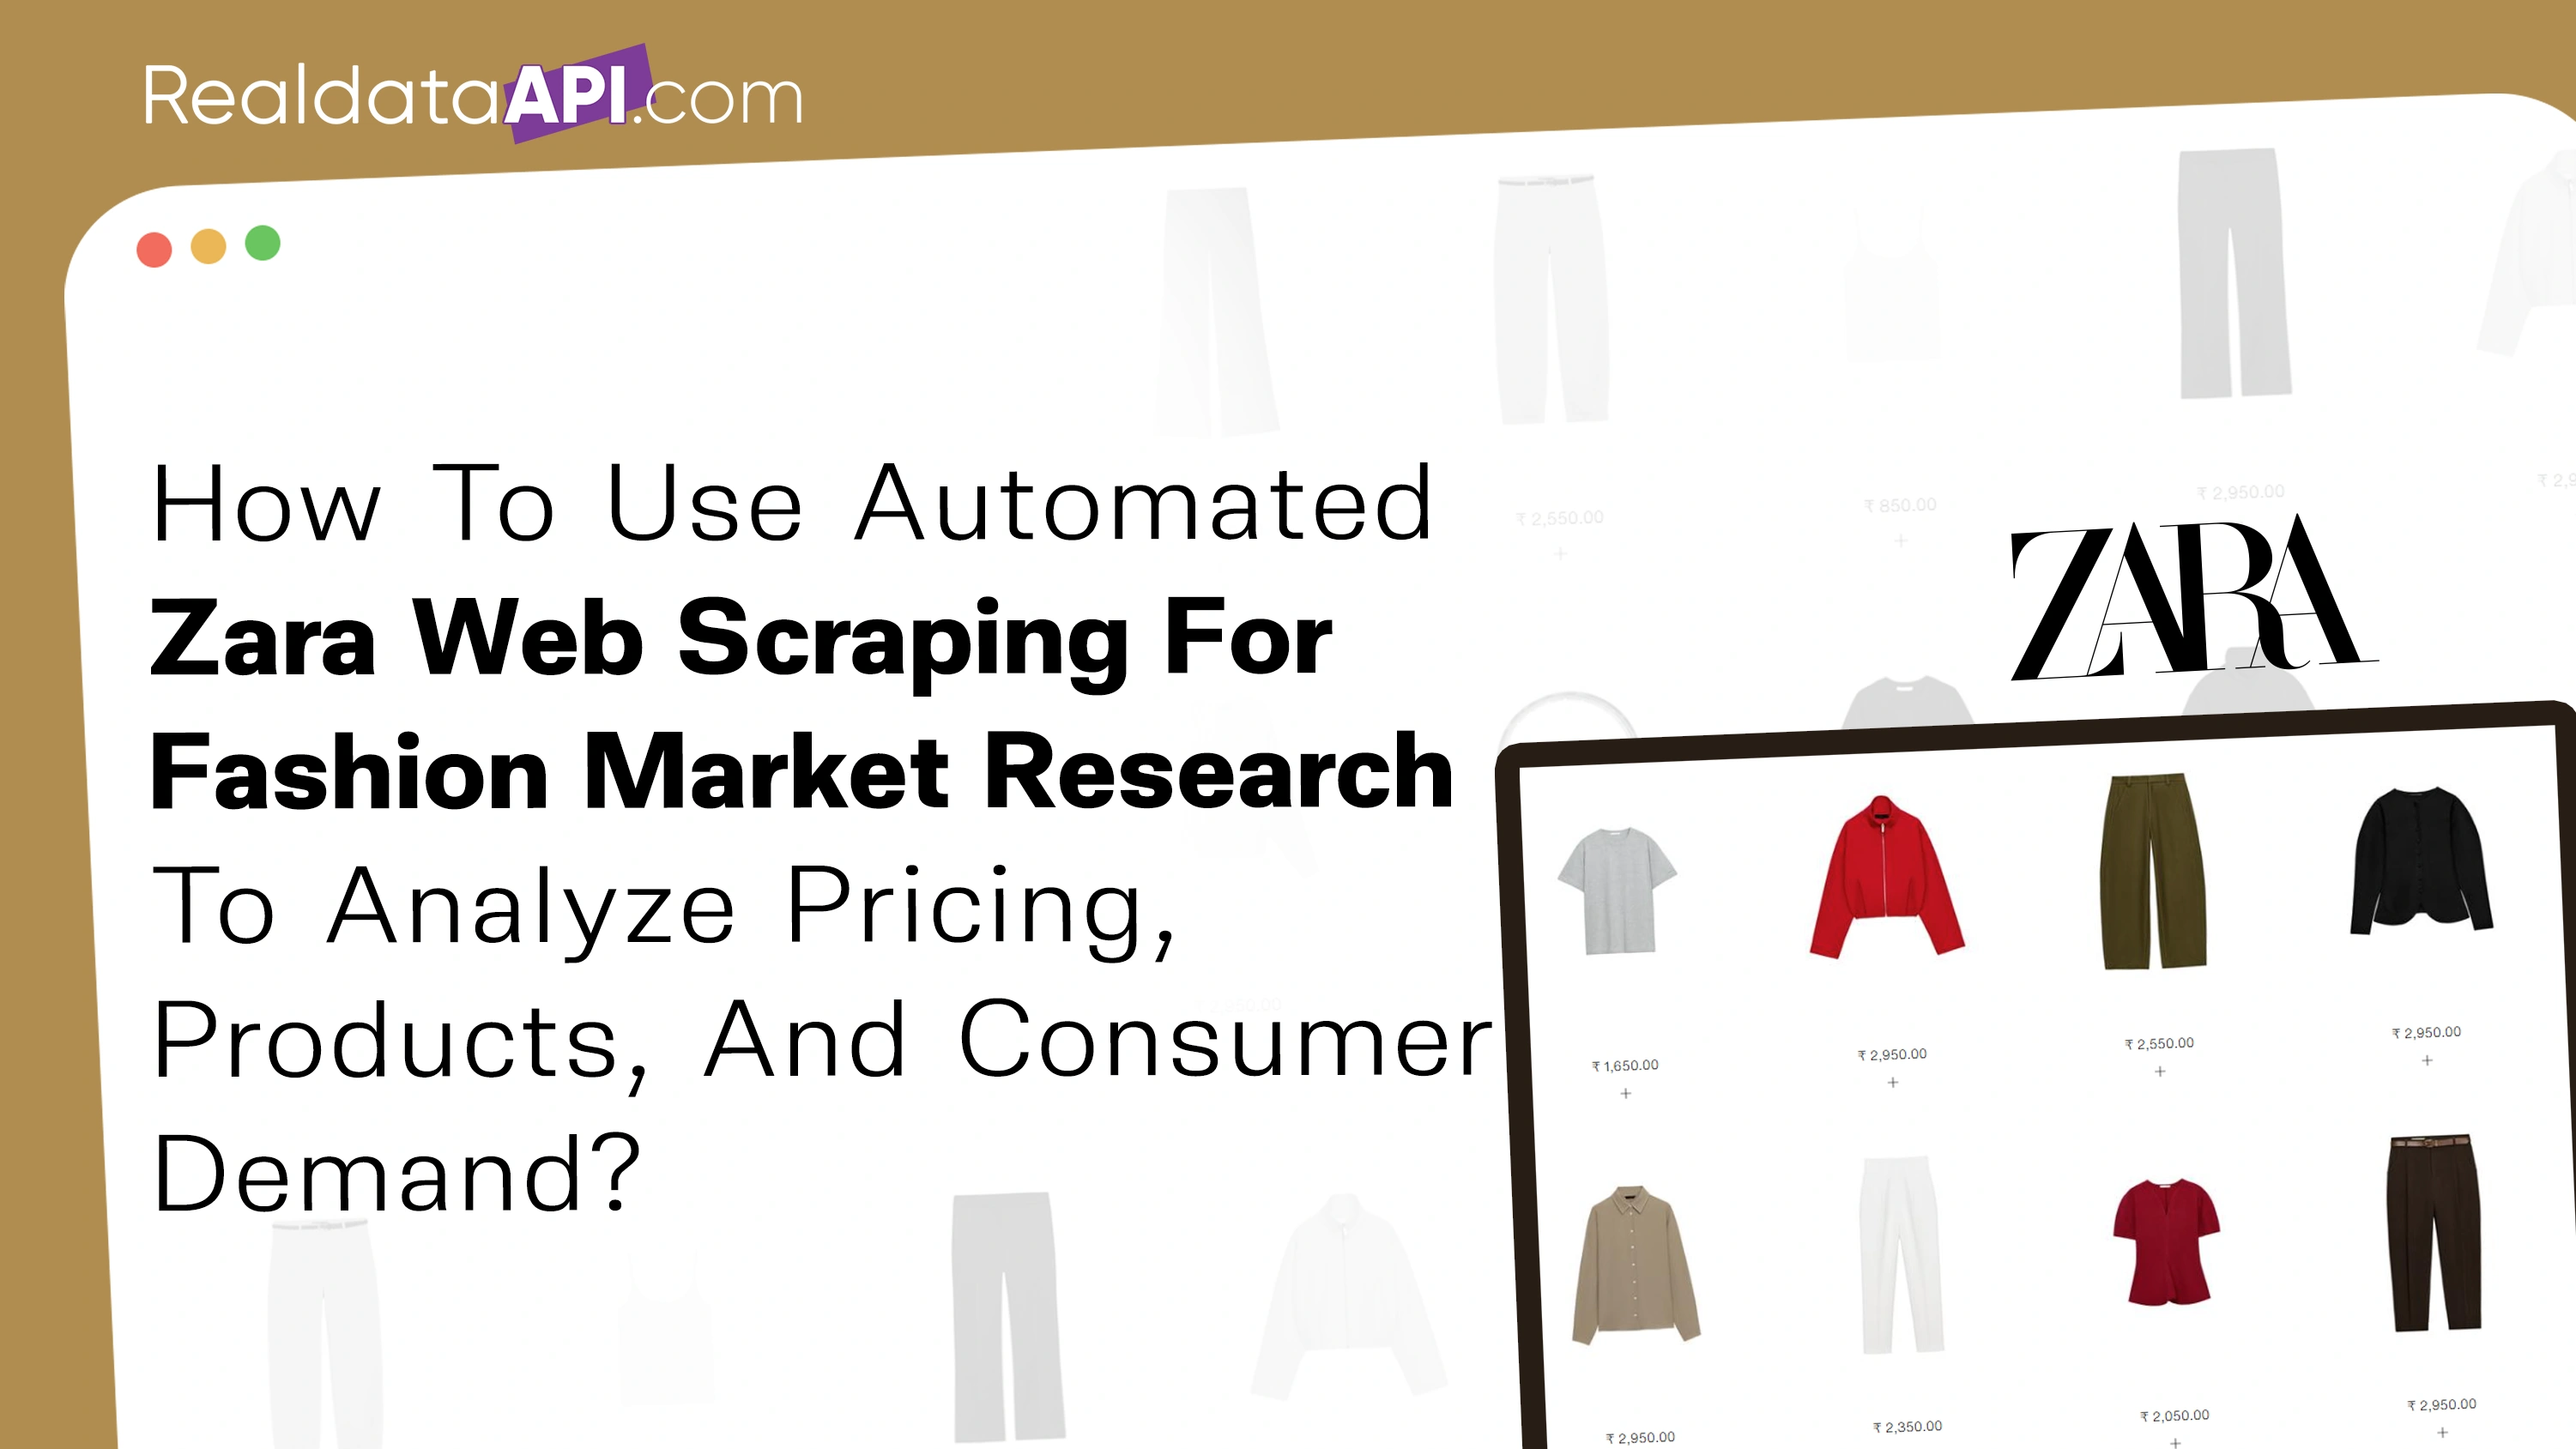
Automated Zara web scraping for fashion market research helps fashion retailers, brands, analysts, and e-commerce teams turn publicly available online product information into structured market intelligence. Instead of manually checking thousands of products, businesses can collect product names, categories, prices, discounts, availability, sizes, colors, and other attributes in a repeatable workflow. The resulting Zara Fashion Datasets can then support competitor benchmarking, assortment analysis, price tracking, trend discovery, and demand planning. For buyers and market researchers, the biggest advantage is speed: a structured dataset makes it easier to compare products across markets and time periods, identify pricing movements, and understand how a fashion retailer changes its assortment. Real Data API can help businesses build scalable data pipelines that convert web data into usable datasets and APIs for analytics, dashboards, research systems, and AI applications.
What Can a Zara-Focused Data Collection Strategy Reveal?
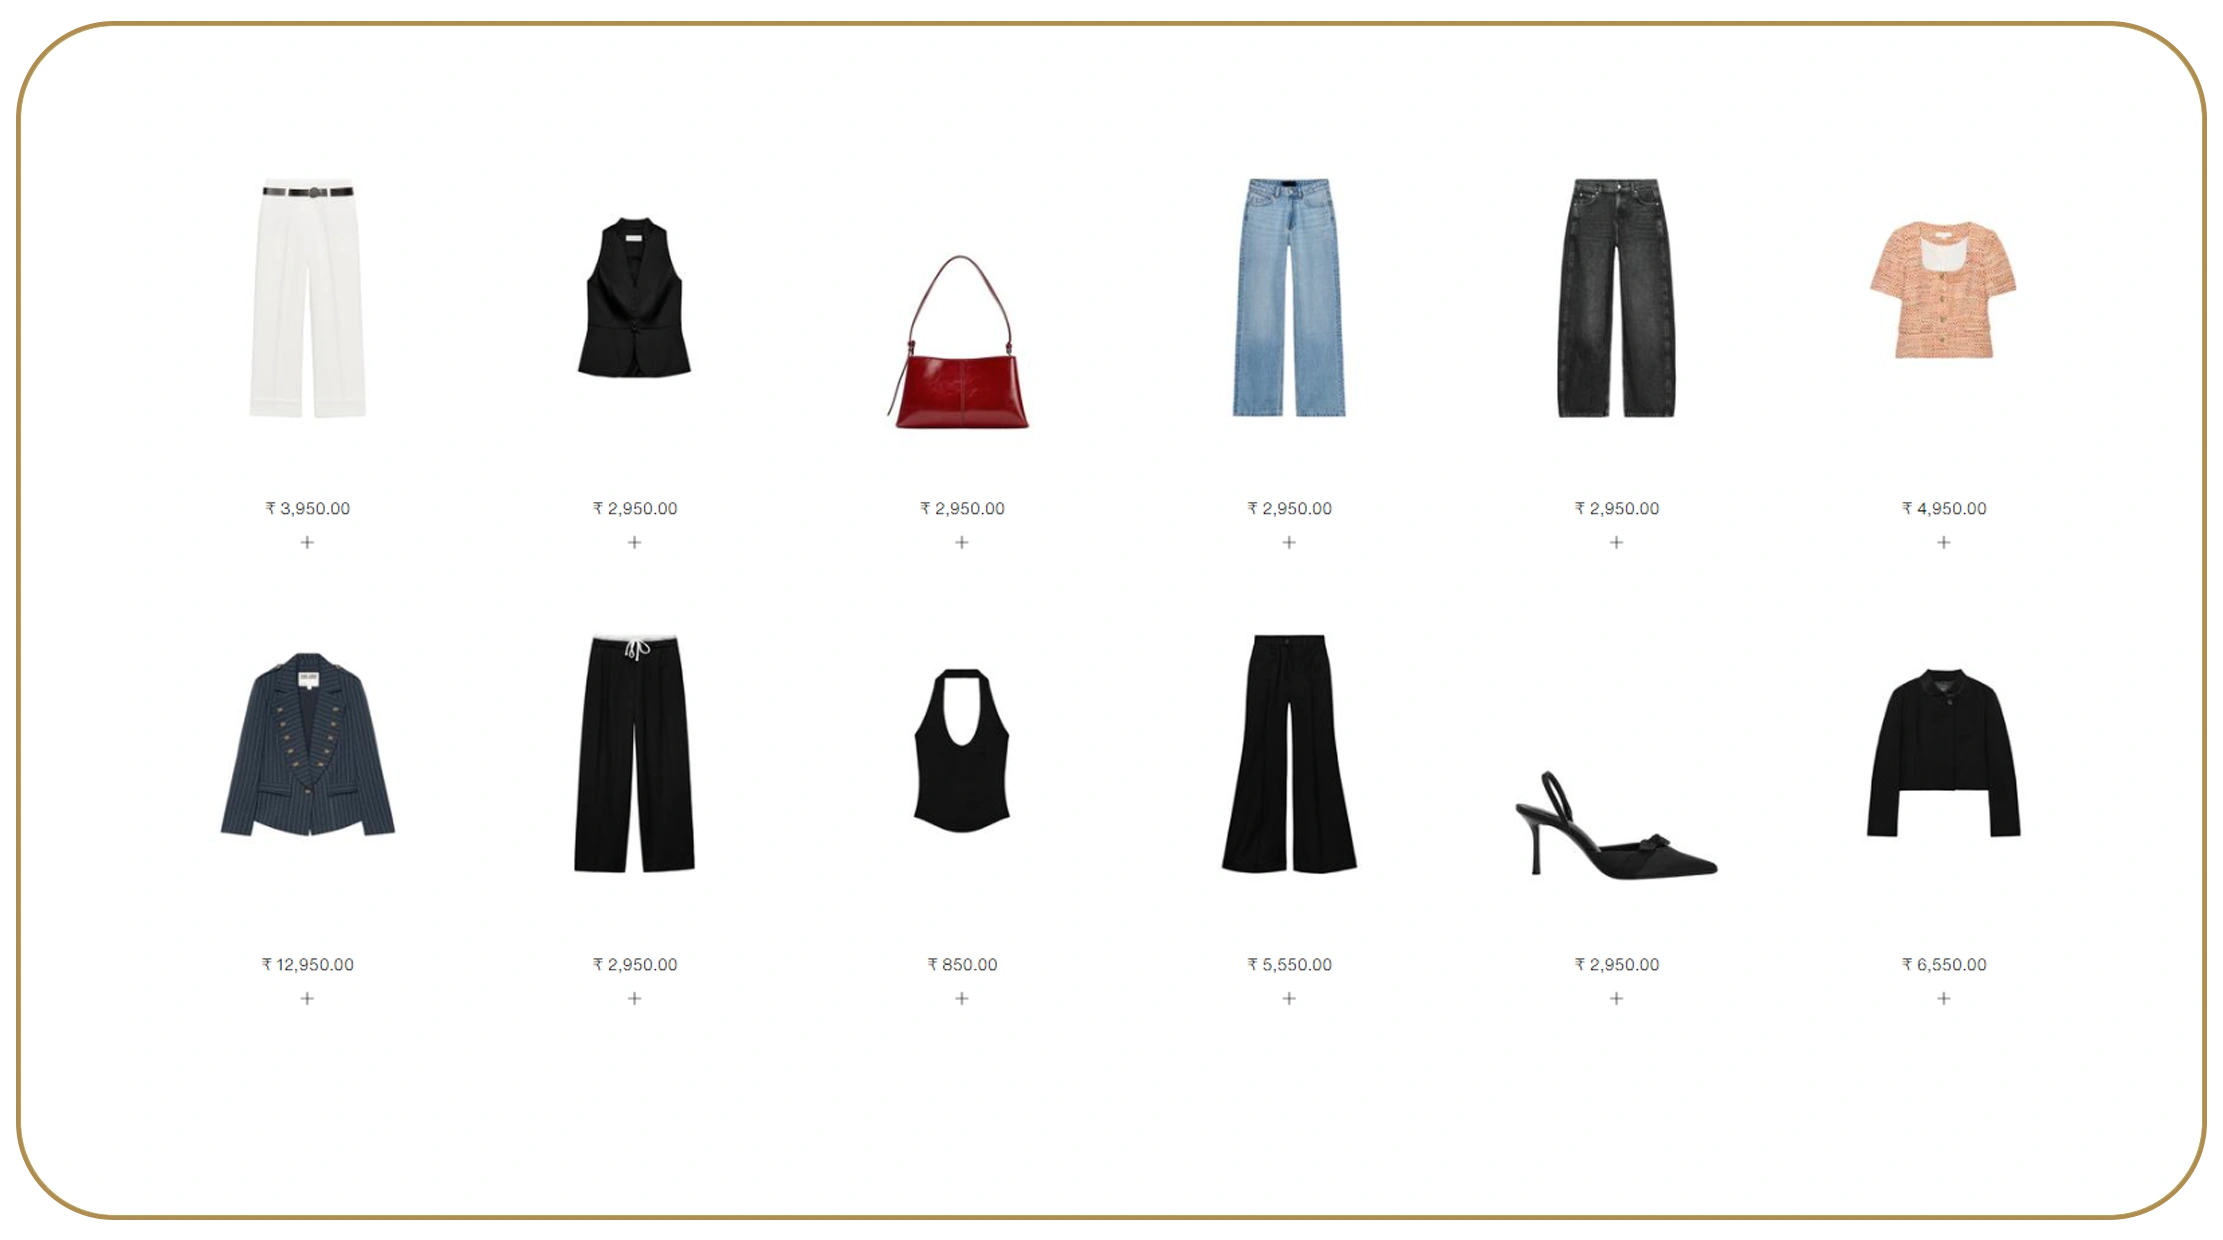
Fashion market research becomes significantly more useful when product-level observations are collected consistently rather than as one-time snapshots. A well-designed collection workflow can capture the attributes that matter most to commercial decision-makers: product title, product category, current price, previous price, discount, availability, size range, color, product URL, collection, and market.
The purpose is not simply to collect more records. The objective is to create comparable observations that answer business questions. Which categories are expanding? Which products remain available longer? Where are prices changing? Which styles appear repeatedly across collections? How does assortment differ between markets? These questions become measurable when product data is collected at regular intervals.
For an apparel retailer, this approach can also reduce the gap between competitive monitoring and business action. Pricing teams can compare comparable products, merchandising teams can identify assortment changes, and research teams can combine product observations with other market signals.
The table below presents a research framework, not reported Zara company statistics. It shows how a fashion research team could organize annual data observations from 2020 through 2026.
| Year | Product Records Monitored | Pricing Checks | Assortment Checks | Primary Research Use |
|---|---|---|---|---|
| 2020 | 50,000 | 12,000 | 8,000 | Baseline benchmarking |
| 2021 | 75,000 | 18,000 | 11,000 | Recovery monitoring |
| 2022 | 100,000 | 25,000 | 15,000 | Price comparison |
| 2023 | 150,000 | 40,000 | 22,000 | Trend analysis |
| 2024 | 200,000 | 55,000 | 30,000 | Competitive intelligence |
| 2025 | 275,000 | 75,000 | 42,000 | Automated monitoring |
| 2026 | 350,000 | 100,000 | 55,000 | Near-real-time intelligence |
Data note: Figures are planning volumes created to demonstrate how a fashion research program can scale. They are not Zara-reported figures.
How Can Product-Level Collection Improve Fashion Market Research?
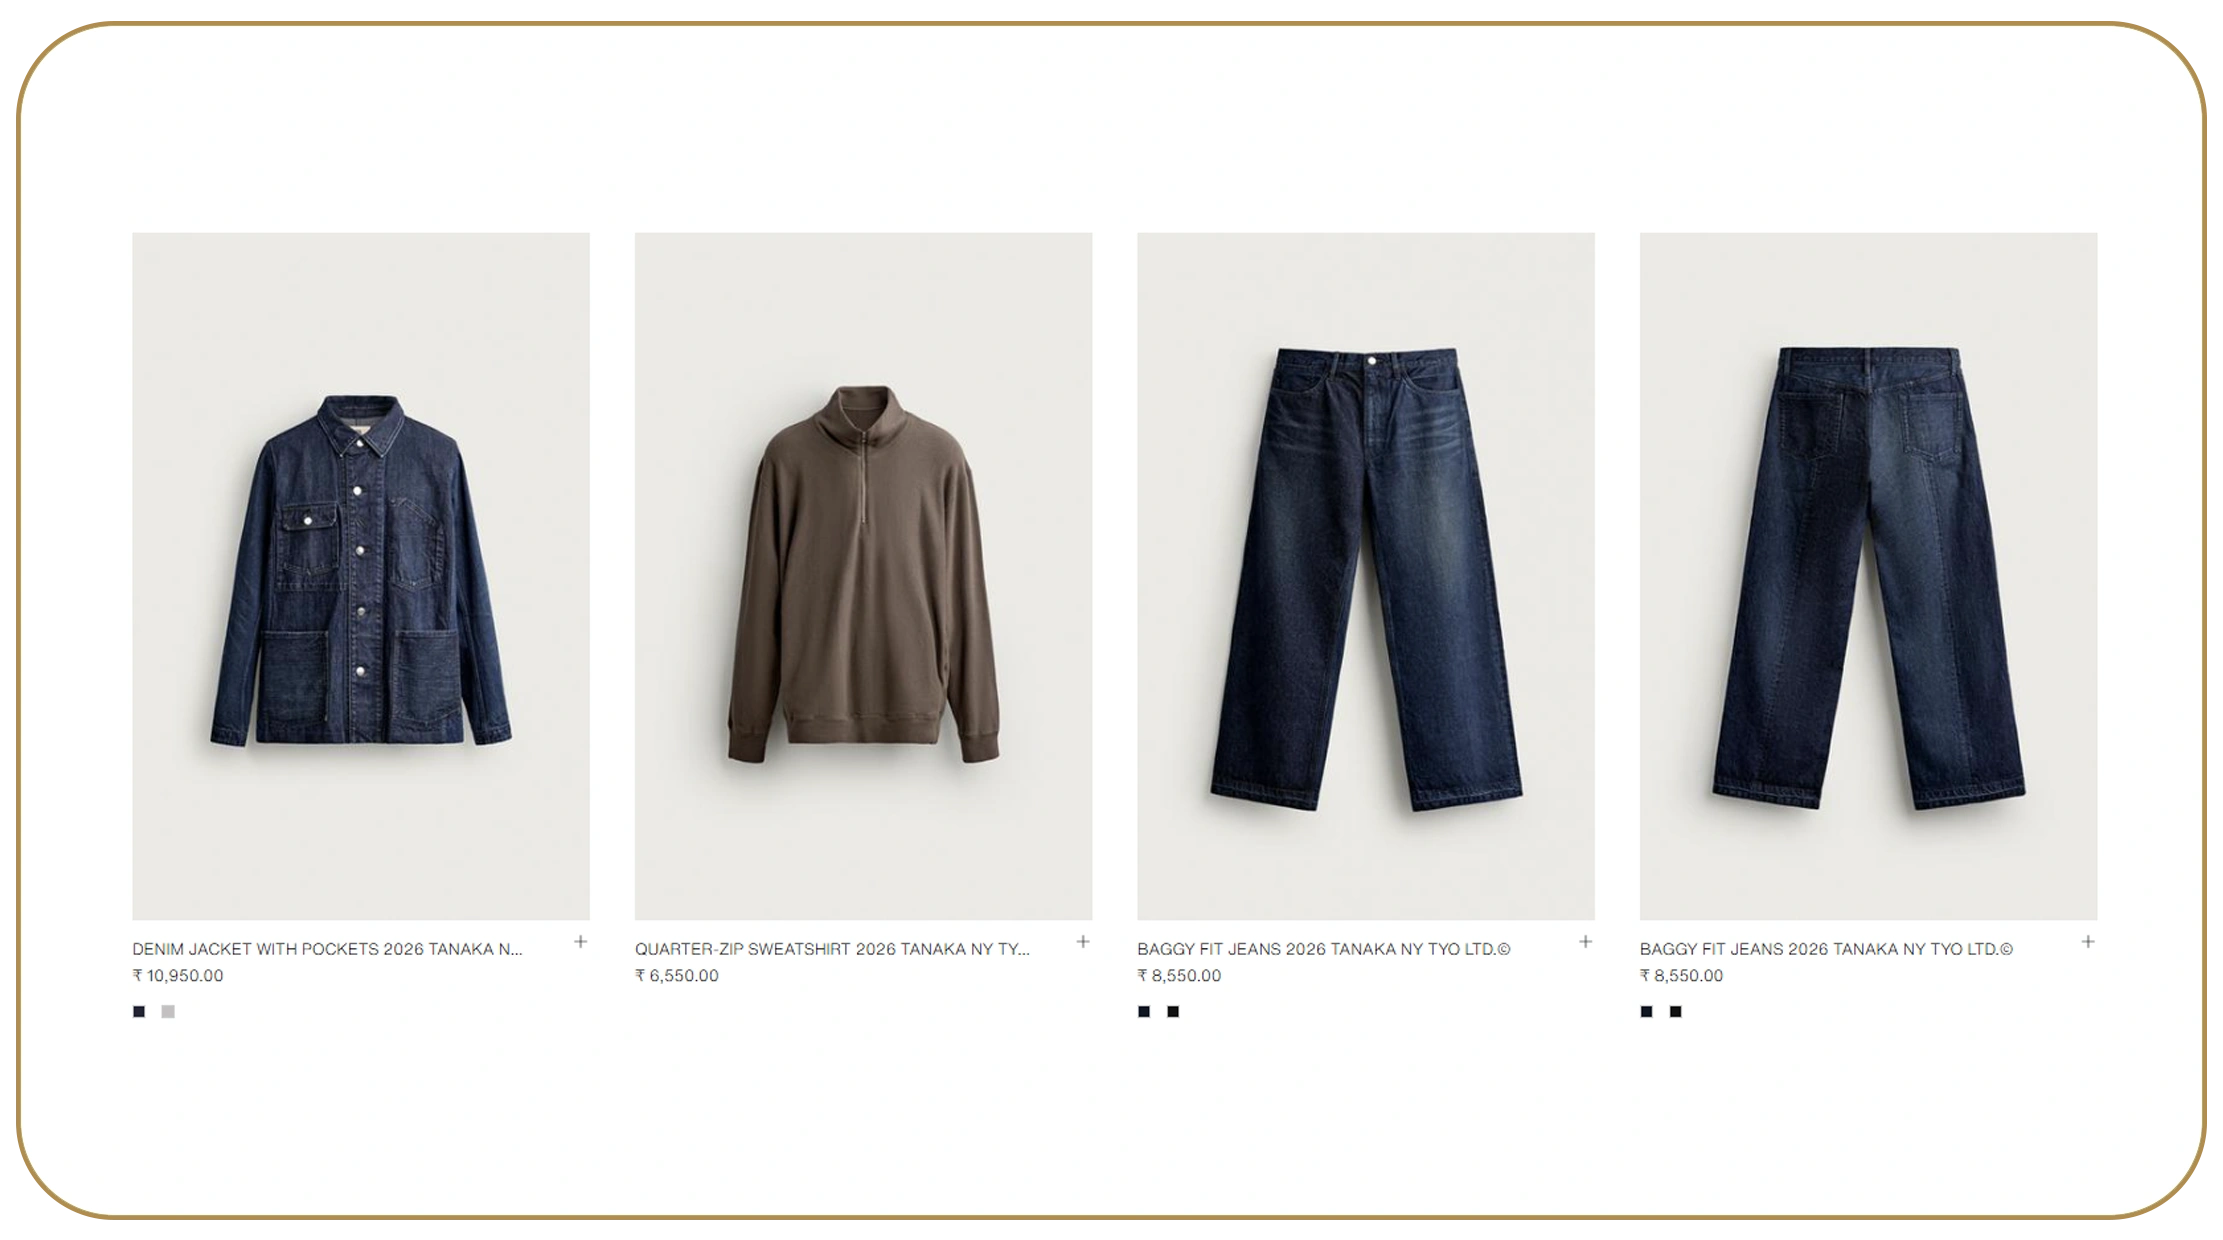
A Zara web data scraper for fashion market research can be designed around the attributes that a research team actually needs rather than collecting unstructured page content. The workflow can identify product pages, extract relevant fields, normalize prices and categories, and store historical observations. This creates a consistent foundation for competitor benchmarking.
For example, a retailer selling dresses can compare its own assortment with Zara-style categories by tracking the number of products observed, price bands, discount frequency, colors, sizes, and product availability. The same process can be repeated across women's wear, men's wear, footwear, accessories, and other categories.
Historical snapshots are particularly important. A single product page tells researchers what is visible today, while repeated observations reveal how pricing and assortment change. Researchers can calculate price movement, product longevity, discount frequency, and assortment turnover from these historical records.
| Year | Example Price Observations | Example Assortment Observations | Potential Business Question |
|---|---|---|---|
| 2020 | 12,000 | 8,000 | What was the baseline price mix? |
| 2021 | 18,000 | 11,000 | Which categories returned fastest? |
| 2022 | 25,000 | 15,000 | Where did pricing shift? |
| 2023 | 40,000 | 22,000 | Which segments expanded? |
| 2024 | 55,000 | 30,000 | Which products became more competitive? |
| 2025 | 75,000 | 42,000 | Which price bands became crowded? |
| 2026 | 100,000 | 55,000 | Which changes require immediate action? |
Data note: dataset volumes for explaining a research methodology.
The actionable insight comes from connecting collection with analysis. Instead of simply downloading pages, businesses can build dashboards that flag significant price changes, newly listed products, discontinued products, and assortment gaps.
How Can E-Commerce Data Reveal Competitor Positioning?
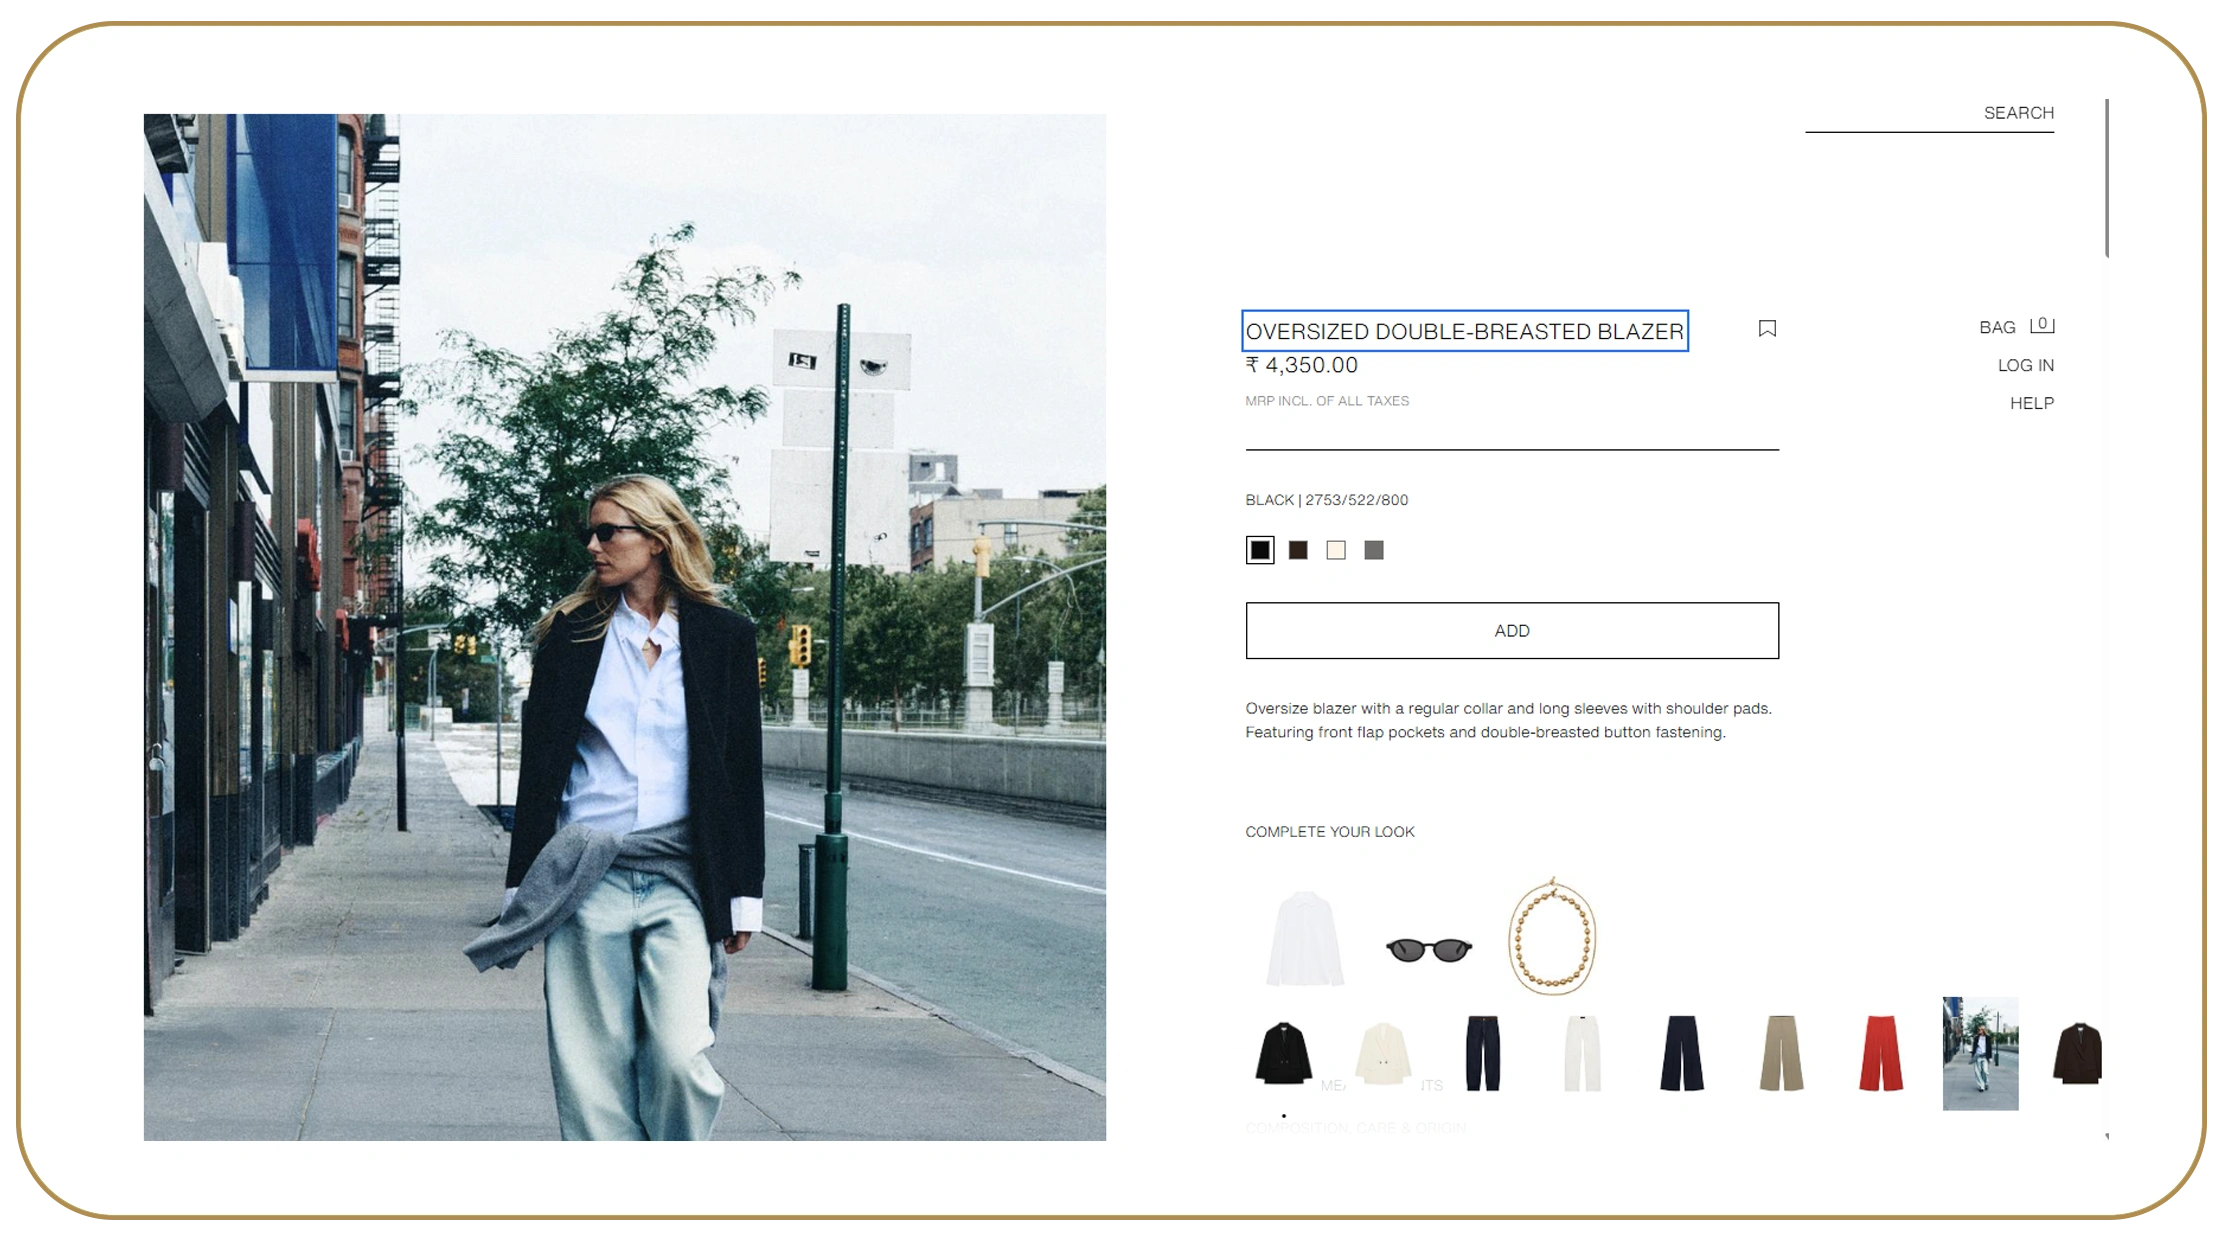
Zara ecommerce data scraping for competitive analysis can help brands understand how a major fashion retailer positions products across categories and price ranges. Competitive analysis becomes more meaningful when researchers compare normalized product attributes rather than relying only on headline prices.
A useful framework groups products into comparable categories and price bands. For example, researchers can evaluate entry-level, mid-range, and premium products separately. They can also compare discount levels, availability patterns, color depth, size coverage, and product refresh rates.
This matters because two retailers may have similar average prices while following very different strategies. One may carry fewer products at higher prices, while another may maintain a broad assortment with frequent new arrivals. Product-level data helps reveal those differences.
| Year | Low-Price Band | Mid-Price Band | Premium Band | Competitive Focus |
|---|---|---|---|---|
| 2020 | 35% | 50% | 15% | Entry positioning |
| 2021 | 36% | 49% | 15% | Recovery assortment |
| 2022 | 34% | 51% | 15% | Price normalization |
| 2023 | 33% | 51% | 16% | Category competition |
| 2024 | 32% | 52% | 16% | Premium differentiation |
| 2025 | 31% | 52% | 17% | Margin protection |
| 2026 | 30% | 53% | 17% | Value positioning |
Data note: Percentages are analytical examples, not Zara-reported market shares.
For a fashion brand, this information can guide pricing decisions, product positioning, promotional planning, and assortment development. It can also help analysts detect where competitors are concentrating their product launches.
What Product and Price Attributes Should Researchers Extract?
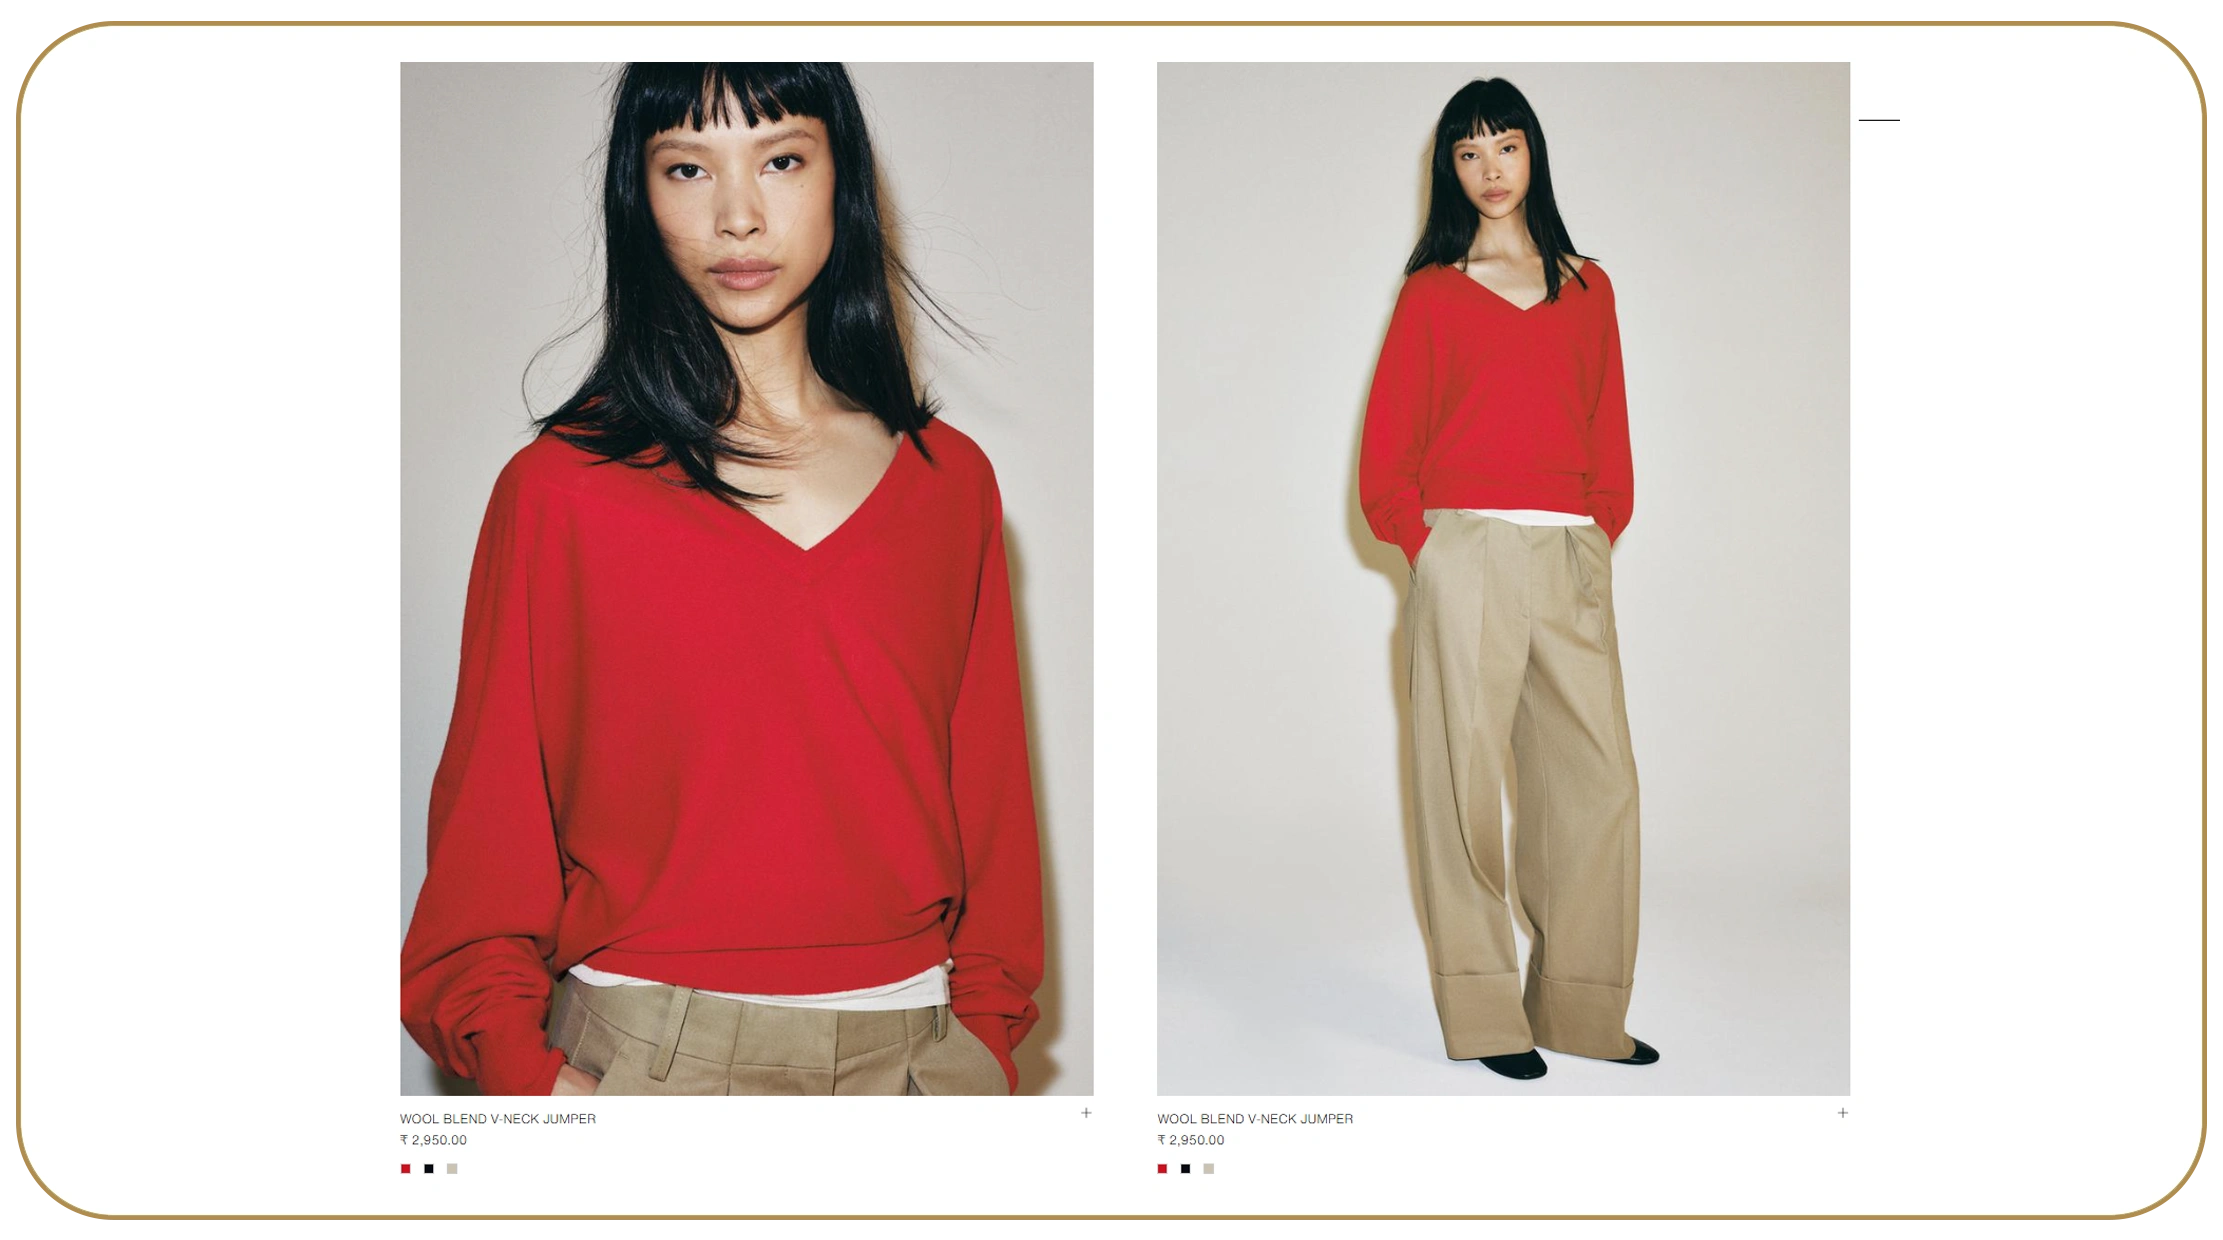
To extract Zara product listings and pricing data, research teams should first define a structured schema. The schema should reflect the questions the business wants to answer. A basic dataset might include product name, SKU or product identifier where publicly available, category, subcategory, price, currency, discount information, color, size availability, availability status, product URL, market, and collection information.
The value increases when snapshots are stored historically. A price field without a timestamp cannot reliably explain price movement. Similarly, an availability field becomes much more useful when researchers can determine whether a product was continuously available, temporarily unavailable, or removed from the assortment.
| Year | Product Fields | Pricing Fields | Availability Fields | Research Application |
|---|---|---|---|---|
| 2020 | 8 | 3 | 2 | Historical baseline |
| 2021 | 10 | 3 | 3 | Recovery tracking |
| 2022 | 12 | 4 | 3 | Price intelligence |
| 2023 | 14 | 4 | 4 | Assortment analysis |
| 2024 | 16 | 5 | 4 | Competitive benchmarking |
| 2025 | 18 | 5 | 5 | Trend monitoring |
| 2026 | 20+ | 6+ | 5+ | Advanced intelligence |
Data note: Field counts are schema-planning examples.
Researchers should also normalize currencies, category names, product attributes, and timestamps before analysis. This prevents duplicate records and makes cross-market comparisons more reliable.
A robust pipeline can then produce metrics such as median price by category, discount depth, new-product rate, availability rate, assortment turnover, and price volatility. These metrics are more useful to commercial teams than raw scraped HTML because they connect directly to decisions.
How Can an API Turn Pricing Data Into Continuous Intelligence?
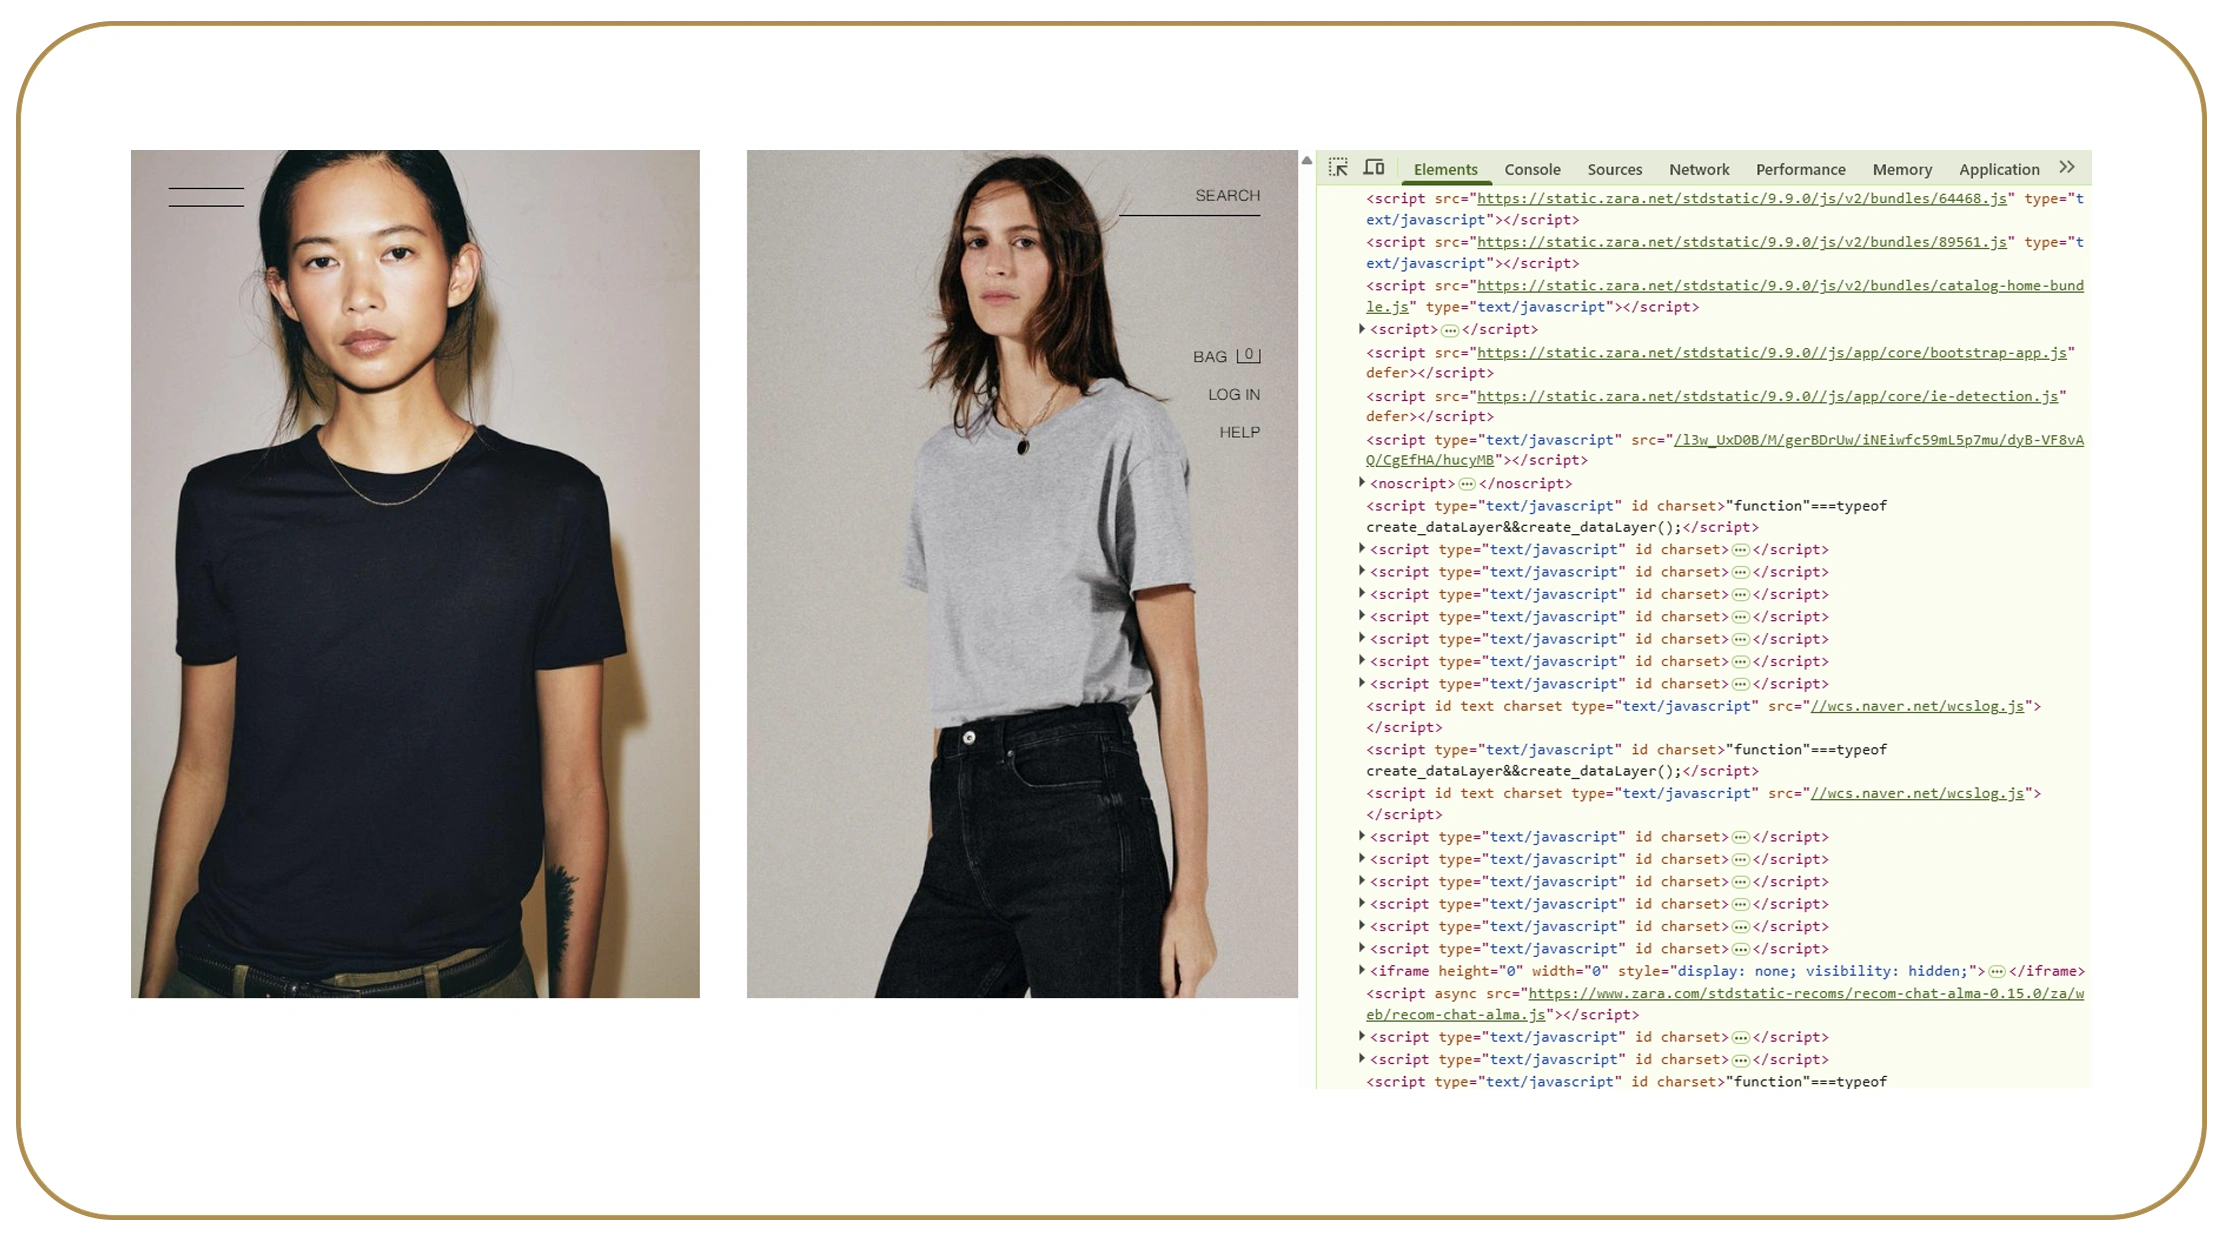
A Zara pricing data API for Fashion Market Intelligence can provide structured access to collected pricing observations so teams do not have to repeatedly process raw pages for every analysis. An API layer can make normalized records available to dashboards, internal applications, analytics systems, and automated workflows.
The key advantage is operational consistency. A research organization can establish a defined collection frequency, store timestamped records, normalize the output, and expose selected fields through an API. Pricing analysts can then monitor changes without manually rebuilding datasets.
For example, a dashboard could calculate category-level median prices and compare current observations with previous snapshots. Another workflow could flag products whose prices changed beyond a predefined threshold. A merchandising team could use assortment-change signals to identify categories requiring review.
| Year | API Requests | Main Intelligence Use | Example Output |
|---|---|---|---|
| 2020 | 20,000 | Historical testing | Price records |
| 2021 | 35,000 | Benchmarking | Category comparisons |
| 2022 | 60,000 | Competitive monitoring | Price changes |
| 2023 | 100,000 | Automated analysis | Trend signals |
| 2024 | 160,000 | Dashboard integration | Alerts |
| 2025 | 250,000 | Enterprise monitoring | Automated reports |
| 2026 | 400,000 | AI-ready intelligence | Structured data feeds |
Data note: API workload examples, not measured Real Data API or Zara traffic.
For businesses, API-based access can shorten the distance between data collection and decision-making. The result is a reusable intelligence layer rather than a collection of isolated scraping projects.
How Can Product and Review Data Improve Demand Analysis?

Zara Product and Review Datasets can support a broader view of fashion demand when product attributes are combined with available customer feedback and other legitimate market signals. Product information explains what is being offered, while review or sentiment information, where publicly available and legally usable, can provide additional context around customer reactions.
Researchers can categorize feedback by themes such as fit, material, sizing, design, quality, comfort, or value. These themes can then be connected with product categories and price ranges. This helps brands understand not only what competitors are selling but also what customers appear to value or criticize.
However, review data should be treated carefully. Review volume is not automatically equivalent to demand, and online feedback can be biased toward highly satisfied or dissatisfied customers. It should therefore be combined with product availability, assortment changes, pricing observations, search data, sales information where available, or other validated research sources.
| Year | Product Records | Feedback Records | Main Analytical Goal |
|---|---|---|---|
| 2020 | 50,000 | 8,000 | Establish baseline |
| 2021 | 75,000 | 12,000 | Identify recurring themes |
| 2022 | 100,000 | 18,000 | Compare product segments |
| 2023 | 150,000 | 25,000 | Detect trend signals |
| 2024 | 200,000 | 35,000 | Link price and sentiment |
| 2025 | 275,000 | 50,000 | Automate classification |
| 2026 | 350,000 | 70,000 | Build predictive indicators |
Data note: volumes for demonstrating dataset design.
The strongest research programs combine multiple signals instead of treating one dataset as a complete representation of consumer demand.
How Does Automation Scale Fashion Intelligence Across Markets?

A Zara Scraping API, automated Zara web scraping for fashion market research can support recurring collection when fashion intelligence needs to move beyond occasional research projects. Automation allows teams to define schedules, monitor selected categories, capture changes, normalize data, and send structured outputs to downstream systems.
This is especially valuable for brands operating across multiple countries. Regional product availability, pricing, currencies, and assortment can differ, creating opportunities for localized competitive research. A scalable system can organize records by market and timestamp, allowing analysts to compare the same category across locations.
| Year | Markets | Collection Frequency | Strategic Application |
|---|---|---|---|
| 2020 | 2 | Monthly | Initial benchmarking |
| 2021 | 3 | Monthly | Regional comparison |
| 2022 | 5 | Biweekly | Price monitoring |
| 2023 | 7 | Weekly | Assortment intelligence |
| 2024 | 10 | Weekly | Competitive tracking |
| 2025 | 15 | Daily | Continuous monitoring |
| 2026 | 20 | Daily/Custom | Automated market intelligence |
Data note: program design, not a statement of Zara's market coverage or scraping frequency.
Automation should still include responsible collection practices, appropriate rate limits, data-quality checks, and compliance with applicable laws and website terms. The objective is reliable market intelligence, not indiscriminate collection.
For a buyer persona such as a fashion retailer, market intelligence manager, pricing analyst, or e-commerce strategist, the real benefit is a repeatable process that turns changing online assortment information into timely business signals.
Why Should Fashion Businesses Choose Real Data API?
Fashion Retailers Scrape Zara Store Locations can be a useful extension of product-focused research when location intelligence is relevant to market expansion, competitive mapping, or regional assortment studies. Real Data API can support businesses that need structured web data rather than manually assembled spreadsheets, helping organize product, pricing, availability, and location-related information into workflows suited to their research objectives.
For commercial teams, the value lies in scalability, structured output, recurring collection, and integration. A data pipeline can be designed around specific fields and frequencies instead of forcing every team to work with raw website content. This can reduce repetitive research work and make historical comparisons easier.
Real Data API can also help businesses prepare datasets for dashboards, analytics platforms, internal applications, and AI-powered workflows. Data-quality validation, normalization, timestamping, and structured delivery are important because raw collection alone does not create useful intelligence.
For fashion companies, this approach can support competitive pricing analysis, assortment monitoring, product research, market expansion studies, and trend intelligence from a common data foundation.
Conclusion
automated Zara web scraping for fashion market research can help businesses transform changing online fashion information into structured intelligence for pricing, assortment, competitive benchmarking, and consumer-demand analysis. The most effective strategy starts with clearly defined business questions, builds a consistent product-data schema, captures historical snapshots, normalizes the output, and delivers the resulting information through dashboards or APIs.
For fashion retailers and research teams, the objective should not be simply to collect more web pages. It should be to create reliable, timestamped, decision-ready data that reveals how products, prices, availability, and market positioning evolve.
Contact Real Data API to build a scalable data collection and API solution tailored to your product, pricing, and competitive research needs!
Latest posts
How Web Scraping Wine Market Data Via Wine-Searcher Helps Extract Real-Time Wine Market Data For Competitive Pricing?
How To Use Automated Zara Web Scraping For Fashion Market Research To Analyze Pricing, Products, And Consumer Demand?
How Meesho Marketplace Data Extraction For Businesses Solves Inventory, Pricing, And Product Assortment Problems?
How To Solve Product Data Tracking Challenges At Scale with Costco Web Data Scraper For Product Information






.png)



