TL;DR
- Dianping API can support structured restaurant intelligence by organizing business profiles, ratings, reviews, categories, and location attributes into analysis-ready datasets for competitive research.
- Dianping Scraper workflows can help businesses collect recurring market information at scale, enabling restaurant benchmarking, location analysis, customer sentiment monitoring, and market-trend discovery without relying on fragmented manual research.
Introduction
Restaurant market intelligence depends on timely information about businesses, locations, ratings, customer feedback, categories, and changing consumer behavior. For brands operating across multiple cities, manually collecting this information can become slow, inconsistent, and difficult to maintain. A structured Dianping API workflow can help transform restaurant marketplace information into organized datasets that analysts can use for competitive research, location planning, pricing studies, and customer-experience analysis.
A complementary Dianping Scraper approach can support recurring collection across selected cities, categories, and restaurant profiles. Instead of reviewing individual listings manually, businesses can build standardized records containing restaurant names, addresses, categories, ratings, review counts, available attributes, and other publicly accessible information.
The market opportunity is substantial. China's catering-industry revenue reached RMB 5.7982 trillion in 2025, up 3.2% year over year, while 2024 catering revenue reached RMB 5.618 trillion, up 5.3%. (National Bureau of Statistics of China)
For restaurant groups, food-tech platforms, investors, delivery businesses, travel companies, and market researchers, the challenge is no longer simply finding restaurant information. The bigger challenge is converting high-volume local-business information into consistent, comparable, and actionable intelligence.
How Can Businesses Build a Consistent Restaurant Data Foundation?
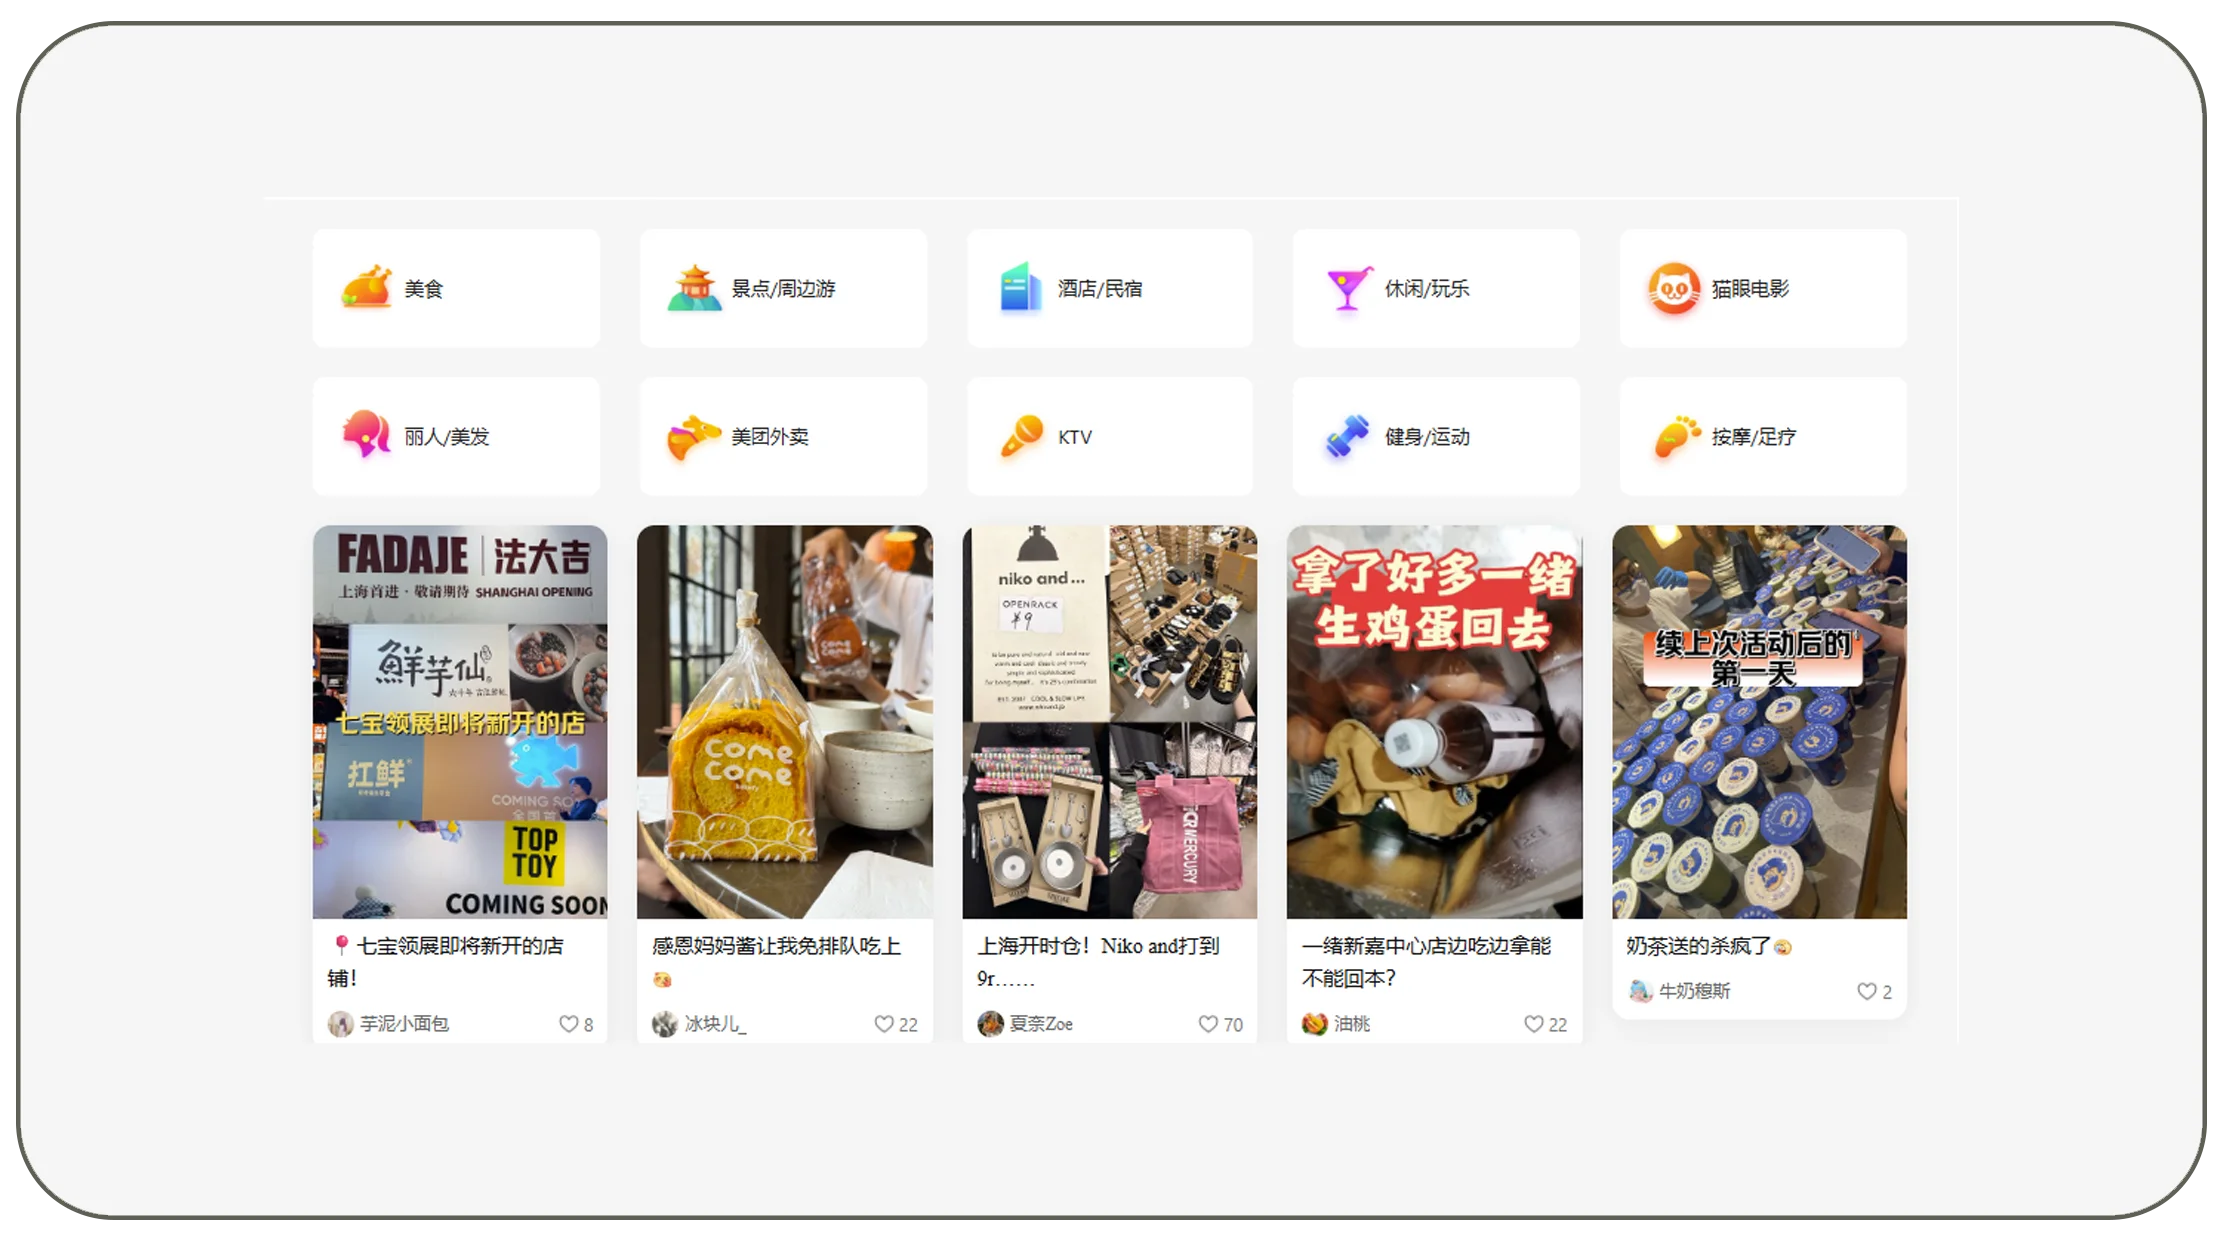
Businesses often struggle with fragmented restaurant information because listings can contain different names, categories, locations, ratings, review volumes, and descriptive attributes. Dianping restaurant data web scraping can create a standardized collection process in which relevant fields are captured, normalized, validated, and organized for analysis.
A useful dataset can include restaurant name, category, cuisine type, address, district, location coordinates where publicly available, rating, review count, business status, operating information, price indicators where available, and listing URL. Once standardized, these fields can support city-level benchmarking and competitor discovery.
| Intelligence Field | Business Use |
|---|---|
| Restaurant name | Entity identification |
| Cuisine/category | Market segmentation |
| Rating | Reputation benchmarking |
| Review count | Customer engagement indicator |
| Address | Location analysis |
| District | Geographic comparison |
| Price information | Pricing research |
| Business attributes | Service comparison |
| Listing URL | Record validation |
The value increases when businesses combine these fields instead of analyzing ratings alone. A restaurant with a high rating and a small review base may represent a different market position from a similarly rated restaurant with thousands of reviews. Combining rating, volume, location, category, and price indicators produces a more meaningful competitive profile.
2020–2026 Market Development
China's catering market experienced significant disruption during the early 2020s before returning to expansion. National catering revenue was about RMB 4.0 trillion in 2020, while 2022 revenue fell to RMB 4.3941 trillion amid pandemic-related pressure. In 2023, catering revenue rebounded strongly to RMB 5.289 trillion, an annual increase of 20.4%. It reached RMB 5.618 trillion in 2024 and RMB 5.7982 trillion in 2025. (National Bureau of Statistics of China)
From 2020 through 2026, this progression demonstrates why restaurant intelligence increasingly needs longitudinal data rather than isolated snapshots. Businesses can compare changes in ratings, review activity, restaurant density, category presence, and geographic expansion over time. The 2025 market also shows that restaurant intelligence sits within a broader service-consumption environment: China's service retail sales increased 5.5% in 2025. (National Bureau of Statistics of China)
For data teams, the practical lesson is clear: historical restaurant datasets can reveal changes that individual listing checks cannot. A recurring collection architecture therefore becomes useful for tracking market movement, identifying new competitors, and maintaining reliable business intelligence.
How Can Location Intelligence Improve Restaurant Expansion Decisions?
Restaurant performance is closely connected with geography. Two businesses offering similar cuisine can experience very different demand because of neighborhood characteristics, competitor density, commercial activity, tourism, accessibility, and local consumer behavior. Dianping location data collection services can help businesses organize geographic restaurant information into datasets suitable for territory analysis.
Location intelligence can be structured around city, district, neighborhood, address, coordinates where publicly available, cuisine, rating, review volume, and competitor density. This enables analysts to create geographic comparisons rather than relying only on individual restaurant profiles.
| Location Metric | Potential Application |
|---|---|
| Restaurant count | Market density analysis |
| Cuisine concentration | Category opportunity research |
| Average rating | Area-level reputation comparison |
| Review volume | Demand/activity proxy |
| Restaurant category | Local segmentation |
| Geographic coordinates | Mapping and proximity analysis |
| Price indicators | Area-level positioning |
| Competitor density | Expansion research |
For example, a restaurant group evaluating several neighborhoods could compare the number of competing restaurants, average ratings, review volumes, cuisine distribution, and price positioning. This does not determine whether a location will succeed, but it gives decision-makers a more structured evidence base.
2020–2026 Market Development
The 2020–2026 period changed how businesses evaluate physical locations. During the pandemic years, restaurants faced severe operating restrictions and demand volatility. By 2023, China's catering revenue had recovered to RMB 5.289 trillion, followed by RMB 5.618 trillion in 2024 and RMB 5.7982 trillion in 2025. (National Bureau of Statistics of China)
The recovery also coincided with increasing integration between physical businesses and digital discovery. Restaurant listings, consumer reviews, map-based discovery, delivery services, and local recommendations create digital signals that can complement conventional demographic or real-estate research.
By 2026, location intelligence can therefore be treated as a multidimensional dataset rather than a simple address list. Analysts can examine how restaurant categories cluster geographically, where highly reviewed businesses are concentrated, and how competitive density varies between districts.
The actionable approach is to create recurring geographic snapshots. Comparing the same locations over time can reveal newly added restaurants, disappearing businesses, changing ratings, increasing review activity, and shifts in category concentration. These changes can help expansion teams identify areas requiring deeper investigation before making commercial decisions.
How Can Real-Time Signals Improve Rating and Reputation Monitoring?
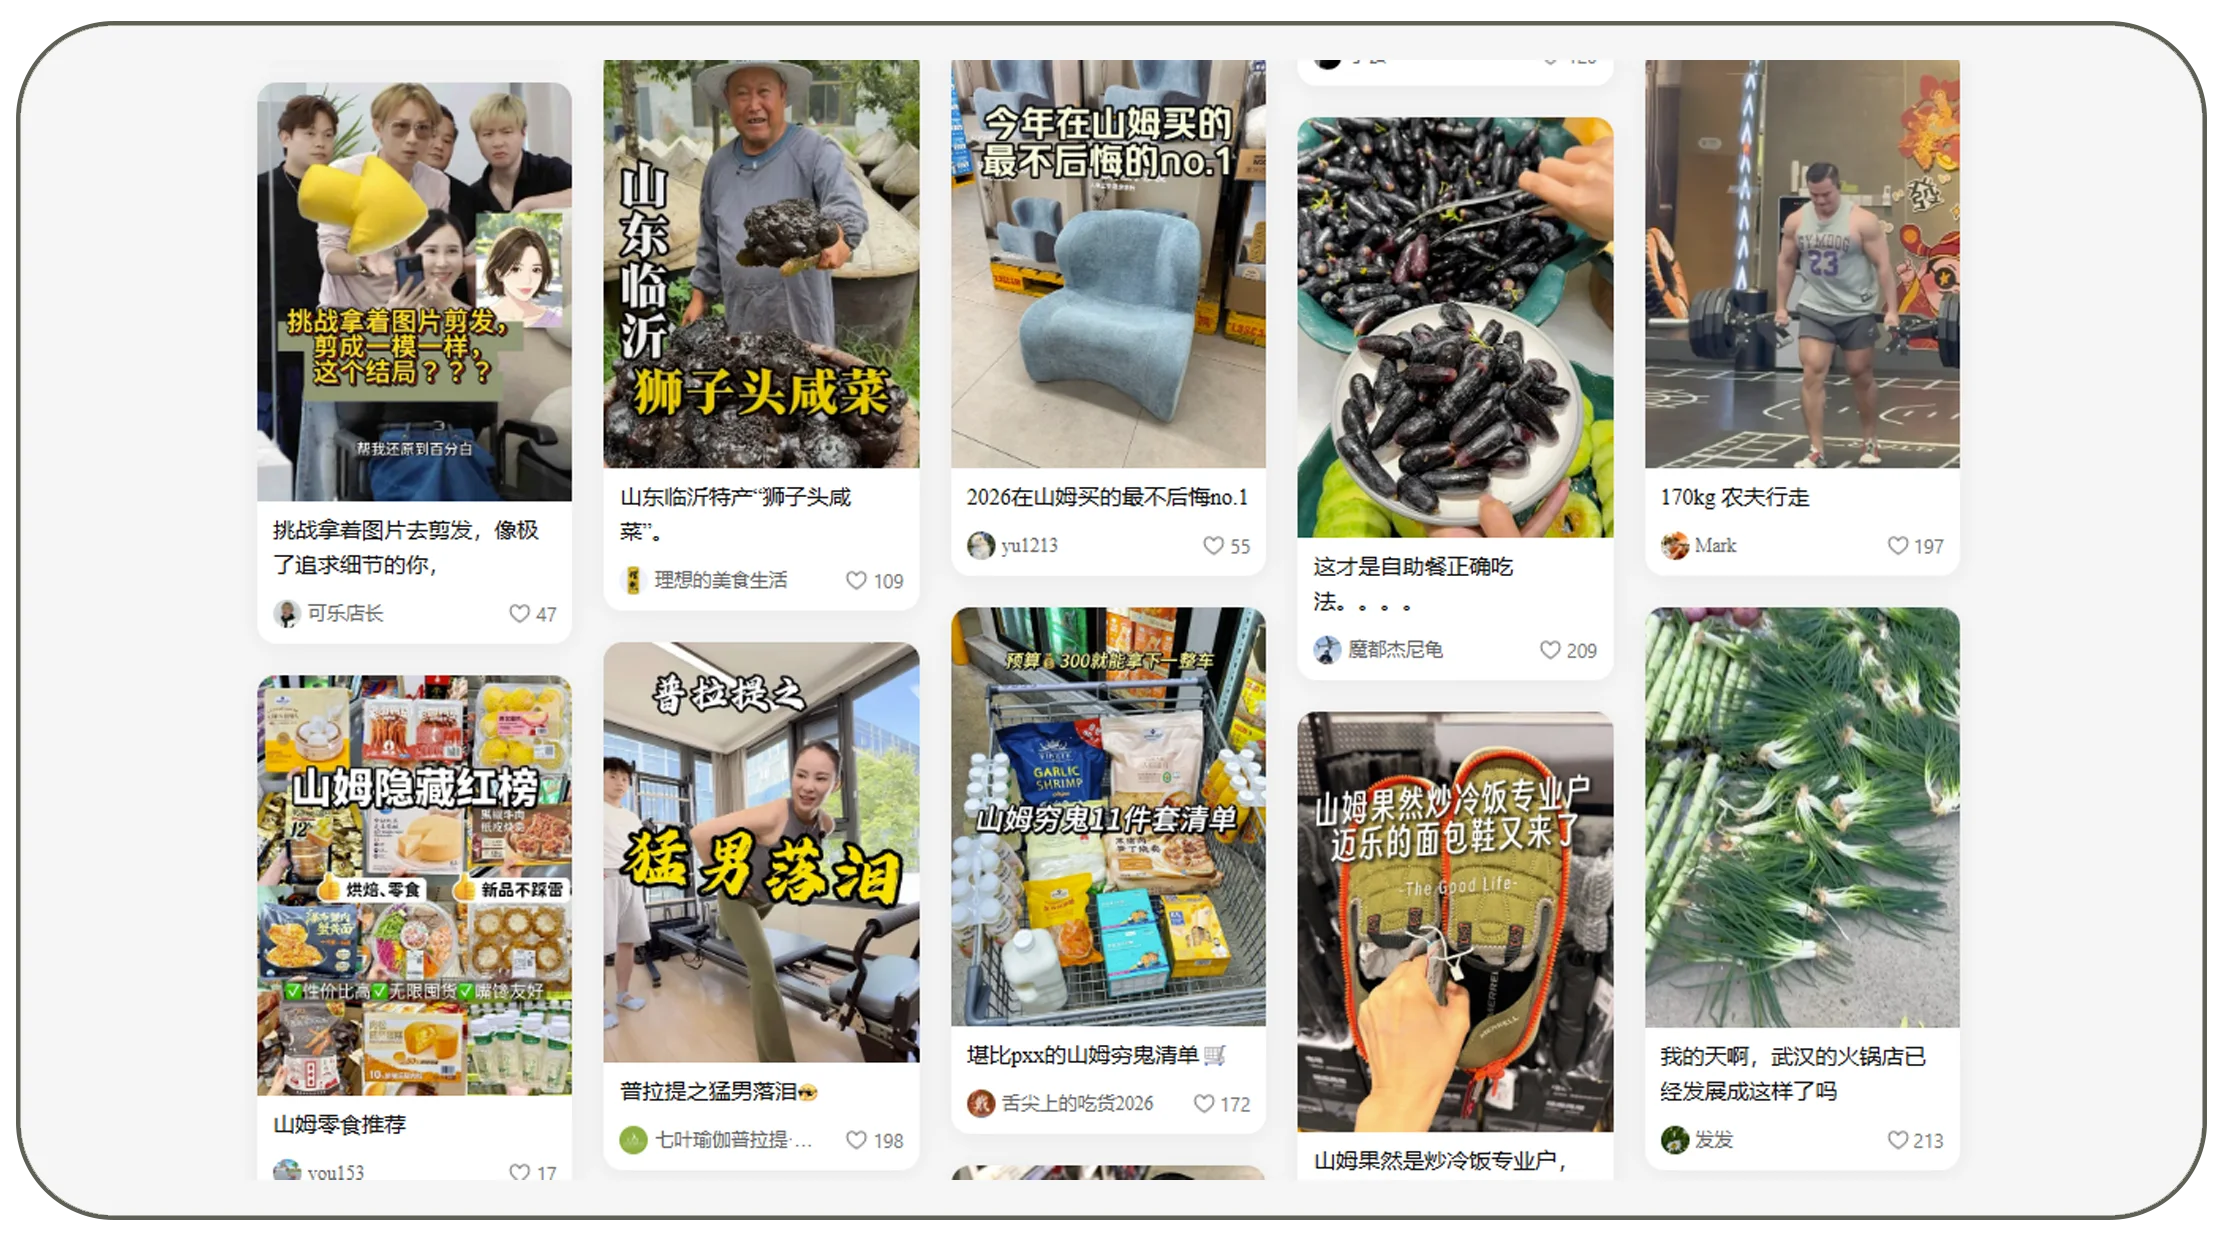
Ratings and reviews can change continuously, making periodic manual research inefficient for organizations monitoring hundreds or thousands of businesses. A real-time Dianping rating data API workflow can provide structured rating information for analytical systems, subject to the applicable access method, permissions, and platform terms.
A useful monitoring model should not treat the rating as the only metric. Rating changes, review-volume changes, category context, and time-series movement can provide a broader picture.
| Signal | What It Can Indicate |
|---|---|
| Average rating | Overall customer perception |
| Review count | Review activity |
| Rating movement | Reputation change |
| New review volume | Recent customer activity |
| Category comparison | Relative positioning |
| Location comparison | Geographic reputation differences |
| Review themes | Customer experience patterns |
The distinction between current rating and historical movement is especially important. A restaurant maintaining a stable rating while rapidly accumulating reviews may have a different trajectory from one whose rating declines as review volume increases.
2020–2026 Market Development
Online reputation became increasingly important as restaurant discovery and service consumption moved further into digital environments. By 2025, Dianping reported receiving nearly 450 million user reviews across almost 9.029 million businesses and more than 400 business categories. The platform also reported processing 11.61 million AI-generated reviews in 2025 as part of its review-governance efforts. (Meituan)
These figures demonstrate both the scale and complexity of review intelligence. Large review ecosystems create valuable signals but also create data-quality challenges. Businesses need consistent collection, deduplication, timestamping, validation, and sentiment classification to turn reviews into reliable analytical inputs.
A practical 2026 monitoring system can therefore track changes rather than merely collect static ratings. Organizations can establish thresholds for significant rating movements, unusual review-volume increases, emerging complaint themes, or changes in competitive positioning.
The resulting intelligence can support brand monitoring, customer-experience research, restaurant benchmarking, and market analysis. However, review data should be interpreted carefully: ratings and review counts are indicators of digital customer feedback, not complete measures of restaurant quality or financial performance.
How Can Businesses Capture Complete Business Profiles at Scale?
Restaurant market analysis becomes difficult when business information is collected manually from multiple listings. scrape Dianping business data workflows can help create structured records across selected restaurant categories, cities, districts, and competitors.
The objective is not simply to collect names. A useful business dataset should connect identity, category, location, reputation, and other publicly accessible attributes into a consistent record.
| Business Attribute | Intelligence Application |
|---|---|
| Business name | Entity matching |
| Category | Competitive segmentation |
| Address | Geographic analysis |
| Rating | Reputation benchmarking |
| Reviews | Customer engagement analysis |
| Price level | Market positioning |
| Services | Feature comparison |
| Business status | Market monitoring |
Normalization is critical because the same restaurant may appear with variations in naming, address formatting, or category classification. Data pipelines can standardize these fields before they enter dashboards or analytical models.
2020–2026 Market Development
China's hospitality and catering ecosystem has expanded in scale and complexity during the period. The Fifth National Economic Census reported that corporate enterprises in hotels and catering services generated RMB 2.23165 trillion in business revenue in 2023, with restaurants accounting for RMB 1.06541 trillion. (National Bureau of Statistics of China)
This expansion creates a larger competitive universe for businesses to monitor. Restaurant groups may need to understand competitors by city, cuisine, pricing level, customer feedback, and service characteristics rather than simply maintaining a competitor-name list.
Between 2020 and 2026, the shift toward digital discovery also increased the usefulness of structured business profiles. Data teams can compare restaurant populations across periods, identify new entrants, detect businesses that disappear from monitored markets, and analyze category growth.
For 2026 workflows, businesses should define their collection scope before implementation. Relevant dimensions may include target cities, districts, cuisine categories, competitor groups, update frequency, and required attributes. The dataset can then be validated against predefined quality rules.
The strongest workflow connects collection with downstream analytics. Instead of storing raw records indefinitely, businesses can create standardized tables for restaurant identity, location, reputation, category, and historical changes. This makes the dataset easier to query and integrate with BI platforms, research models, and internal dashboards.
How Can an API Workflow Support Scalable Restaurant Intelligence?
A Dianping API workflow can provide an architectural layer for converting restaurant information into structured data that downstream applications can consume. Depending on the permitted access method and technical implementation, API-based workflows can support scheduled collection, standardized outputs, integration, and automated analysis.
For organizations managing large datasets, the architecture can be separated into several stages:
Discovery → Collection → Validation → Normalization → Storage → Analytics → Monitoring
| Layer | Purpose |
|---|---|
| Discovery | Identify relevant businesses and categories |
| Collection | Capture permitted data fields |
| Validation | Check completeness and consistency |
| Normalization | Standardize records |
| Storage | Maintain historical datasets |
| Analytics | Generate market insights |
| Monitoring | Track changes over time |
This architecture helps solve a common business problem: data collection and business analysis often operate separately. A scalable workflow connects the two so that new records can automatically move toward dashboards, reports, or analytical models.
2020–2026 Market Development
The broader local-services ecosystem has become increasingly data-intensive. Meituan reported that annual transaction users exceeded 800 million in 2025 and that its services covered more than 370 cities. Its 2025 annual revenue reached RMB 364.9 billion, while research and development spending reached RMB 26 billion, up 23% year over year. (Meituan Index)
These figures provide context for the scale of China's digital local-services environment. For businesses analyzing restaurant markets, the resulting data landscape can include large volumes of business profiles, consumer feedback, geographic information, and service attributes.
By 2026, API-oriented data architectures are increasingly relevant because businesses want information to flow directly into existing systems. A restaurant intelligence pipeline might feed a data warehouse, competitor-monitoring dashboard, pricing model, location analysis system, or machine-learning workflow.
The key implementation principle is consistency. The same fields should be collected and formatted across locations and reporting periods. Historical snapshots should also be retained where appropriate so analysts can identify changes instead of repeatedly rebuilding datasets.
For buyers, the most important evaluation criteria are therefore data coverage, field consistency, update frequency, scalability, validation, delivery format, and integration capability—not simply the number of records collected.
How Can Food and Restaurant Data Support Broader Market Intelligence?
Restaurant intelligence becomes more valuable when connected with adjacent food and consumer datasets. Food Data Scraping can complement restaurant-level information by providing additional context around food categories, products, pricing, menus, consumer demand, and competitive positioning.
For food-tech businesses, combining restaurant information with broader food intelligence can help answer questions such as:
- Which cuisines are expanding across selected cities?
- Which food categories have strong restaurant representation?
- How does restaurant positioning vary by geography?
- Which competitors are gaining review activity?
- Where are category gaps emerging?
- How are customer preferences changing?
| Combined Dataset | Possible Insight |
|---|---|
| Restaurant + location | Market expansion |
| Restaurant + rating | Reputation benchmarking |
| Restaurant + reviews | Sentiment analysis |
| Restaurant + category | Cuisine trends |
| Restaurant + food data | Broader food-market intelligence |
| Historical records | Market-change detection |
2020–2026 Market Development
The broader food and consumer environment has changed considerably since 2020. China's online retail sales of physical goods increased from RMB 9.759 trillion in 2020 to RMB 11.964 trillion in 2022 and RMB 13.017 trillion in 2023. In 2025, physical-goods online retail sales reached RMB 13.092 trillion. (National Bureau of Statistics of China)
Meanwhile, catering revenue increased from roughly RMB 4.0 trillion in 2020 to RMB 5.7982 trillion in 2025. (National Bureau of Statistics of China)
These trends show why restaurant intelligence increasingly intersects with wider digital commerce and food-market research. Restaurant operators, food-tech companies, investors, and consumer brands can gain additional context by examining restaurant activity alongside food categories and consumer behavior.
In 2026, the practical opportunity is to build connected datasets rather than isolated research projects. A restaurant dataset can provide the business layer, location data can provide the geographic layer, ratings and reviews can provide the customer-feedback layer, and broader food information can provide category context.
The result is a more complete market-intelligence framework that can support competitive research, expansion planning, customer-experience analysis, and strategic reporting.
Why Choose Real Data API?
Real Data API can help businesses design structured data workflows around restaurant, food, location, pricing, rating, and review intelligence. The focus should be on turning fragmented public information into organized datasets that are easier to analyze and integrate into business systems.
Businesses working with Food Datasets can benefit from structured fields, consistent formats, historical collection, validation processes, and scalable delivery. For restaurant intelligence projects, the workflow can be customized around cities, categories, competitors, attributes, and reporting requirements.
A strong data solution should address the complete lifecycle: defining the required fields, collecting permitted information, validating records, normalizing entities, maintaining historical data, and delivering outputs in a format suitable for analytics.
The broader objective is not merely collecting more data. It is creating datasets that answer specific business questions. Restaurant groups may need competitive benchmarking. Food-tech companies may need market coverage. Investors may need category and location signals. Research teams may need historical datasets for trend analysis.
With the right architecture, restaurant intelligence can move from manual research toward repeatable, measurable, and scalable data operations.
Conclusion
Restaurant market intelligence requires more than a list of restaurants. Businesses need structured information covering restaurant identity, location, categories, ratings, reviews, business attributes, and historical changes. Dianping API workflows can support this transformation by connecting data collection with normalization, validation, storage, and analytics.
The 2020–2026 market trajectory reinforces the need for scalable intelligence. China's catering revenue reached RMB 5.7982 trillion in 2025, while Dianping reported nearly 450 million user reviews across almost 9.029 million businesses during the year. (National Bureau of Statistics of China)
For businesses operating in restaurant, food-tech, travel, delivery, consumer research, and location intelligence markets, structured data can help uncover geographic patterns, monitor reputation changes, benchmark competitors, and identify emerging market signals.
Ready to turn restaurant, rating, review, and location information into actionable market intelligence? Partner with Real Data API to build a scalable, structured data solution tailored to your business requirements!
FAQs
What is Dianping API used for?
Dianping API can support structured restaurant intelligence workflows involving business profiles, ratings, reviews, locations, categories, and other permitted data fields for analysis.
What is the difference between API and scraping workflows?
A Dianping Scraper can collect permitted public information from defined pages or listings, while an API-based workflow can provide structured programmatic access where an authorized interface is available.
How can restaurant datasets be collected at scale?
Dianping restaurant data web scraping can organize restaurant information into structured records covering identity, category, location, ratings, reviews, and other accessible attributes for analysis.
Why is location information important for restaurant research?
Dianping location data collection services can help businesses compare restaurant density, category distribution, competitor presence, and geographic patterns across selected cities and districts.
How can businesses monitor ratings?
A real-time Dianping rating data API workflow can help authorized users process rating information regularly and integrate changes into dashboards, monitoring systems, or analytical pipelines. Real Data API can support the broader data workflow.
Latest posts
How Restaurant, Menu, Price, Rating, and Delivery Data Helps Businesses Track Food Delivery Markets
How Businesses Solve Restaurant Market Intelligence Challenges with Rating, Review, and Location Data
How Businesses Use Grocery, Product, Pricing, and Retail Food Data for Competitive Analysis

How Etsy API Solves Marketplace Intelligence Challenges with Product, Price, and Seller Data






.png)



