
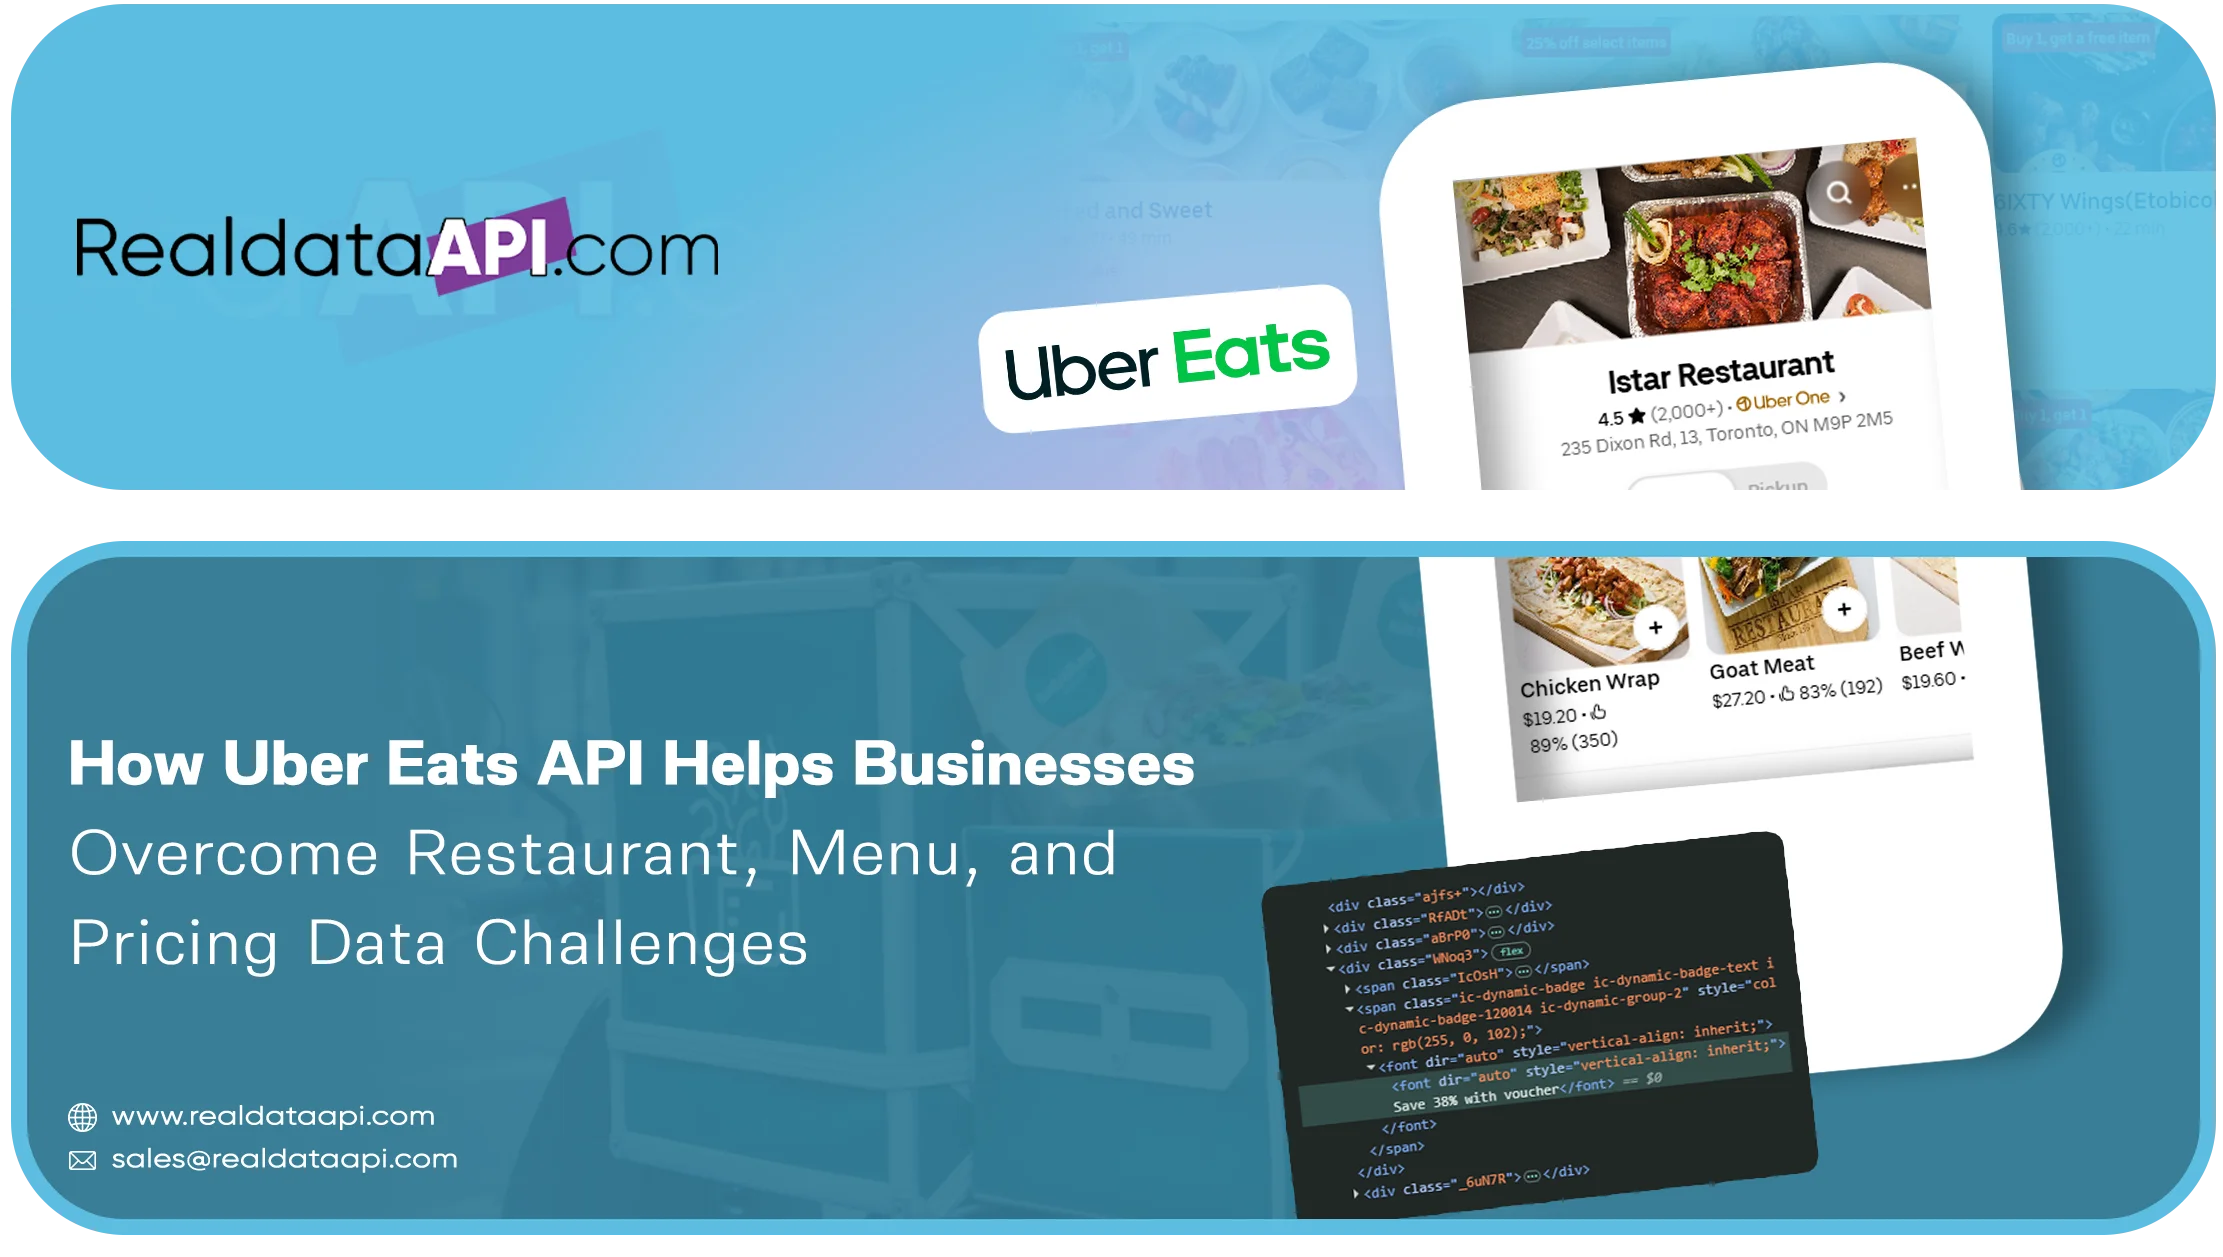
TL;DR
- Uber Eats API can help businesses structure accessible restaurant, menu, pricing, cuisine, availability, and location information for food-delivery market intelligence.
- Uber Eats Food Data Scraping can automate repetitive collection workflows, enabling restaurants, aggregators, researchers, and analytics teams to monitor competitive menus, pricing, and marketplace changes.
- Structured food-delivery data supports restaurant benchmarking, menu intelligence, price comparison, geographic analysis, and historical trend monitoring without relying entirely on manual research.
Introduction
Food-delivery businesses need accurate and timely information about restaurants, menus, prices, cuisines, promotions, availability, and locations to understand a rapidly changing digital marketplace. Uber Eats API can support structured data workflows that help businesses organize accessible food-delivery information for competitive analysis, restaurant intelligence, menu research, and pricing studies.
The core challenge is scale. Food-delivery marketplaces can contain large numbers of restaurants and menu items, with information that changes frequently. Prices can change, restaurants can update menus, items can become unavailable, new restaurants can appear, and promotional offers can vary by location and time.
Uber Eats Food Data Scraping provides an automated approach to collecting accessible marketplace information and converting it into structured datasets. Instead of manually checking individual restaurant pages, businesses can develop recurring data workflows that organize information into fields suitable for analysis.
For restaurant groups, food-tech companies, market researchers, delivery aggregators, consumer analytics firms, and competitive-intelligence teams, this data can answer practical questions: Which restaurants operate within a target area? What menu items do competitors offer? How are similar dishes priced? Which cuisines have strong marketplace representation? How does menu availability change?
The objective is not simply to collect more data. It is to create reliable, structured, historical information that connects directly to business decisions.
What Has Changed in Food-Delivery Intelligence Between 2020 and 2026?
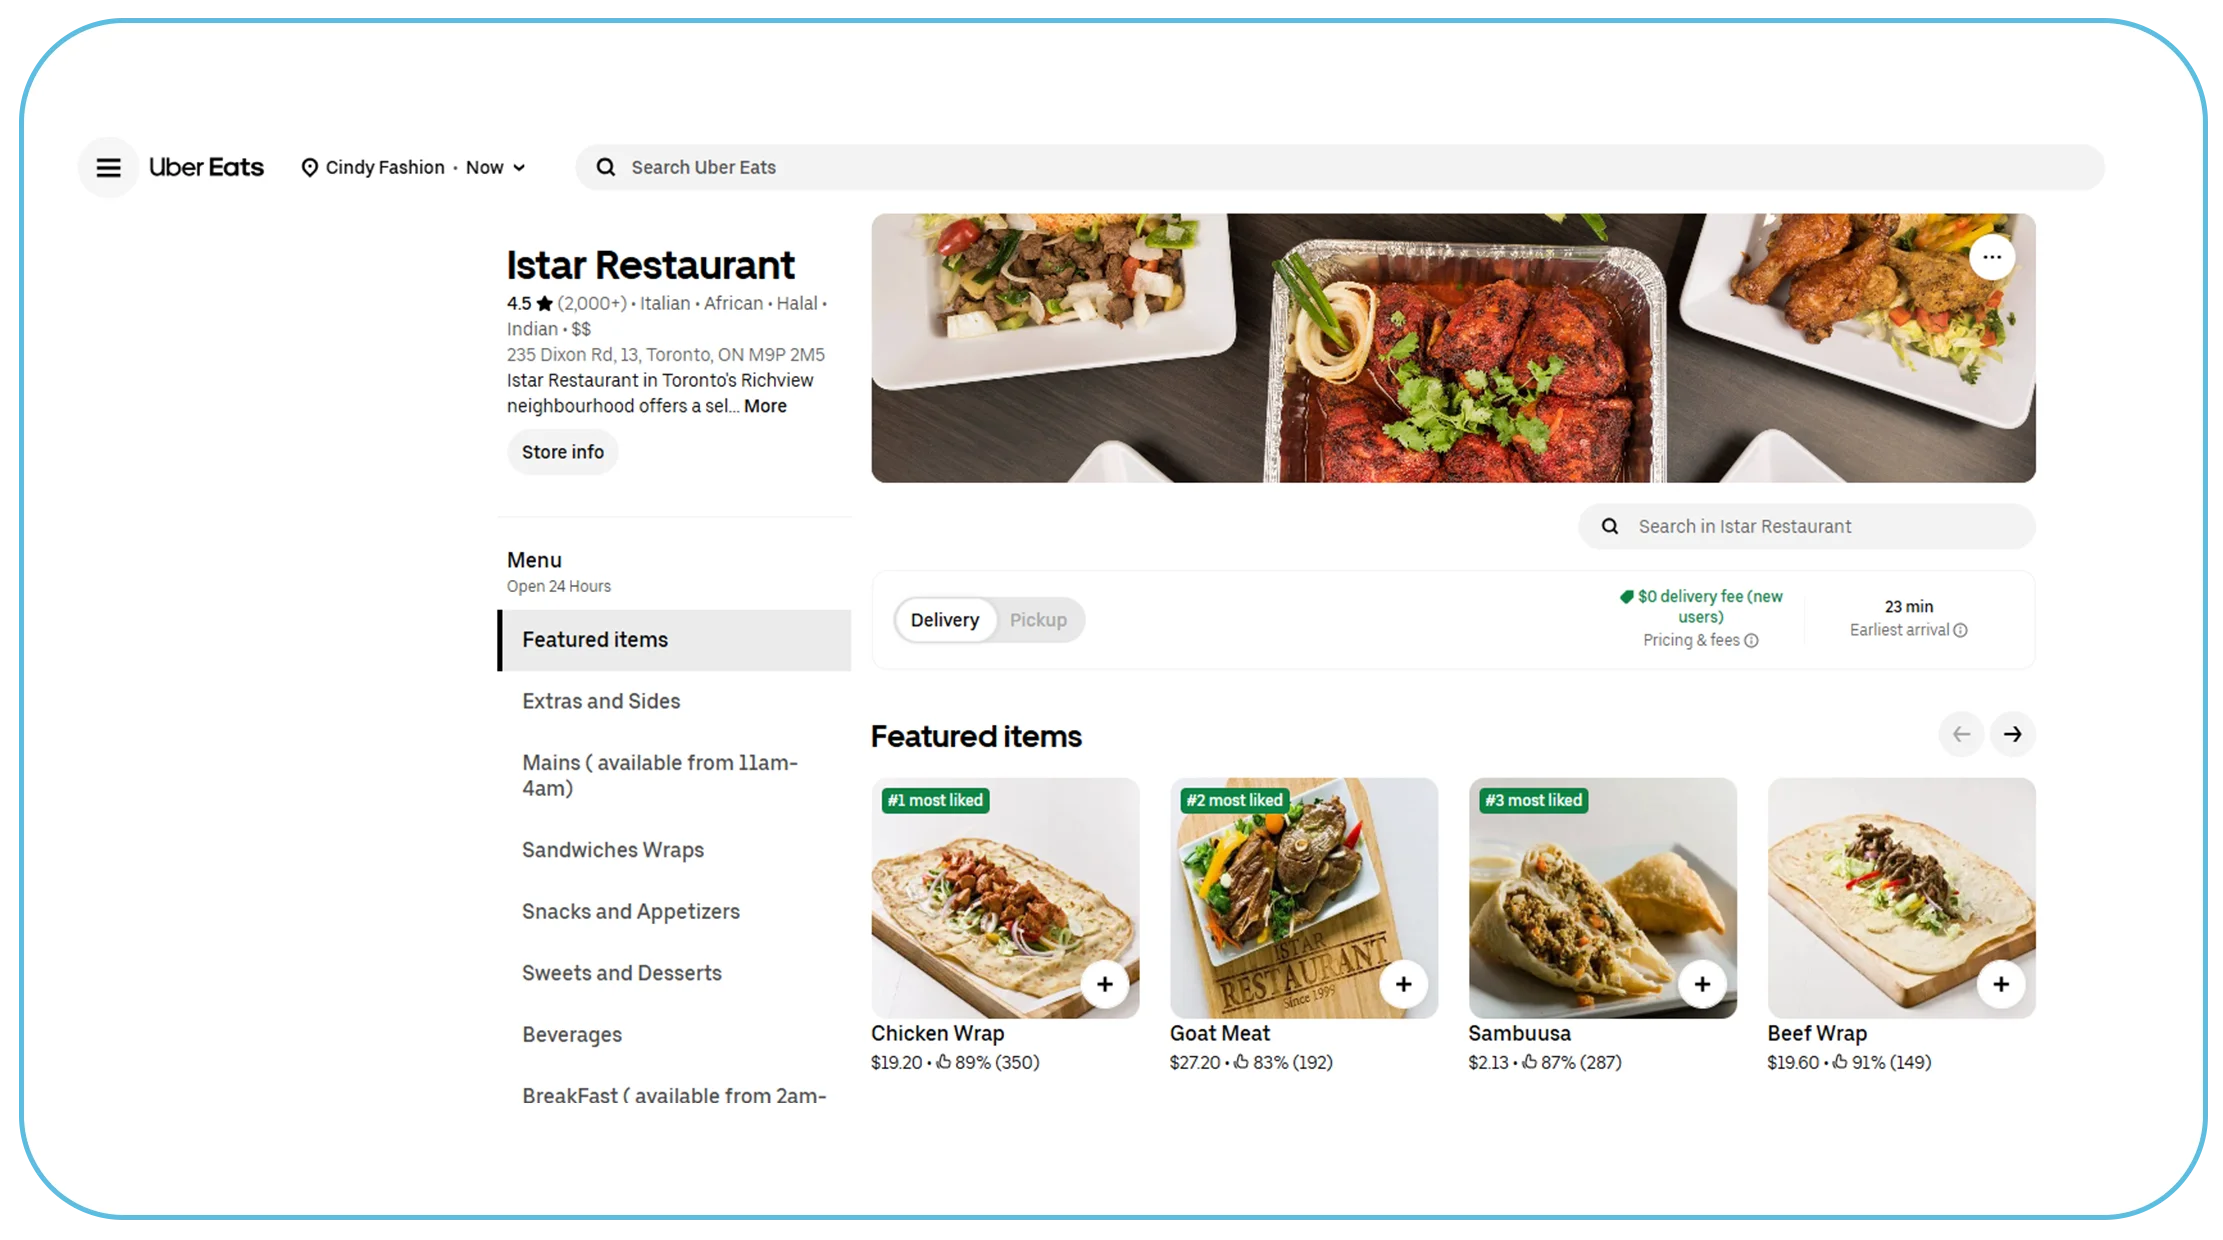
Between 2020 and 2026, digital food ordering became an increasingly important component of restaurant discovery, ordering, and customer engagement. This created a larger need for businesses to understand digital menus, restaurant availability, pricing, delivery information, and competitive positioning.
The following timeline summarizes broad industry developments rather than claiming specific Uber Eats marketplace measurements.
| Period | Marketplace intelligence development | Business implication |
|---|---|---|
| 2020 | Rapid acceleration of online food ordering | Restaurants increasingly depended on digital channels |
| 2021 | Greater adoption of delivery marketplaces | More restaurant and menu information became digitally visible |
| 2022 | Increased focus on delivery economics | Pricing and menu analysis became more important |
| 2023 | Expansion of restaurant analytics | Competitive marketplace monitoring gained importance |
| 2024 | Wider adoption of automated data workflows | Recurring restaurant-data collection became more practical |
| 2025 | Increased AI-assisted analytics | Large food datasets became easier to analyze |
| 2026 | Greater integration of restaurant intelligence | Menu, price, location, and availability signals can be analyzed together |
For businesses, the important shift is from static market research toward continuous observation. A restaurant competitor's menu today may not look the same several weeks later. A price benchmark collected once may become outdated quickly.
Historical marketplace datasets therefore provide additional value because they allow businesses to compare observations across time rather than relying on isolated snapshots.
How Can Businesses Improve Restaurant Visibility?
Uber Eats restaurant data web scraping can help businesses organize accessible restaurant-level information into structured records for competitive and geographic analysis.
Restaurant intelligence starts with understanding who operates in a particular market and how those businesses position themselves. Depending on accessible fields, a dataset may include restaurant names, locations, cuisines, ratings, menu information, pricing, availability, and other marketplace attributes.
What can restaurant-level intelligence reveal?
Businesses can use structured information to examine:
- Restaurant presence by location
- Cuisine distribution
- Restaurant ratings
- Menu breadth
- Price positioning
- Availability patterns
- Restaurant category representation
- Competitive density
- Geographic coverage
Illustrative restaurant-market dataset
| Restaurant Type | Restaurants Observed* | Average Menu Items* | Average Price Index* | Rating* |
|---|---|---|---|---|
| Fast Food | 420 | 38 | 1.0 | 4.2 |
| Italian | 185 | 46 | 1.3 | 4.4 |
| Indian | 260 | 52 | 1.1 | 4.3 |
| Chinese | 210 | 44 | 1.1 | 4.2 |
| Healthy Food | 125 | 31 | 1.4 | 4.5 |
*Illustrative example for demonstrating how restaurant intelligence can be structured. These are not current Uber Eats marketplace statistics.
Why does geographic analysis matter?
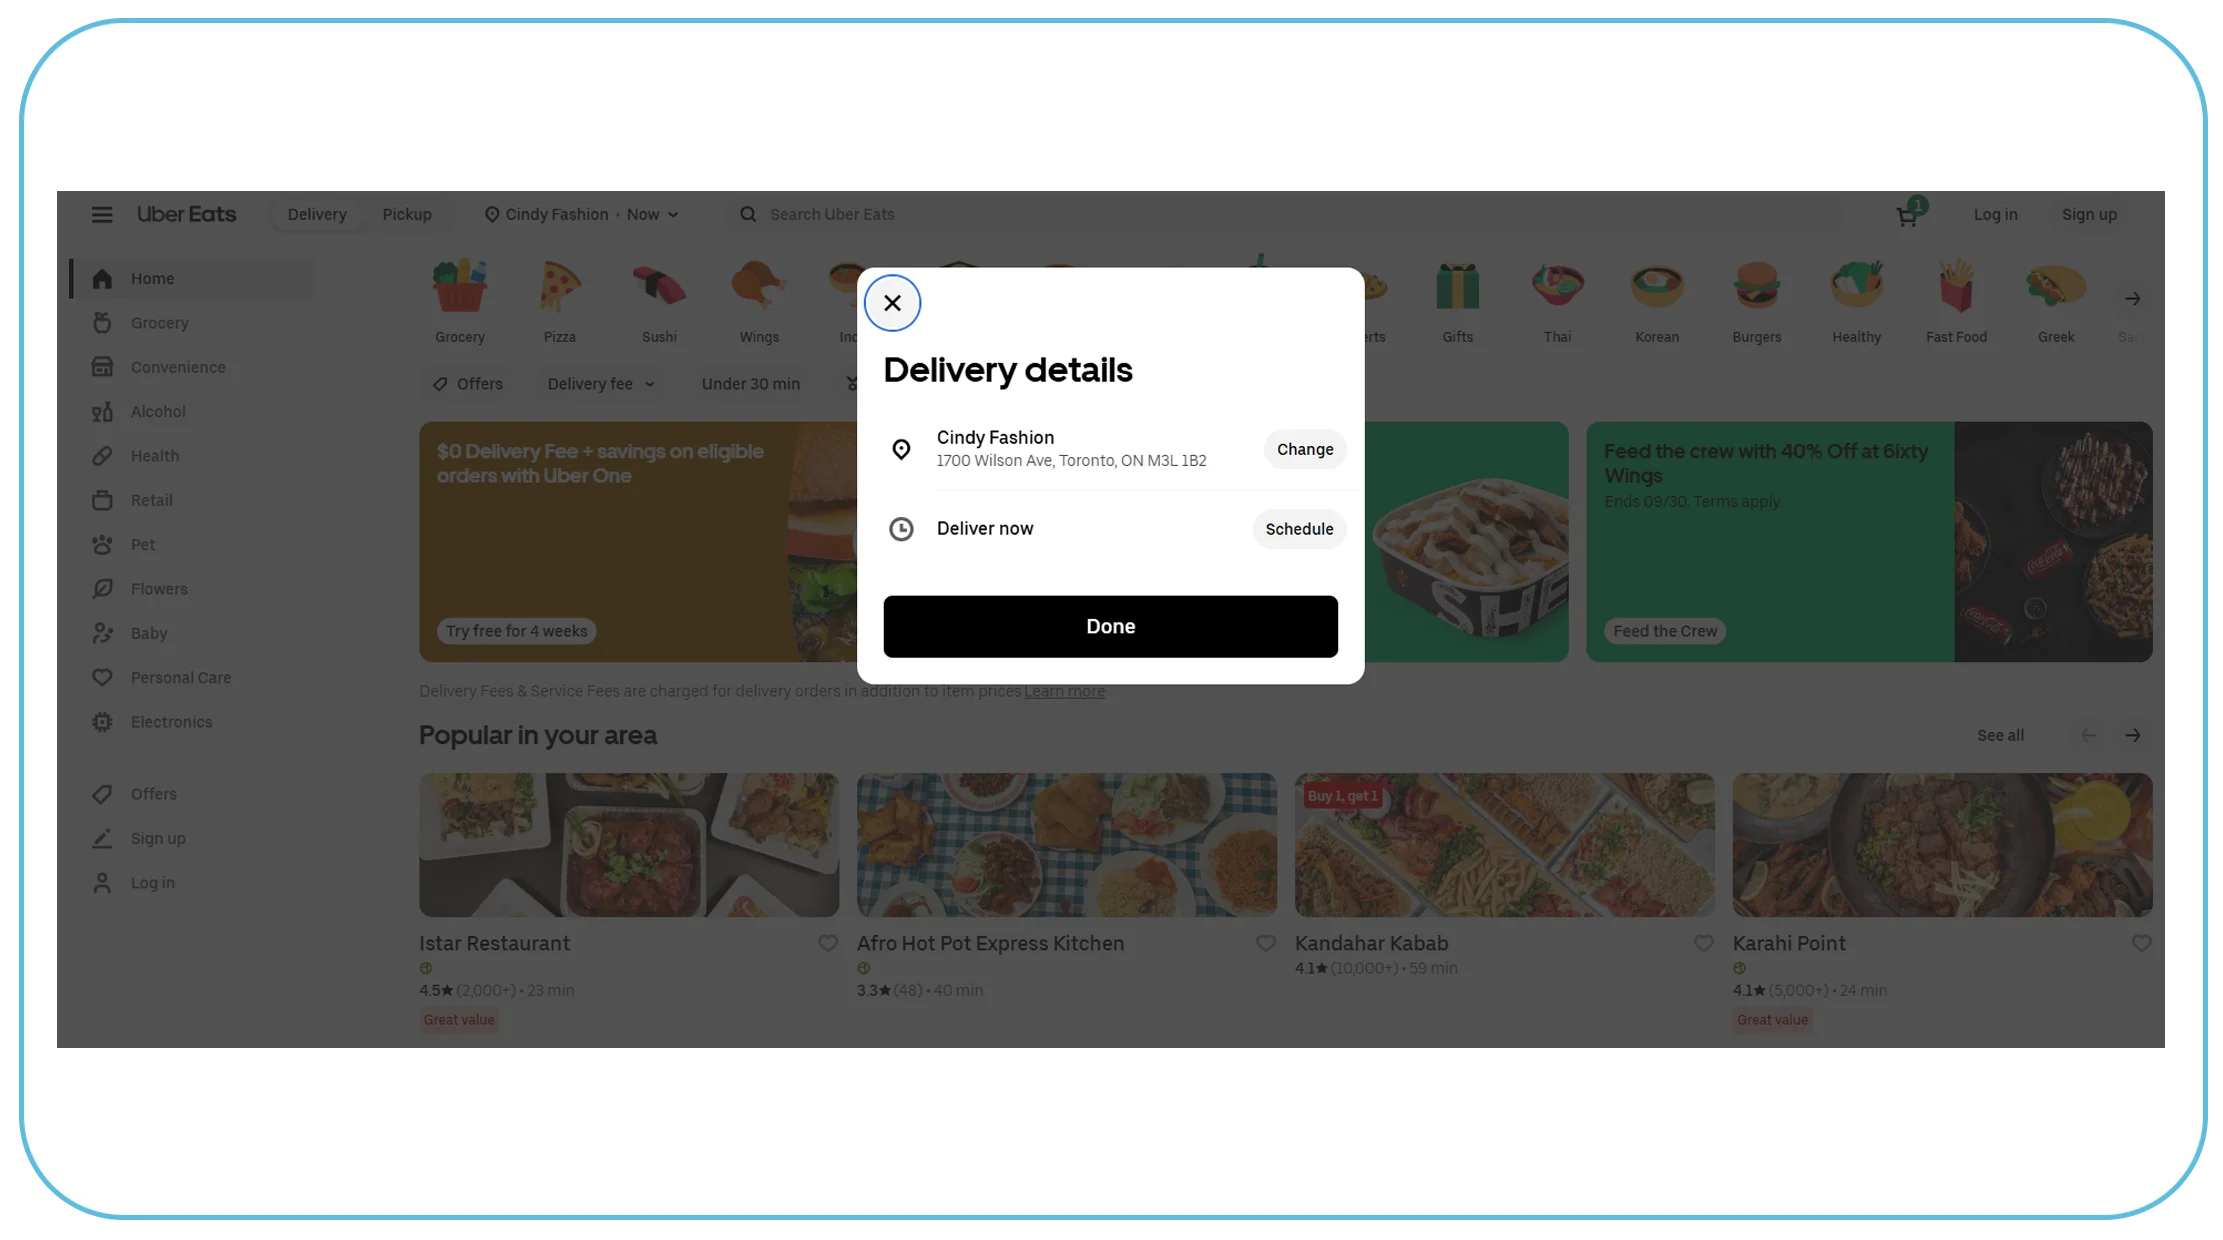
Food delivery is inherently location-sensitive. Two neighborhoods within the same city may have very different restaurant mixes, cuisines, prices, and availability.
A restaurant brand expanding into a new area could use structured marketplace data to identify competitors and understand the existing restaurant landscape before deciding where to launch.
Similarly, a food-tech company can segment restaurants geographically and analyze category density.
What fields should a restaurant dataset include?
| Field | Potential use |
|---|---|
| Restaurant name | Business identification |
| Restaurant ID | Record matching |
| Location | Geographic analysis |
| Cuisine | Market segmentation |
| Rating | Customer-perception analysis |
| Menu count | Assortment analysis |
| Price information | Competitive benchmarking |
| Availability | Operational visibility |
| Restaurant URL | Source reference |
| Timestamp | Historical comparison |
The exact fields depend on the source, accessibility, and business requirements.
How Does Automated Food-Delivery Monitoring Improve Competitive Research?
Uber Eats food delivery data scraping can help businesses collect recurring observations across restaurants, menu items, prices, categories, and availability.
Food-delivery marketplaces are dynamic. Restaurants may add seasonal products, remove slow-moving dishes, change prices, introduce promotions, or temporarily disable items.
A one-time dataset cannot capture these changes effectively.
What can recurring collection identify?
A recurring workflow can help businesses detect:
- New restaurant listings
- New menu items
- Removed products
- Price changes
- Menu-price differences
- Availability changes
- Category changes
- Restaurant expansion
- Promotional patterns
- Changes in menu breadth
Example change-monitoring table
| Metric | Snapshot A* | Snapshot B* | Observed change* |
|---|---|---|---|
| Restaurants | 1,000 | 1,060 | +6.0% |
| Menu items | 42,000 | 44,500 | +6.0% |
| Average listed price | $14.20 | $14.80 | +4.2% |
| Available items | 37,800 | 39,900 | +5.6% |
| Categories | 28 | 30 | +2 |
*Illustrative example only.
Why is historical data valuable?
Historical records can help analysts distinguish temporary changes from longer-term patterns.
For example, a restaurant may temporarily remove an item because of inventory constraints. If the item returns in the next collection cycle, the business can distinguish temporary unavailability from permanent menu removal.
Similarly, tracking prices over multiple observations can reveal whether a price adjustment is temporary or part of a broader pricing strategy.
Who benefits?
Restaurant brands can benchmark competitors.
Food-delivery platforms can study marketplace composition.
Market researchers can analyze local food trends.
Investors and analysts can study restaurant-market characteristics.
Food-tech companies can build analytical applications around structured restaurant information.
The strongest monitoring workflows connect data collection with specific analytical questions instead of collecting information without a defined purpose.
How Can Businesses Analyze Menu Composition and Pricing?
Businesses that need detailed restaurant intelligence can extract Uber Eats menu data to structure information around menu categories, item names, prices, descriptions, availability, and other accessible attributes.
Menu analysis provides a more detailed view of restaurant positioning than restaurant-level information alone.
What can menu data reveal?
Businesses can compare:
- Number of menu items
- Menu categories
- Item prices
- Portion descriptions
- Cuisine-specific offerings
- Vegetarian or dietary options where explicitly available
- Promotional pricing
- Availability
- Product descriptions
- Menu changes over time
Illustrative menu comparison
| Restaurant | Menu Items* | Average Item Price* | Premium Items* | Discounted Items* |
|---|---|---|---|---|
| Restaurant A | 48 | $13.50 | 8 | 6 |
| Restaurant B | 65 | $16.20 | 14 | 9 |
| Restaurant C | 39 | $11.80 | 4 | 5 |
| Restaurant D | 72 | $18.10 | 19 | 11 |
*Illustrative data.
How does menu intelligence support pricing research?
Suppose several restaurants sell similar cuisine. A business can group comparable dishes and compare their listed prices.
Rather than asking only, "What is the average restaurant price?" analysts can ask more precise questions:
- What is the price range for comparable dishes?
- Which restaurants offer premium versions?
- Which menu categories have the largest price differences?
- How frequently do prices change?
- Which restaurants have the broadest assortment?
- How does menu breadth relate to pricing?
Menu data normalization
Menu information often requires normalization before analysis.
For example:
Chicken Burger, Chicken Burgers, and Classic Chicken Burger may refer to related but different products. Analysts need appropriate classification rules rather than assuming that similarly named items are identical.
A structured data model can separate:
Restaurant → Menu Category → Menu Item → Price → Attributes → Availability → Timestamp
This hierarchy makes historical and competitive analysis more manageable.
How Can an API Workflow Support Food-Delivery Analytics?
An Uber Eats food delivery data API can provide an integration-oriented approach for businesses that need structured marketplace information connected to analytics platforms, databases, dashboards, or applications.
API-driven workflows are particularly useful for technical teams that want to automate data movement rather than depend on manually prepared files.
Example architecture
Data Access → Parsing → Validation → Normalization → Storage → Analytics → Dashboard
Each stage has a specific purpose.
| Stage | Function |
|---|---|
| Data access | Retrieve available information |
| Parsing | Convert source responses into fields |
| Validation | Identify incomplete or inconsistent records |
| Normalization | Standardize categories and values |
| Storage | Maintain structured records |
| Analytics | Generate business metrics |
| Dashboard | Present insights to decision-makers |
What can businesses build?
An API-oriented data workflow can support applications such as:
- Restaurant discovery platforms
- Menu comparison systems
- Pricing dashboards
- Competitive intelligence tools
- Restaurant research databases
- Food-market analytics platforms
- Location intelligence systems
- Menu trend monitoring
Why does integration matter?
Data becomes more useful when it reaches the systems where business teams already work.
A pricing team may need data in a business intelligence platform. A technology team may need structured records in a database. A market researcher may need historical exports.
The delivery format should therefore be selected based on downstream requirements.
What KPIs can be monitored?
Businesses can define metrics such as:
- Restaurants monitored
- Menu items tracked
- Price changes detected
- New items identified
- Removed items identified
- Availability changes
- Category changes
- Data completeness
- Collection success rate
This creates a measurable marketplace intelligence program rather than an isolated scraping project.
How Can a Structured Dataset Support Food-Market Research?
An Uber EATS Food Dataset can bring restaurant, menu, pricing, category, location, availability, and other accessible information into a structured analytical resource.
For research organizations and data teams, the major advantage of a structured dataset is consistency.
What can the dataset contain?
| Dataset layer | Example information |
|---|---|
| Restaurant | Name, location, cuisine |
| Menu | Category, item, description |
| Pricing | Listed price, promotional price where available |
| Availability | Accessible availability status |
| Ratings | Rating information where available |
| Location | Geographic information |
| Product | Item-level attributes |
| Historical | Timestamped observations |
What research questions can it answer?
A food-market dataset can help analysts investigate:
- Which cuisines are widely represented?
- How do menu prices differ by area?
- Which categories contain the largest assortments?
- How does menu breadth vary between restaurants?
- How frequently do menu items change?
- Which restaurant types operate within a target market?
- How do prices vary across comparable products?
Illustrative market-analysis framework
| Research dimension | Example KPI |
|---|---|
| Restaurant density | Restaurants per target area |
| Menu depth | Average items per restaurant |
| Pricing | Average listed price |
| Assortment | Items by category |
| Availability | Available-item percentage |
| Competition | Restaurants per cuisine |
| Change rate | Products added or removed |
The dataset can become more valuable when historical snapshots are preserved.
For example, comparing quarterly observations can show whether restaurant density, menu breadth, or pricing patterns are changing.
Why should data be timestamped?
Without timestamps, businesses may know what the marketplace looked like but not when the observation occurred.
Timestamped data enables:
Current state + Historical state + Change detection = Marketplace trend intelligence
This is particularly important for businesses operating in fast-moving food-delivery categories.
How Can Automated Collection Reduce Manual Marketplace Research?
An Uber Eats Scraper can automate recurring collection workflows for accessible restaurant and menu information, reducing repetitive manual inspection.
Manual research may be appropriate for a small sample. However, it becomes increasingly inefficient when analysts need to monitor hundreds or thousands of restaurants or menu items.
What does automation change?
Instead of:
Search → Open restaurant → Inspect menu → Record price → Repeat
A structured workflow can follow:
Collect → Parse → Normalize → Validate → Store → Compare
Benefits of automation
Scale: More restaurants and menu items can be monitored.
Consistency: Standardized fields make records easier to compare.
Frequency: Businesses can establish recurring collection schedules.
Historical analysis: Dated snapshots can be retained.
Efficiency: Analysts spend less time copying information manually.
Illustrative productivity comparison
| Activity | Manual workflow* | Automated workflow* |
|---|---|---|
| Restaurants reviewed | 100 | 1,000+ |
| Manual entry | High | Lower |
| Repeat monitoring | Time-intensive | Scheduled |
| Historical storage | Manual | Automated |
| Change detection | Manual comparison | Programmatic |
*Conceptual comparison, not a measured benchmark.
What should businesses automate first?
A practical approach is to prioritize high-value, repetitive tasks:
- Restaurant identification
- Menu collection
- Price capture
- Availability capture
- Category classification
- Historical storage
- Change detection
- Reporting
Automation should remain aligned with applicable terms, access requirements, and legal considerations.
Why Choose Real Data API?
Selecting a data provider requires evaluating more than the ability to collect information. Businesses should assess scalability, data quality, field coverage, historical support, delivery formats, validation, and integration capabilities.
Real Data API can help businesses develop structured data workflows for restaurant intelligence, menu research, pricing analysis, and food-delivery market intelligence.
What should buyers evaluate?
| Evaluation criterion | Why it matters |
|---|---|
| Data coverage | Determines available analytical fields |
| Scalability | Supports larger restaurant volumes |
| Data quality | Improves downstream analytics |
| Historical storage | Enables trend analysis |
| Customization | Matches business-specific requirements |
| Delivery format | Supports technical integration |
| Automation | Enables recurring monitoring |
| Validation | Helps identify data-quality issues |
The ideal dataset should be designed around the buyer's business problem.
For example, a restaurant chain may prioritize competitor pricing and menu assortment. A food-tech platform may require restaurant locations, categories, menus, and availability. A market research company may prioritize historical snapshots and geographic segmentation.
A clear data specification makes the collection workflow more efficient and ensures the resulting dataset supports measurable business objectives.
How Can Businesses Turn Restaurant Data Into Actionable Insights?
The real value of food-delivery marketplace data comes from connecting collection to decisions.
A practical framework can follow seven stages.
1. Define the business question
Start with a specific problem such as pricing visibility, competitor monitoring, menu benchmarking, or geographic research.
2. Select required fields
Identify the exact restaurant, menu, price, location, category, and availability attributes required.
3. Establish collection frequency
Match the monitoring schedule to the volatility of the data.
4. Normalize information
Standardize restaurant, category, menu, and pricing fields.
5. Preserve historical records
Store dated observations for change detection.
6. Create decision metrics
Build KPIs such as price changes, menu breadth, restaurant density, category growth, and availability.
7. Connect data with business systems
Deliver information into dashboards, databases, spreadsheets, APIs, or analytics applications.
This process transforms raw marketplace information into repeatable intelligence.
Conclusion
Food-delivery businesses need more than restaurant names and menu listings. They need structured visibility into restaurants, menus, prices, categories, availability, locations, and marketplace changes. Uber Eats API can support data workflows that help businesses organize accessible food-delivery information for competitive research, pricing intelligence, menu analysis, and market monitoring.
The most effective approach is to define the business objective first, identify the required data fields, automate recurring collection, validate the resulting records, preserve historical snapshots, and connect the dataset to analytics systems.
For restaurant groups, food-tech companies, market researchers, and e-commerce intelligence teams, this approach can turn fragmented marketplace information into a repeatable source of business intelligence.
Ready to build a scalable restaurant, menu, and pricing intelligence workflow? Contact Real Data API to discuss a customized data solution for your food-delivery analytics requirements.
FAQs
1. What is Uber Eats API used for?
Uber Eats API can support structured food-market workflows involving accessible restaurant, menu, pricing, availability, and location information for analytics and competitive research.
2. How does Uber Eats Food Data Scraping help businesses?
Uber Eats Food Data Scraping can organize accessible marketplace information into structured datasets, helping businesses compare restaurants, menus, prices, categories, and availability.
3. What is Uber Eats restaurant data web scraping?
Uber Eats restaurant data web scraping involves collecting accessible restaurant information such as names, locations, cuisines, ratings, menus, prices, and other relevant attributes.
4. Why extract Uber Eats menu data?
Businesses can extract Uber Eats menu data to analyze item assortments, categories, prices, availability, and menu changes for restaurant benchmarking and food-market research.
5. How can Real Data API support food-delivery intelligence?
Real Data API can help organizations structure Uber Eats food delivery data API workflows for restaurant monitoring, menu analysis, pricing research, historical datasets, and competitive intelligence.
Latest posts
How Uber Eats API Helps Businesses Overcome Restaurant, Menu, and Pricing Data Challenges
How Myntra API Solves Fashion Retail Challenges with Fashion Product, Price, Brand, and Category Data

How Nykaa Fashion Dataset Solves Product, Price, Brand, and Fashion Market Trend Tracking Challenges

Harrods UK: The World's Leading Luxury Department Store - A Complete Guide to Harrods Data Scraping, API Access, and Datasets






.png)



