.gif)
.png)
TL;DR
- Extract Grocery Data Using the Aldi API to structure product names, prices, categories, promotions, availability, and other grocery attributes for competitive research and retail analytics.
- An Aldi Grocery Scraper can automate recurring collection, helping retailers and brands monitor assortment, pricing movements, promotions, and product changes instead of relying on manual research.
- In 2026, ALDI is accelerating expansion in the U.S., planning more than 180 new stores and targeting nearly 2,800 locations by year-end, increasing the importance of scalable grocery intelligence.
Introduction
Grocery retailers and brands need timely product information to understand pricing, assortment, promotions, and competitive positioning. Extract Grocery Data Using the Aldi API provides a practical way to collect structured information repeatedly and connect it with dashboards, databases, market-research systems, and business-intelligence platforms.
The need is becoming more important as ALDI expands its physical and digital footprint. In January 2026, ALDI U.S. announced plans to open more than 180 stores during the year, reach nearly 2,800 U.S. locations by the end of 2026, and continue toward a 3,200-store goal by the end of 2028. It also announced a $9 billion investment through 2028 covering stores, distribution infrastructure, and digital improvements. An Aldi Grocery Scraper can help businesses monitor the resulting changes in products, prices, promotions, and assortment across markets.
For data buyers, expansion means more opportunities to study assortment and pricing across markets. A structured extraction workflow can capture product titles, descriptions, prices, package sizes, categories, promotional information, availability indicators, and collection timestamps.
This information can help grocery brands answer practical questions: Which products are discounted? How frequently do prices change? Which categories have the widest assortment? Which products disappear or reappear? How does pricing differ across markets?
The objective is not simply to collect more records. It is to build a repeatable intelligence process that converts changing grocery information into measurable commercial signals.
How Does Automated Grocery Collection Improve Retail Intelligence?
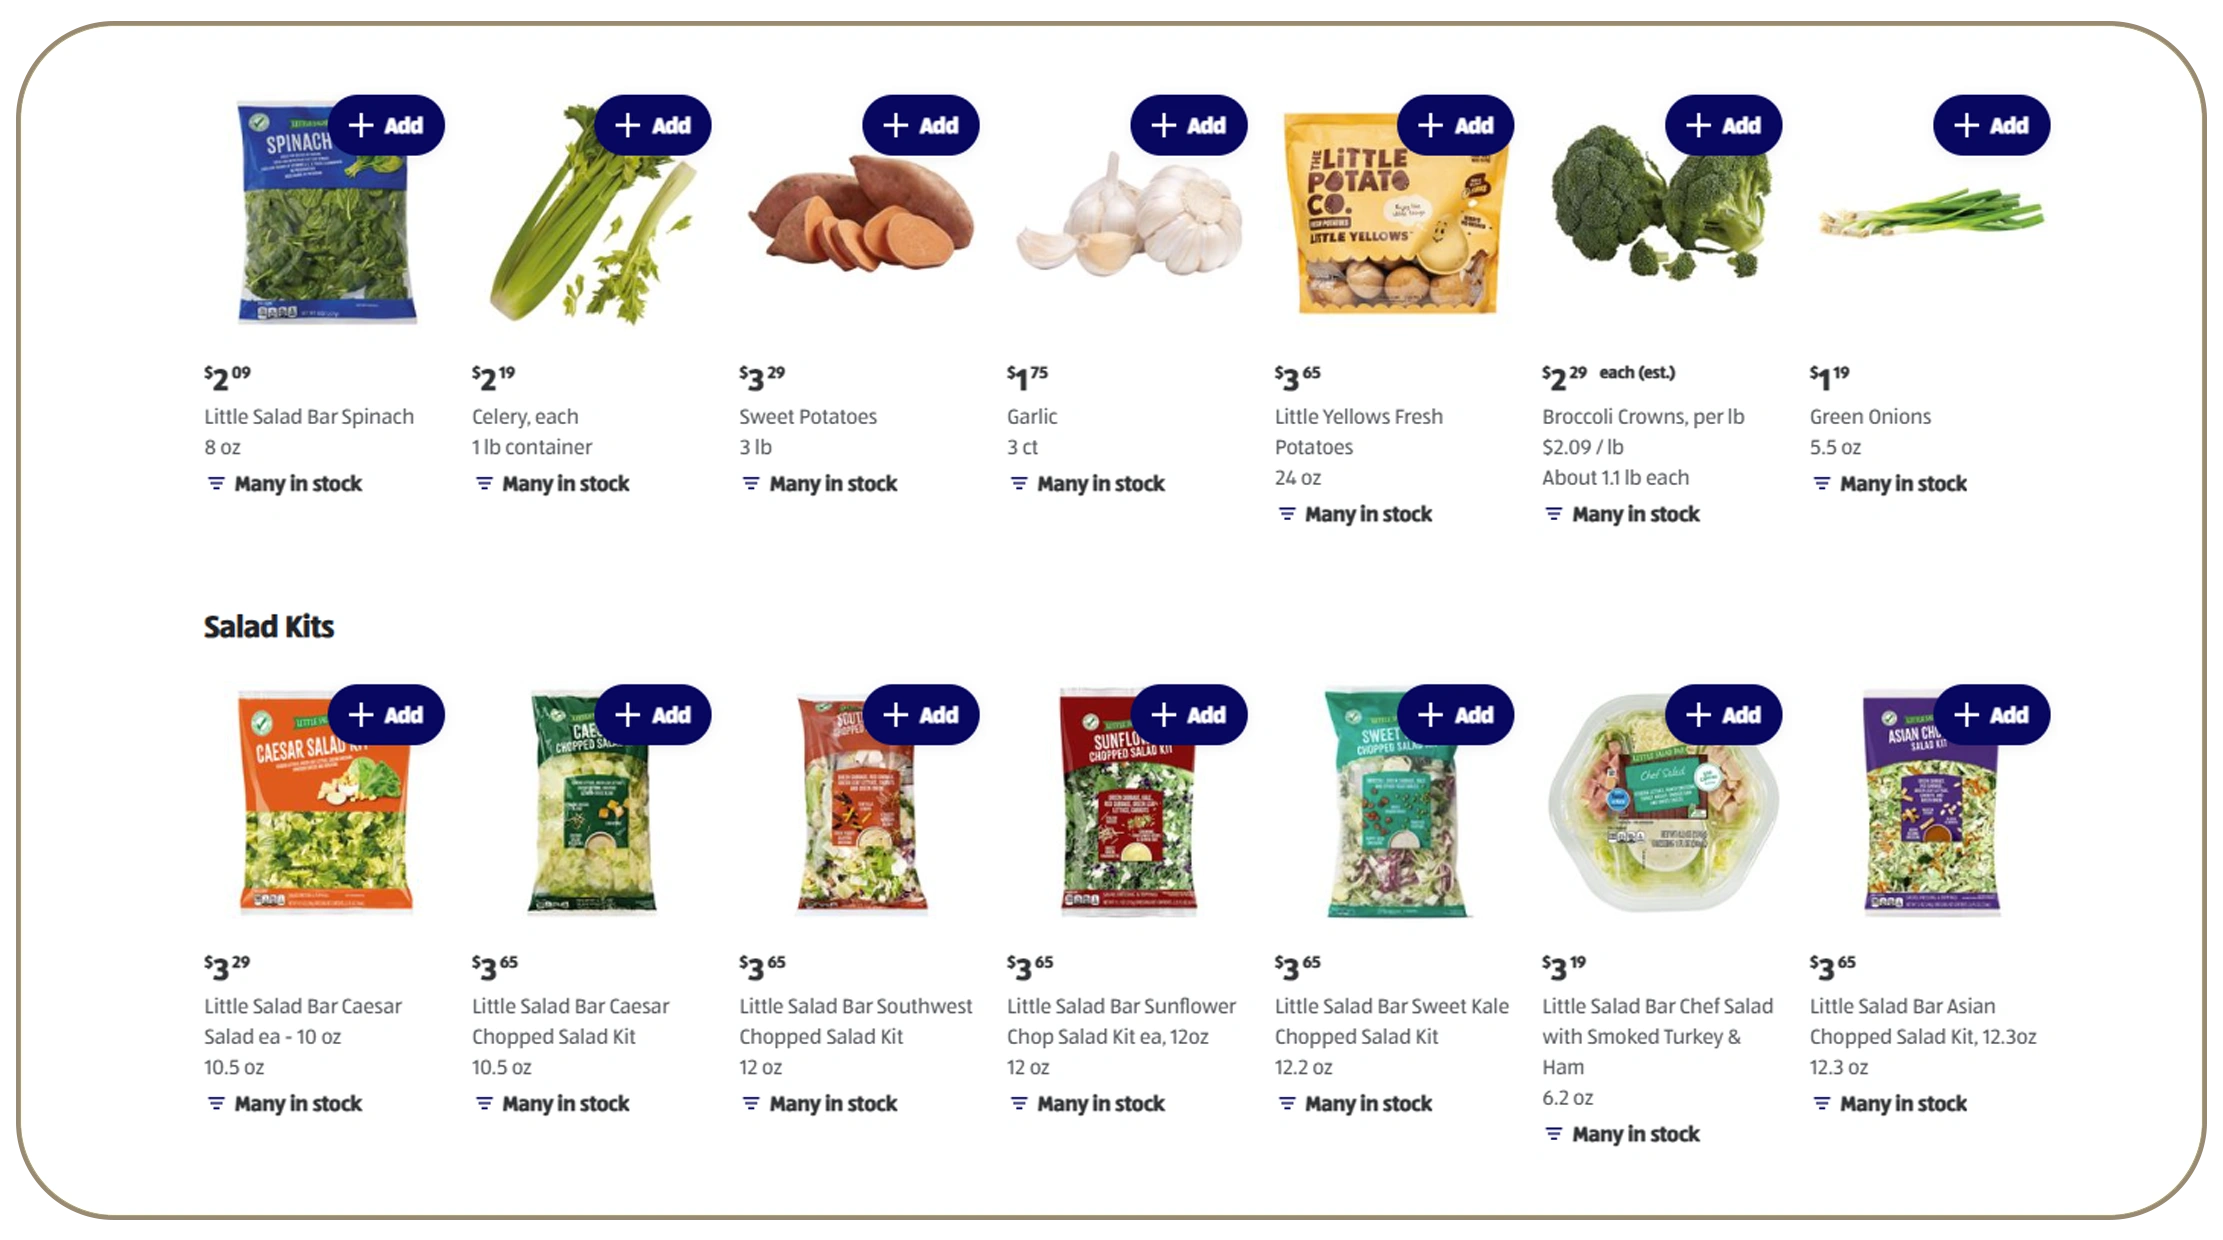
A scalable collection process can turn changing online grocery information into a consistent historical dataset. Aldi API data extraction allows businesses to structure product information and make it available for downstream analytics rather than repeatedly copying information manually.
The workflow typically includes four stages: discovery, extraction, normalization, and storage. Discovery identifies the required product or category pages. Extraction captures relevant attributes. Normalization standardizes names, prices, units, categories, and timestamps. Storage preserves historical snapshots so analysts can identify changes.
ALDI's expansion provides a useful example of why historical monitoring matters. In 2025, the retailer announced plans to open more than 225 new U.S. stores, while its 2026 plan calls for more than 180 additional stores.
| Year | ALDI U.S. growth context | Data opportunity |
|---|---|---|
| 2020 | Digital grocery demand accelerated | Establish product baselines |
| 2021 | Online shopping remained important | Expand category monitoring |
| 2022 | Retailers adapted to changing demand | Track price movements |
| 2023 | Digital grocery matured | Build historical comparisons |
| 2024 | ALDI acquired Southeastern Grocers assets | Monitor assortment expansion |
| 2025 | 225+ new-store plan announced | Expand geographic datasets |
| 2026 | 180+ new stores planned | Increase automated monitoring |
The 2020-2023 rows represent broader grocery-market developments rather than ALDI-specific store-count claims. The 2025 and 2026 expansion figures are based on ALDI announcements.
For retailers, the major benefit is consistency. A scheduled pipeline can collect the same fields repeatedly, allowing analysts to distinguish temporary price changes from sustained movements.
A buyer can also define business rules around the collected information. For example, the system can flag products whose prices change beyond a selected threshold, identify newly listed products, detect discontinued items, or highlight categories where assortment has expanded.
This transforms raw product information into an operational dataset that pricing, merchandising, procurement, and competitive-intelligence teams can use.
How Can Fresh Data Support Price Monitoring?
Real-Time Aldi Data Supports Price Monitoring when product information is collected frequently enough to identify meaningful changes between snapshots. For pricing teams, the objective is not necessarily minute-by-minute monitoring for every product. The appropriate refresh frequency depends on category volatility, business requirements, and the decisions being supported.
A daily dataset may be sufficient for many grocery categories, while promotional campaigns or highly competitive products may justify more frequent collection.
ALDI's positioning around value makes price intelligence particularly relevant. In 2025, ALDI announced price reductions across more than 400 products during its summer campaign and separately promoted its position as a low-price national grocer.
| Year | Grocery-pricing environment | Monitoring focus |
|---|---|---|
| 2020 | Pandemic-driven volatility | Baseline prices |
| 2021 | Elevated grocery demand | Price changes |
| 2022 | Inflation pressure | Inflation-adjusted comparisons |
| 2023 | Consumers remained price sensitive | Promotion tracking |
| 2024 | Value competition intensified | Competitor benchmarking |
| 2025 | ALDI promoted reductions across 400+ products | Promotional monitoring |
| 2026 | Expansion continues | Localized price intelligence |
Price monitoring should account for unit size and packaging. A simple comparison of displayed prices can be misleading when package sizes differ. A stronger dataset can calculate unit prices such as price per ounce, pound, liter, or item.
Historical snapshots can also distinguish regular prices from promotional prices. When a product returns to its previous price after a promotion, the event can be recorded as a temporary discount rather than a permanent price change.
For competitive pricing teams, this supports several use cases:
- Identifying products with frequent price changes.
- Comparing comparable products by unit price.
- Tracking promotional depth.
- Measuring promotion duration.
- Monitoring private-label assortment.
- Detecting pricing gaps between retailers.
- Creating category-level price indexes.
The most valuable output is therefore not a spreadsheet containing thousands of prices. It is a structured price history that allows teams to understand what changed, when it changed, and where the change occurred.
Turn changing grocery prices into a structured historical dataset that your pricing and competitive-intelligence teams can analyze continuously.
Get Insights Now!How Can Grocery Information Strengthen Competitive Intelligence?
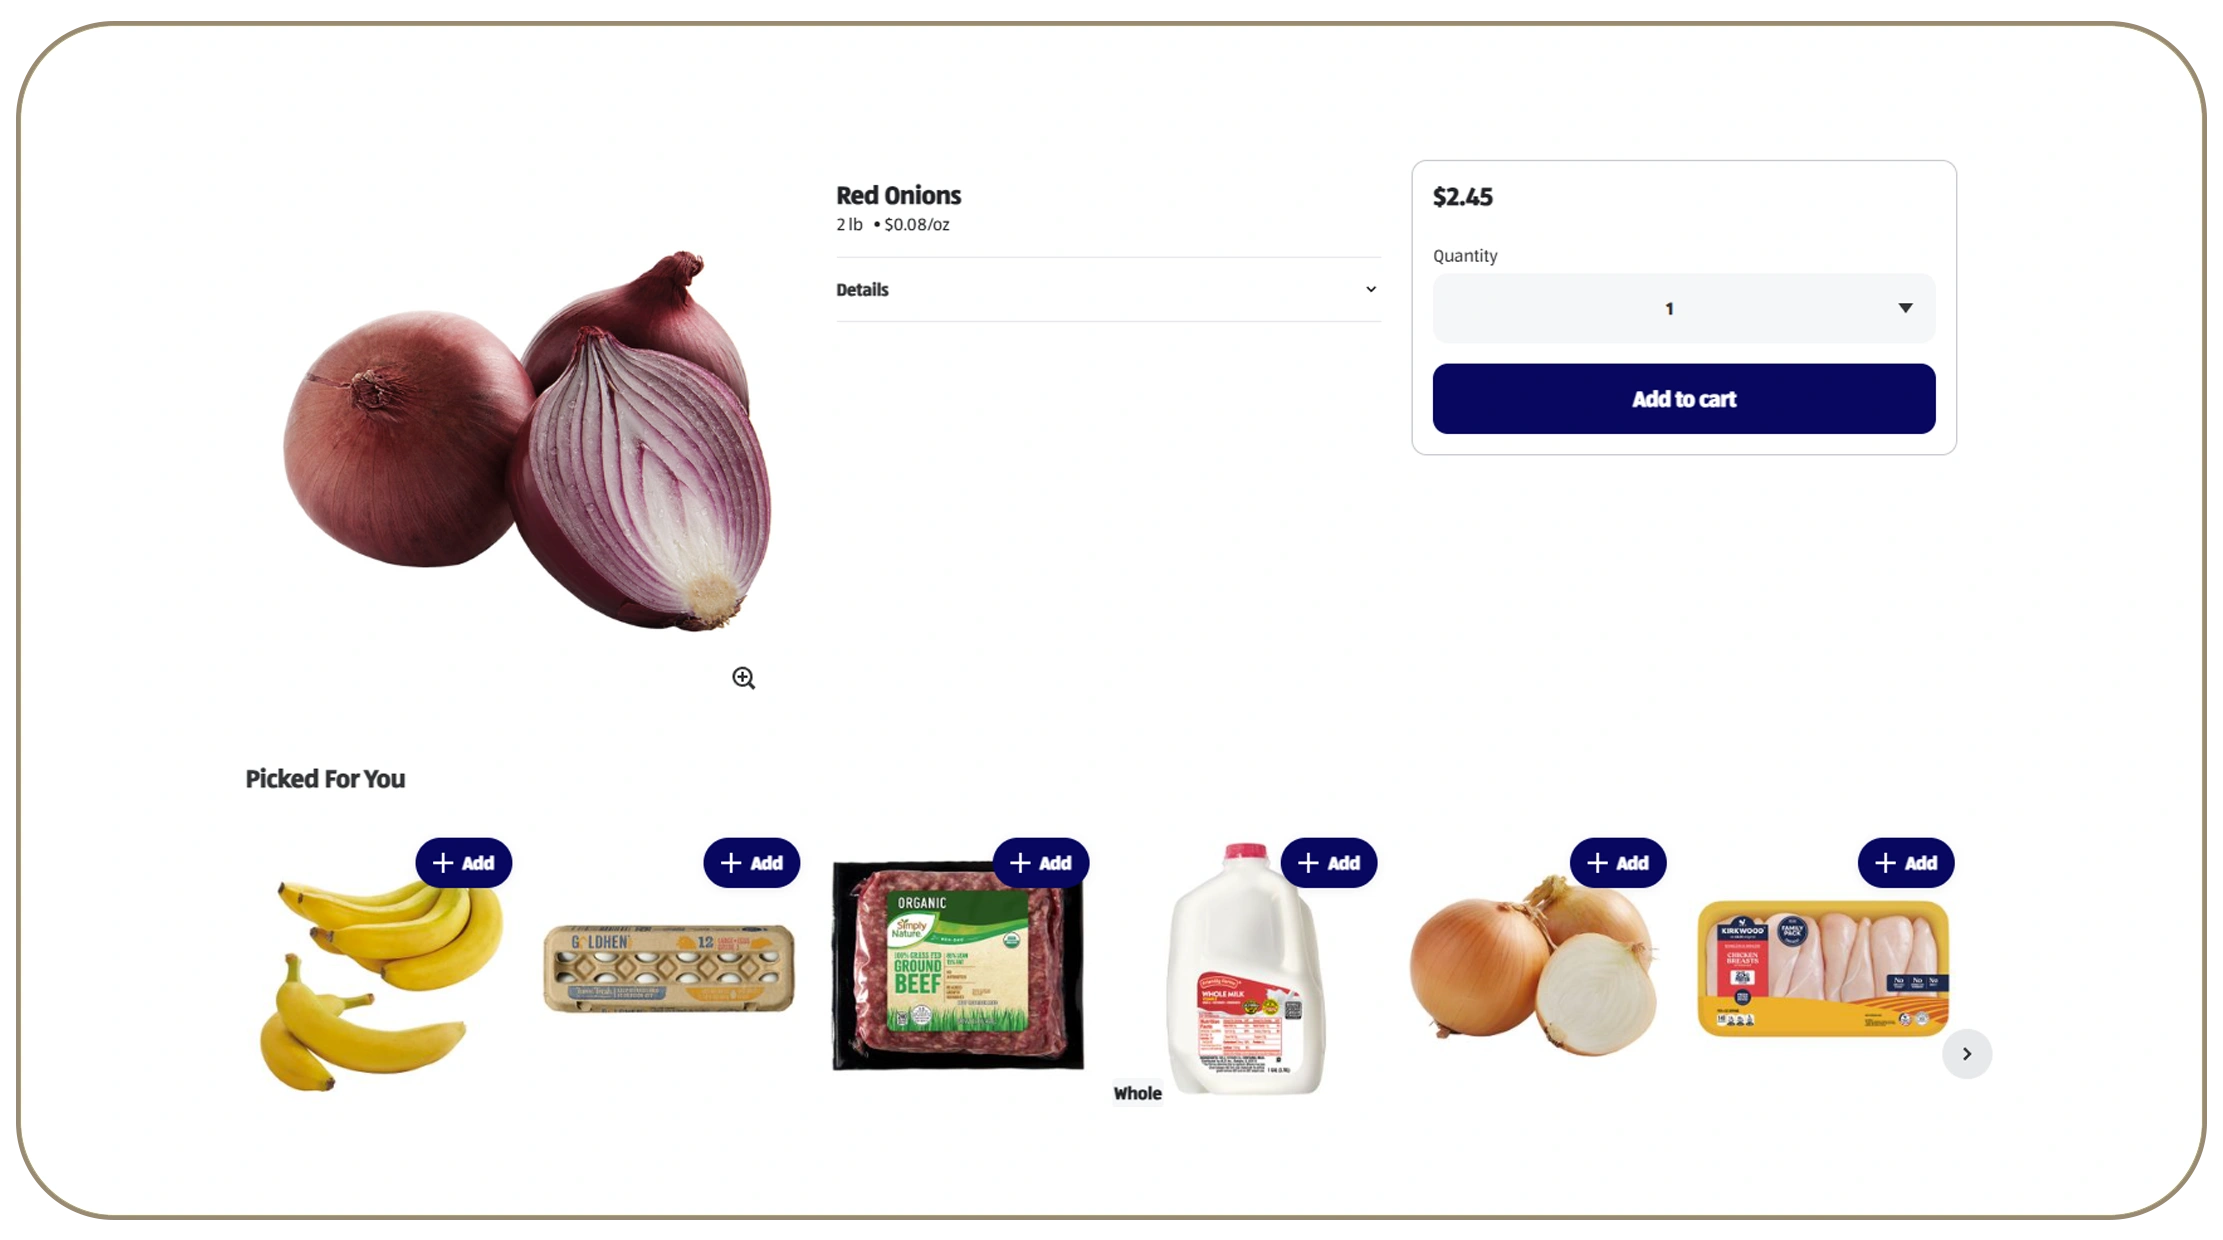
Aldi Grocery Data for Competitive Intelligence can help brands understand how products are positioned within a fast-changing grocery environment. Instead of reviewing individual product pages manually, analysts can compare categories, prices, pack sizes, brands, promotions, and availability across historical snapshots.
Competitive intelligence becomes stronger when the dataset contains consistent fields. For example, a product record can include product name, brand, category, package size, price, unit price, promotional status, availability, URL, and collection timestamp.
ALDI's expansion makes geographic analysis particularly relevant. In 2026, the retailer announced plans to enter Maine, expand in Phoenix, continue growth in the Southeast, and plan a future Colorado expansion.
| Year | Competitive-intelligence priority | Example analysis |
|---|---|---|
| 2020 | Consumer behavior changes | Category demand |
| 2021 | Digital grocery adoption | Online assortment |
| 2022 | Inflation | Price positioning |
| 2023 | Value competition | Private-label comparisons |
| 2024 | Store-network changes | Geographic coverage |
| 2025 | Accelerated expansion | Market-entry analysis |
| 2026 | Multi-market growth | Local assortment and pricing |
A geographic dataset can reveal whether certain products are available in one market but absent in another. It can also show whether pricing or promotions vary by location.
For brands, this can support assortment decisions. If a competitor consistently carries a particular category or product format, that may indicate an opportunity worth investigating. Conversely, if a product repeatedly disappears, analysts can investigate whether the change reflects seasonality, supply constraints, or assortment rationalization.
The same data can support market-basket analysis. Products can be grouped by category, brand, price band, and package size to identify competitive gaps.
For agencies and research providers, historical datasets can also support recurring reports. Instead of producing a one-time market snapshot, they can show how competitive conditions evolved from one period to the next.
The key is to treat grocery data as a longitudinal resource. A single observation tells a business what exists today. A series of observations helps explain what is changing.
What Product Information Should Businesses Collect?
Businesses that scrape Aldi product information should begin with the questions they need to answer rather than collecting every available field. A focused dataset is generally easier to maintain, validate, and analyze.
Core product fields can include:
- Product name.
- Brand.
- Category and subcategory.
- Product description.
- Current price.
- Previous or reference price when available.
- Promotional status.
- Package size.
- Unit of measure.
- Availability.
- Product URL.
- Collection timestamp.
- Location or market where applicable.
The relevance of these fields changes depending on the use case. Pricing teams may prioritize current and historical prices. Merchandising teams may emphasize categories, package sizes, and availability. Market researchers may need product descriptions and brand information for classification.
| Year | Data maturity objective | Recommended dataset development |
|---|---|---|
| 2020 | Establish fundamentals | Product and price fields |
| 2021 | Expand coverage | Category and brand fields |
| 2022 | Improve comparability | Unit-price normalization |
| 2023 | Build history | Timestamped snapshots |
| 2024 | Add geographic depth | Market-level records |
| 2025 | Scale collection | Automated refreshes |
| 2026 | Improve intelligence | Integrated analytics |
Data quality is just as important as data volume. Product names may change, promotional labels may appear temporarily, and categories can be reorganized. A reliable pipeline therefore needs validation rules.
For example, a price field should be checked for currency and numeric formatting. Package sizes should be standardized so that "16 oz," "1 lb," and comparable measurements can be analyzed correctly. Duplicate records should be identified before they reach the analytical layer.
Businesses should also preserve collection timestamps. Without timestamps, a dataset can show the current state but cannot reliably explain how that state changed.
Another important practice is maintaining historical records instead of overwriting existing values. If a product price changes from $4.99 to $4.49, both observations can be retained with their respective timestamps. This creates a price history that can later support trend analysis.
The result is a dataset designed for decisions rather than simply a collection of scraped pages.
How Does Large-Scale Collection Support Grocery Analytics?
Aldi Grocery Data Scraping becomes particularly valuable when a business needs to monitor hundreds or thousands of products over extended periods. Manual collection becomes increasingly inefficient as the number of categories, locations, and refresh cycles increases.
A scalable system can automate recurring collection and feed the results into a centralized database or data warehouse. Analysts can then query the dataset using filters such as category, brand, price range, promotion status, availability, or date.
ALDI's announced expansion illustrates the potential scale. The company expects to operate nearly 2,800 U.S. stores by the end of 2026 and has set a goal of 3,200 stores by the end of 2028.
| Year | Scale or market-development context | Analytics requirement |
|---|---|---|
| 2020 | Grocery digitization accelerated | Basic product monitoring |
| 2021 | More online purchasing | Wider SKU coverage |
| 2022 | Inflation affected grocery prices | Price-history tracking |
| 2023 | Competitive value positioning | Benchmarking |
| 2024 | Network expansion | Geographic datasets |
| 2025 | 225+ new-store plan | Scalable collection |
| 2026 | 180+ new-store plan | Multi-market monitoring |
At scale, data architecture becomes important. A business should separate collection, processing, storage, and analytics layers. This prevents a temporary extraction problem from disrupting historical records.
A scalable pipeline can also use incremental collection. Instead of processing every product equally every time, high-priority products can be refreshed more frequently while stable products are collected on a lower-frequency schedule.
This approach reduces unnecessary processing while preserving useful coverage.
Another advantage is automated change detection. The system can compare the latest record with the previous observation and flag changes in price, availability, product name, package size, or promotion.
For competitive teams, these alerts can be more valuable than the underlying raw dataset. An analyst may not need to inspect 50,000 unchanged products but may want to review the 300 records that changed since the previous collection.
The goal is therefore to transform large-scale extraction into focused intelligence. Automation handles repetitive collection while analysts concentrate on interpreting meaningful movements.
What Should a Scalable Grocery Dataset Contain?
An ALDI Grocery Dataset should be designed around consistent fields, historical snapshots, and clear relationships between products and observations. The dataset can become a reusable foundation for pricing, assortment, competitive research, and market intelligence.
A useful structure separates product attributes from time-sensitive observations.
Product table
- Product ID
- Product name
- Brand
- Category
- Subcategory
- Package size
- Product URL
Observation table
- Product ID
- Price
- Unit price
- Promotion status
- Availability
- Market
- Collection timestamp
This structure prevents repetitive product information from being unnecessarily duplicated every time a price changes.
| Year | Dataset objective | Example output |
|---|---|---|
| 2020 | Baseline creation | Initial product catalog |
| 2021 | Coverage expansion | More categories |
| 2022 | Price intelligence | Historical prices |
| 2023 | Competitive benchmarking | Category comparisons |
| 2024 | Geographic intelligence | Market-level data |
| 2025 | Automation | Recurring snapshots |
| 2026 | Decision intelligence | Alerts and dashboards |
The 2026 opportunity is especially significant because ALDI is expanding its U.S. footprint while investing in digital shopping and distribution infrastructure. The company says it expects to open more than 180 stores in 2026 and reach nearly 2,800 stores by year-end.
A structured dataset can support several analytical outputs:
- Price-change dashboards.
- Category assortment reports.
- Promotion calendars.
- Product availability monitoring.
- Competitor price indexes.
- Private-label comparisons.
- New-product detection.
- Discontinued-product tracking.
- Market-level assortment analysis.
The dataset can also be connected with external grocery information to create broader competitive models. For example, businesses can combine product records with consumer-price data, competitor catalogs, location information, or historical market indicators.
Data governance should remain part of the design. Every record should have a timestamp, source reference, and clear field definition. Changes to the extraction process should also be documented so that analysts understand why dataset structure may differ between periods.
The result is a durable grocery intelligence asset rather than a one-time export.
Why Choose Real Data API?
For organizations that need scalable grocery intelligence, Grocery Data Scraping should be treated as part of a broader data-delivery workflow rather than an isolated extraction task. Real Data API can help businesses structure recurring collection around the fields, refresh frequency, and delivery format required for their analytical use case.
The most useful approach starts with business questions. A pricing team may need historical prices and promotions. A merchandising team may require assortment and availability. A market-research organization may need category-level product information across multiple periods.
A strong delivery workflow should support structured output, consistent schemas, timestamps, historical storage, scalable collection, and integration with downstream analytics systems.
For buyers, the advantage is operational efficiency. Instead of assigning employees to repeatedly search product pages and manually update spreadsheets, businesses can create a repeatable pipeline that supplies structured information to their existing data environment.
This can support dashboards, alerts, competitive reports, pricing models, assortment analysis, and market-research projects.
In 2026, the need for scalable grocery intelligence is particularly relevant as ALDI continues its U.S. expansion. Its stated plans include more than 180 new stores in 2026, nearly 2,800 stores by year-end, and continued investment in distribution and digital capabilities.
The practical takeaway is simple: reliable grocery intelligence depends on structured collection, historical context, and delivery that fits the buyer's existing workflow.
Conclusion
Grocery businesses can improve pricing, assortment, and competitive decisions by turning product information into structured historical data. API-led collection makes recurring monitoring more practical, while normalized datasets make prices, products, promotions, and availability easier to compare.
The 2026 market environment makes this increasingly important. ALDI is accelerating U.S. expansion, planning more than 180 new stores and targeting nearly 2,800 locations by year-end. The wider grocery market is also highly competitive: in the UK, Aldi held a 10.8% grocery-market share for the 12 weeks ending May 17, 2026, according to Kantar data published by the UK government.
A successful strategy therefore combines automated collection, historical snapshots, price normalization, competitive benchmarking, and API-based delivery.
Ready to build a scalable grocery intelligence pipeline for 2026? Connect Real Data API structured grocery data with your pricing, merchandising, market-research, and competitive-intelligence workflows today!
FAQs
How does an Aldi Grocery Scraper help retailers?
An Aldi Grocery Scraper automates product collection, capturing prices, categories, promotions, availability, and other attributes so retailers can monitor competitors without repetitive manual research.
What is Aldi Grocery Data Scraping used for?
Aldi Grocery Data Scraping supports pricing analysis, assortment monitoring, promotional tracking, competitor benchmarking, product discovery, and historical grocery-market research across categories and markets.
What should an ALDI Grocery DataSet include?
An ALDI Grocery DataSet can include product names, brands, categories, prices, package sizes, promotions, availability, URLs, markets, and collection timestamps for structured analysis.
How can Grocery Data Scraping improve price intelligence?
Grocery Data Scraping creates timestamped product observations that allow businesses to compare prices, identify discounts, calculate unit-price differences, and detect meaningful competitive movements.
Can Real Data API support grocery data workflows?
Yes. Real Data API can support structured delivery workflows where collected grocery information is normalized and connected with databases, dashboards, analytics platforms, and recurring business reports.
Latest posts
Keeta scraper for monitoring food marketplace trends - Identify Discount Changes and Emerging Customer Demand
How to build a structured Nike product dataset for Product Intelligence and Retail Analytics
Allegro scraper for competitor price monitoring – How to Track Product Prices and Stay Ahead of Competitors
Ocado API data collection services for retailers - Track Competitor Prices and Deals






.png)



