.gif)
.png)

TL;DR
- Google Shopping Scraper API for product data extraction helps retailers, brands, and research teams structure large volumes of product, seller, price, and availability information.
- Businesses can scrape Google Shopping product data using API workflows to automate repetitive collection, standardize records, and support competitive pricing analysis.
- As e-commerce expanded sharply after 2020, scalable product intelligence became increasingly important for brands competing across digital channels.
Introduction
Google Shopping Scraper API for product data extraction can help businesses overcome the core challenge of collecting large volumes of changing product information efficiently. Instead of relying on manual searches, an automated workflow can organize product names, prices, brands, sellers, ratings, availability, and other relevant attributes into structured records.
Google Shopping has become an important discovery environment for product research because shoppers can compare products and sellers across multiple merchants. Google itself provides Merchant Center analytics covering product popularity, trends, competitors, and pricing for eligible retailers.
A scalable Google Shopping Scraper strategy is particularly useful for businesses that need broader competitive visibility than a small set of manual searches can provide. It can support product benchmarking, price monitoring, assortment research, seller intelligence, and historical analysis.
The need for this infrastructure has grown alongside e-commerce. U.S. e-commerce sales increased 43% in 2020 to $815.4 billion, according to the U.S. Census Bureau. By 2022, U.S. electronic shopping and mail-order sales reached $1.117 trillion, up 9.5% from 2021.
For brands and retailers, the challenge is therefore not simply finding product information. It is collecting enough information, often enough, with sufficient consistency to turn changing search results into useful market intelligence.
How Can Businesses Scale Product Collection Without Losing Data Quality?
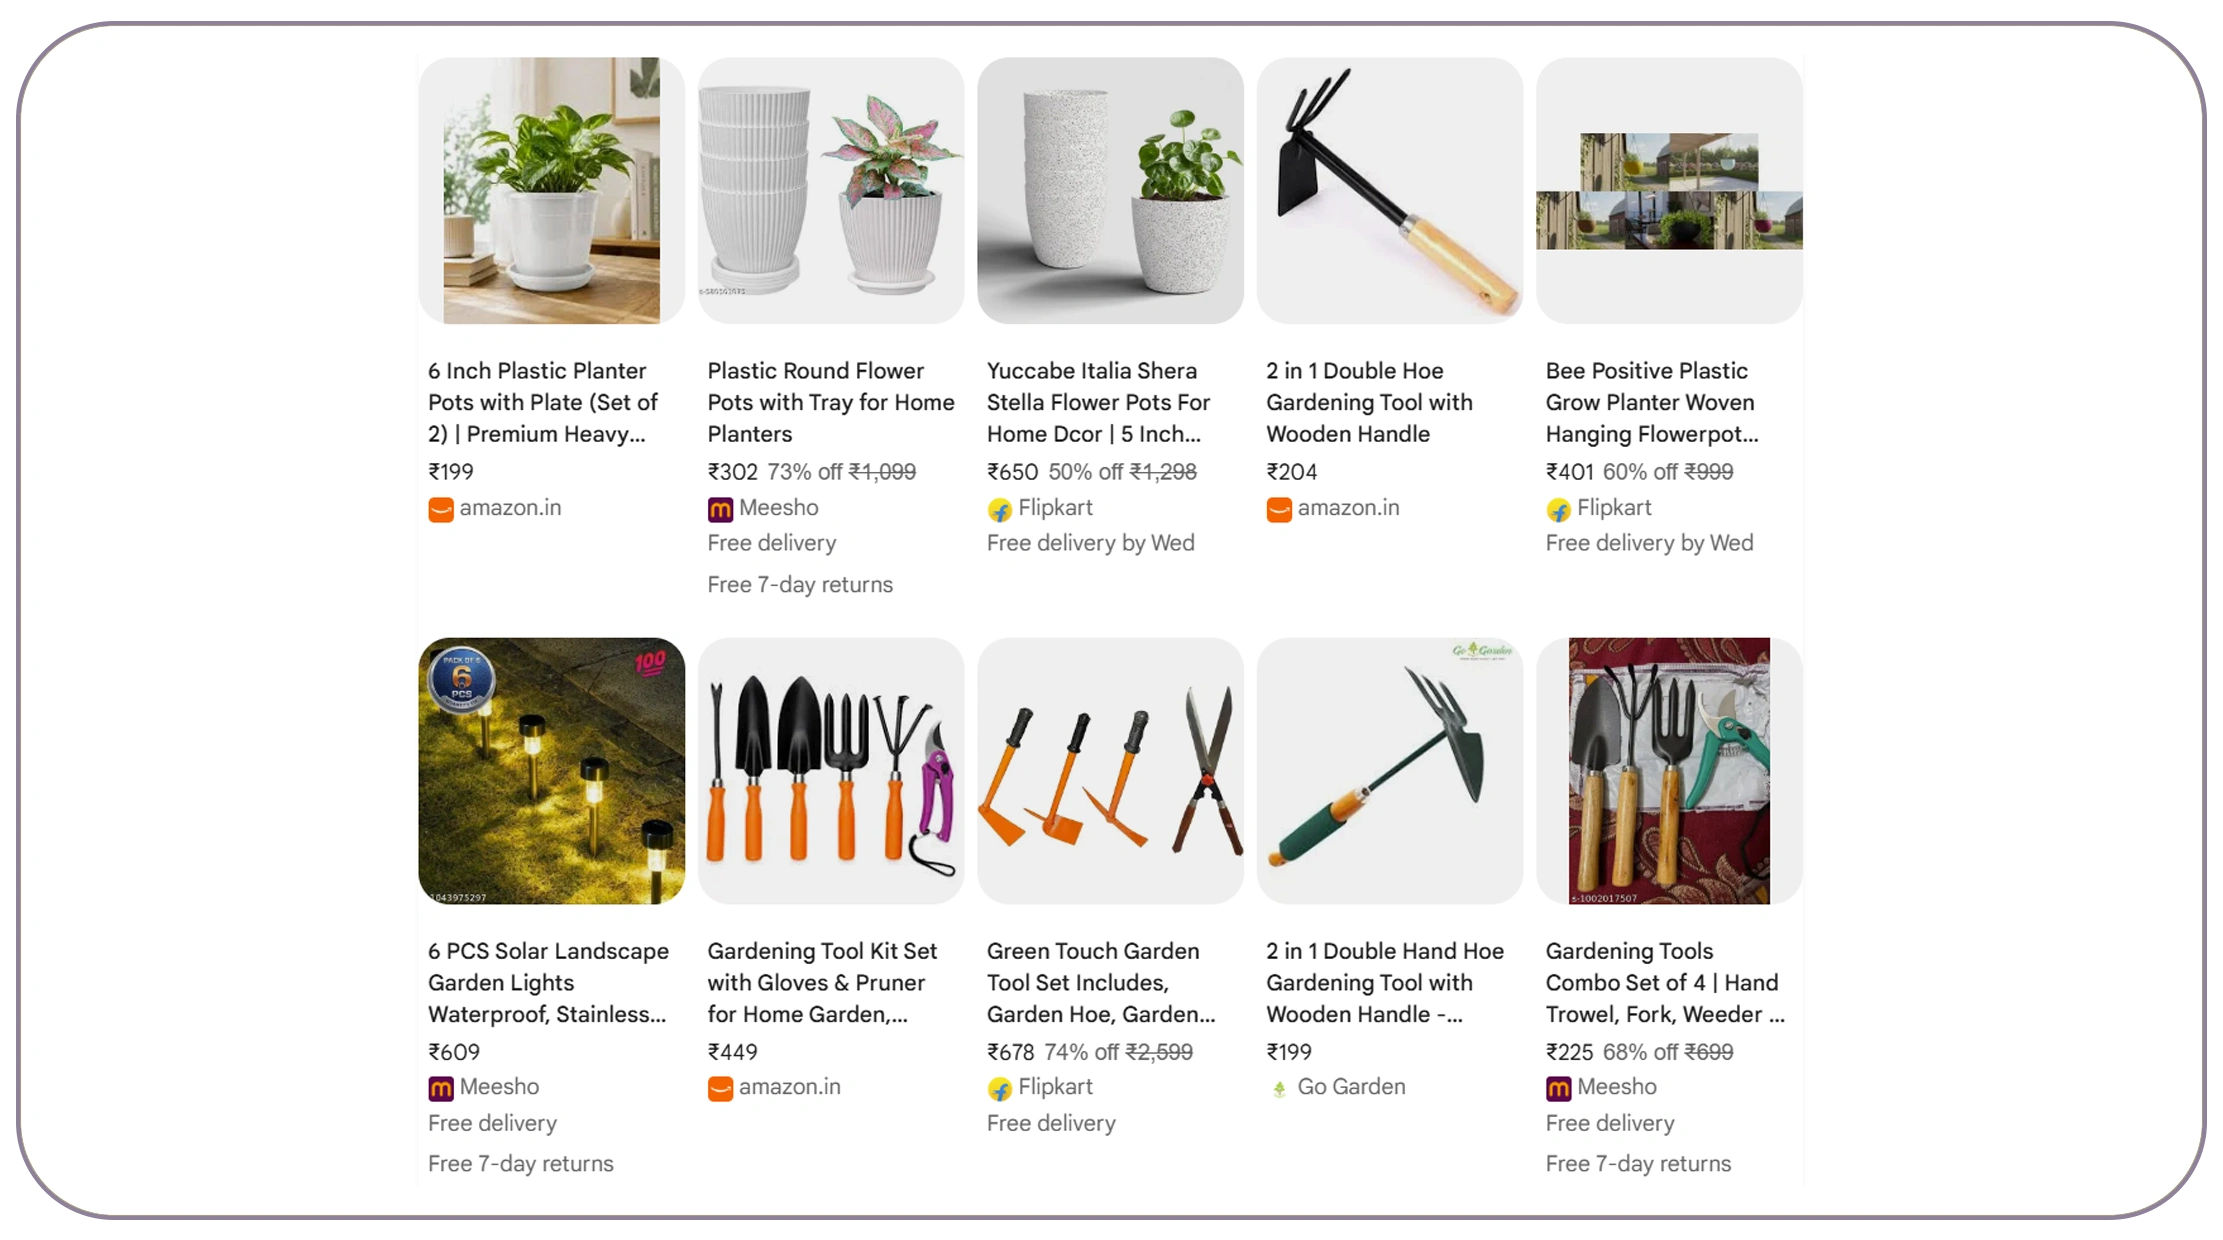
The first challenge in large-scale product research is volume. A business monitoring 50 products manually may manage the workload, but monitoring thousands of products across hundreds of search terms creates a completely different operational requirement.
Businesses can scrape Google Shopping product data using API workflows to automate the repetitive stages of product discovery and collection. The objective is to establish a structured pipeline where search inputs are converted into consistent product records that can be stored and analyzed.
The shift toward digital retail makes this increasingly relevant. U.S. electronic shopping and mail-order houses generated $891.1 billion in sales in 2020 and $1.028 trillion in 2021, according to Census Bureau estimates.
| Year | Retail/e-commerce development | Data implication |
|---|---|---|
| 2020 | U.S. e-commerce sales reached $815.4B | Rapid digital shopping adoption |
| 2021 | Electronic shopping sales reached $1.028T | Larger product-data volumes |
| 2022 | Electronic shopping sales reached $1.117T | Greater competitive visibility |
| 2023 | Digital commerce remained a major channel | More product benchmarking |
| 2024 | Retail analytics became increasingly data-led | Higher automation needs |
| 2025 | Product discovery continued shifting online | More frequent monitoring |
| 2026 | Digital retail remains a core channel | Scalable intelligence infrastructure |
A reliable collection architecture should separate extraction from processing. Raw results can first be captured, then normalized into fields such as product title, brand, price, seller, rating, review count, availability, product URL, search position, and timestamp.
This separation makes the system easier to maintain. If a field changes or a new attribute becomes important, the processing layer can be updated without rebuilding the entire data pipeline.
Data quality should also be treated as a measurable process. Duplicate detection, missing-value checks, price-format normalization, URL validation, and timestamping can significantly improve downstream analysis.
For large catalogs, businesses should also prioritize incremental collection. Instead of repeatedly processing every product, workflows can focus on products or search terms that require refreshes. This reduces unnecessary processing and makes frequent monitoring more practical.
The result is a scalable approach that balances collection volume with data quality.
How Can Product Prices Be Captured for Competitive Benchmarking?
Price monitoring becomes difficult when products appear across multiple sellers, categories, and search queries. Prices may also change independently of product descriptions, meaning a dataset that is accurate today can become outdated quickly.
Businesses can extract Google Shopping product prices with API workflows and associate each observation with a timestamp, seller, product, and search context. This allows analysts to distinguish current prices from historical observations.
Google Merchant Center itself provides pricing and competitive insights for eligible merchants, showing that price-related intelligence is already an important part of product analytics.
| Year | Market context | Pricing intelligence requirement |
|---|---|---|
| 2020 | E-commerce acceleration | Establish baseline pricing |
| 2021 | Strong online retail growth | Expand competitor coverage |
| 2022 | $1.117T U.S. electronic-shopping sales | Increase price monitoring |
| 2023 | Competitive digital retail | Track seller-level differences |
| 2024 | More structured merchant analytics | Improve price benchmarking |
| 2025 | Greater product comparison | Increase refresh frequency |
| 2026 | Data-driven retail operations | Support automated price intelligence |
A useful pricing dataset should capture more than the numerical price. Relevant fields can include:
- Product title
- Brand
- Seller
- Current price
- Original price, where displayed
- Discount information
- Currency
- Rating
- Review count
- Availability
- Search query
- Position or placement
- Collection timestamp
This allows businesses to calculate metrics such as minimum observed price, median seller price, discount depth, seller count, and price variance.
For example, if ten sellers offer comparable products, a business can identify the lowest and highest observed prices and calculate the spread. Repeating the measurement over time creates a historical pricing series.
Price normalization is equally important. Currency, decimal formatting, pack sizes, and product variants can make apparently similar products difficult to compare. A robust workflow should therefore normalize these fields before calculating competitive metrics.
The result is a pricing dataset that supports more than simple price checking. It can reveal seller positioning, promotional behavior, product competitiveness, and category-level pricing patterns.
How Can Businesses Monitor Product Changes More Frequently?
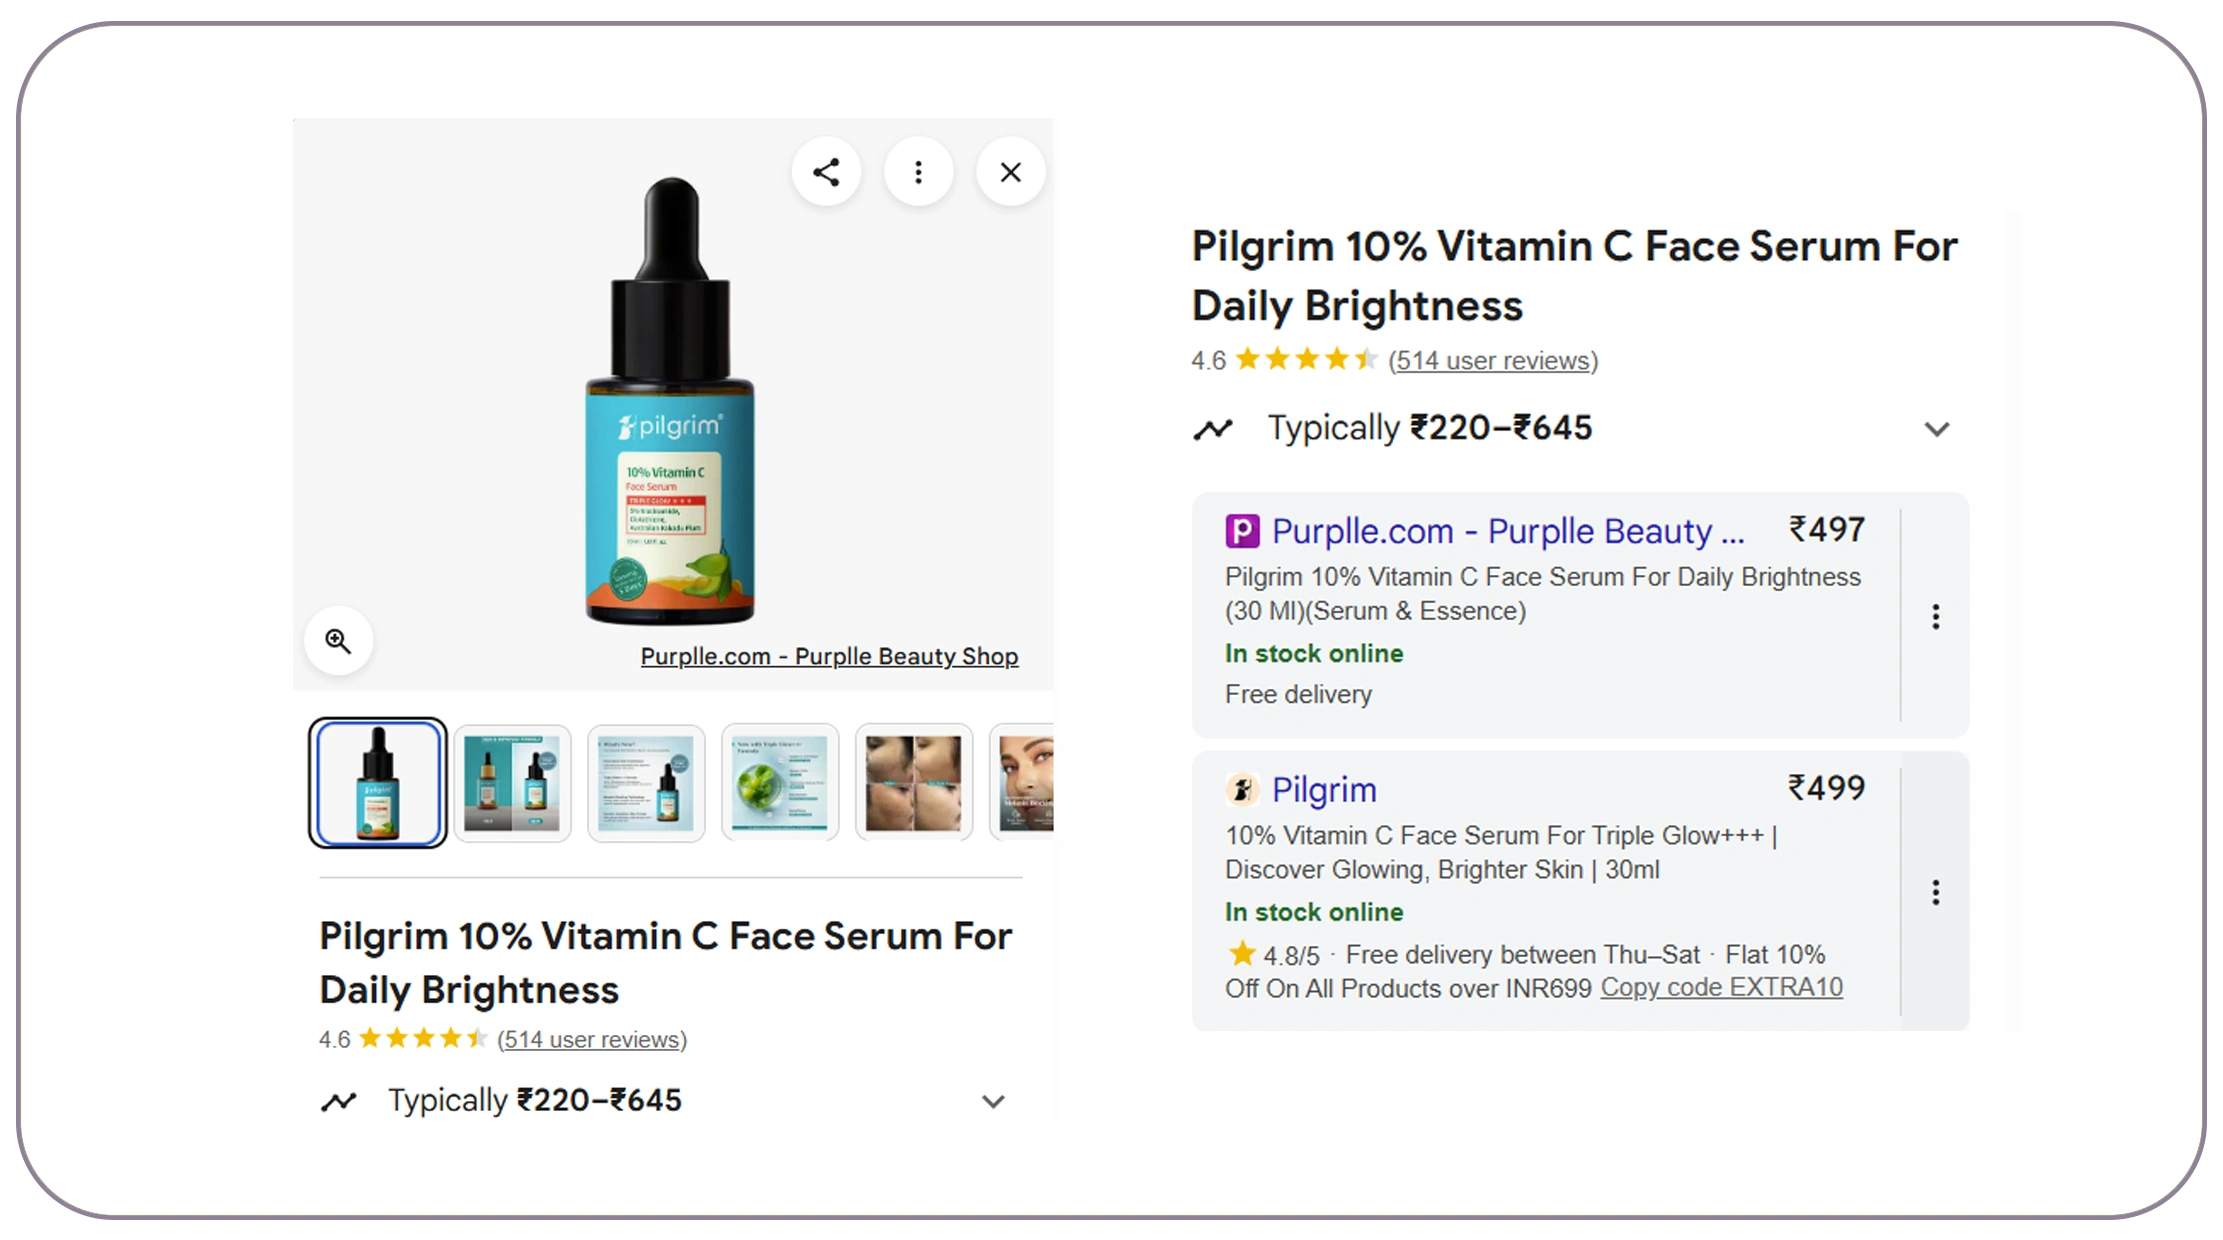
Large-scale product monitoring becomes challenging when businesses need frequent updates rather than occasional snapshots. Products can appear or disappear, sellers can change, prices can move, and availability can fluctuate.
A Real-time web data scraper for Google Shopping Products can support frequent collection workflows when the business requires near-real-time or scheduled observations. However, "real-time" should be defined according to the use case: some businesses need minute-level updates, while others only need daily or weekly refreshes.
Google Merchant Center analytics allows eligible retailers to review product and brand trends over periods extending up to two years for certain reports. This demonstrates the value of retaining historical product observations rather than treating every collection as an isolated event.
| Year | Monitoring maturity | Practical use |
|---|---|---|
| 2020 | Manual snapshots | Basic market research |
| 2021 | Scheduled collection | Regular benchmarking |
| 2022 | Automated workflows | Catalog monitoring |
| 2023 | Historical comparison | Trend identification |
| 2024 | Advanced analytics | Competitive intelligence |
| 2025 | Higher-frequency collection | Dynamic pricing research |
| 2026 | Automated alerts | Faster market response |
A practical monitoring architecture can use different refresh frequencies by product importance.
- High-priority products: frequent refreshes for prices and availability.
- Medium-priority products: daily or several-times-per-week collection.
- Long-tail products: weekly or monthly refreshes.
This tiered model prevents businesses from wasting resources on low-value records while maintaining stronger coverage of strategically important products.
Change detection can add another layer of efficiency. Instead of simply storing every observation, the system can identify meaningful changes such as price movement, seller changes, availability updates, or new product appearances.
These events can then feed dashboards, alerts, or internal analytics systems.
The key is to design collection frequency around business decisions rather than collecting everything at maximum frequency.
Need scalable product monitoring? Real Data API can help businesses build structured product-data workflows for pricing, assortment, and competitive intelligence.
Get Insights Now!What Makes Automated Collection More Efficient Than Manual Research?
Manual product research can be useful for small investigations, but it becomes inefficient when the number of search terms, products, sellers, and locations increases.
Data collection services for Google Shopping product data can automate repetitive collection while giving businesses a consistent structure for processing and storing results.
The U.S. Census Bureau reported that electronic shopping and mail-order houses generated $1.117 trillion in sales in 2022, illustrating the scale of the digital retail environment businesses are analyzing.
| Year | Digital retail signal | Collection challenge |
|---|---|---|
| 2020 | E-commerce surged 43% | Sudden increase in product demand |
| 2021 | Online sales continued expanding | Larger product coverage |
| 2022 | E-commerce sales surpassed $1.1T | Greater competitive complexity |
| 2023 | Multi-channel retail matured | More seller comparisons |
| 2024 | Product analytics expanded | Higher data expectations |
| 2025 | More digital product discovery | More frequent collection |
| 2026 | Automated intelligence becomes strategic | Need for scalable infrastructure |
An automated pipeline can perform several tasks consistently:
- Receive search queries or product inputs.
- Collect relevant product results.
- Extract predefined fields.
- Normalize prices and product attributes.
- Validate records.
- Remove duplicates.
- Timestamp observations.
- Store structured outputs.
- Feed dashboards or analytics systems.
This approach also creates repeatability. An analyst manually collecting products may make different decisions each time. An automated workflow applies the same extraction and validation logic consistently.
Businesses should nevertheless establish clear data-quality rules. For example, a product record without a title or price may need to be flagged rather than silently inserted into the main dataset.
Another important practice is maintaining provenance. Search query, timestamp, source context, and product URL can help analysts understand where an observation originated.
The result is a more transparent and manageable product-data pipeline.
How Can Shopping Data Become Competitive Intelligence?
Collecting product records is valuable, but the ultimate objective is to understand what the data means for the business.
Businesses can Scrape Google Shopping Insights Data to evaluate competitive positioning, product visibility, pricing patterns, seller activity, and assortment changes, subject to applicable access rights and platform terms.
Google's own Merchant Center analytics provides retailers with product popularity, trend, pricing, and competitor-related insights.
| Year | Intelligence focus | Business question |
|---|---|---|
| 2020 | Product availability | What products moved online? |
| 2021 | Demand expansion | Which categories grew? |
| 2022 | Seller competition | Who is competing for demand? |
| 2023 | Pricing | Where are price gaps emerging? |
| 2024 | Product popularity | Which products are gaining visibility? |
| 2025 | Competitive positioning | How do sellers differ? |
| 2026 | Automated intelligence | Which changes require action? |
A mature intelligence model can calculate:
- Average observed price
- Price range
- Seller count
- Product availability rate
- Discount frequency
- Rating distribution
- Review-volume differences
- Product-position changes
- New-product appearance
- Discontinued-product signals
These metrics can be combined into category-level dashboards.
For example, a retailer might discover that its product is consistently priced above most observed competitors. That information could trigger a pricing review.
A brand might identify that a competitor has entered a category with a broader assortment. That could influence product-launch planning.
A marketplace operator might observe that a particular seller repeatedly appears for high-value queries. That could indicate strong competitive positioning.
The important distinction is between data collection and decision intelligence. Collection creates the raw material. Normalization, historical comparison, and business rules turn that material into insight.
This is why scalable product data infrastructure should be designed with downstream analytical requirements in mind.
How Can Businesses Build a Reusable Product Intelligence Asset?
The final challenge is making product data useful beyond a single report or analysis. A business that collects millions of product observations but cannot organize or reuse them has created a data-storage problem rather than an intelligence asset.
An E-Commerce Dataset should ideally preserve product identity, seller context, price history, availability, timestamps, and relevant search information.
The Census Bureau's e-commerce statistics program provides downloadable datasets and tables for analyzing electronic commerce, demonstrating the importance of structured historical data for market analysis.
| Year | Dataset priority | Strategic value |
|---|---|---|
| 2020 | Establish historical baseline | Understand disruption |
| 2021 | Expand product coverage | Track digital adoption |
| 2022 | Capture seller competition | Benchmark markets |
| 2023 | Add historical pricing | Identify trends |
| 2024 | Improve product matching | Strengthen comparisons |
| 2025 | Increase refresh frequency | Detect faster changes |
| 2026 | Build reusable intelligence | Support automated decisions |
A reusable dataset should maintain stable product identifiers whenever possible. Where identifiers are unavailable, businesses can use combinations of normalized brand, title, model, size, and other attributes.
Historical storage is particularly valuable because it transforms snapshots into trends.
For example, a single observation may show that a product costs $49.99. A six-month history can reveal whether that price is normal, promotional, seasonal, or unusually high.
The same principle applies to availability. Repeated observations can reveal whether a product is consistently available or frequently disappears from search results.
Businesses can also enrich the dataset with internal information such as product margins, inventory levels, category classifications, or campaign data. This creates a stronger connection between external market intelligence and internal business performance.
The ultimate goal is a reusable data layer that supports pricing, product strategy, competitive intelligence, assortment planning, and market research without requiring a new collection project for every question.
Why Choose Real Data API?
Businesses dealing with large product catalogs need more than isolated extraction scripts. They need infrastructure that can support repeatable collection, structured delivery, scalability, and downstream analytics.
A Web Scraping API approach can provide an integration layer between product-data sources and business applications. Instead of manually running collection workflows, organizations can connect structured data pipelines with dashboards, databases, internal applications, or analytics environments.
For organizations using Google Shopping Scraper API for product data extraction, Real Data API can support a scalable architecture around product research and competitive intelligence requirements.
Key benefits include:
- Scalability: Designed to support expanding query and product volumes.
- Structured outputs: Product attributes can be organized into consistent schemas.
- Automation: Reduce repetitive manual research and recurring collection tasks.
- Historical tracking: Preserve observations for trend analysis.
- Analytics readiness: Deliver data in formats suitable for downstream systems.
- Flexible workflows: Support different refresh frequencies based on business priorities.
- Quality controls: Normalize and validate records before analytical use.
Google's Merchant Center provides eligible businesses with analytics around product performance, popularity, trends, pricing, and competitors. For businesses requiring broader external product intelligence, a dedicated data workflow can complement internal analytics with structured market observations.
The strongest architecture is therefore not simply a scraper. It is a data pipeline connecting collection, validation, storage, analytics, and business decisions.
Conclusion
Large-scale product monitoring becomes difficult when businesses depend on manual searches, inconsistent records, and disconnected spreadsheets. A well-designed Google Shopping Scraper API for product data extraction workflow can address these problems by automating collection, standardizing product information, maintaining historical observations, and supporting scalable competitive intelligence.
The growth of e-commerce since 2020 demonstrates why this capability matters. U.S. e-commerce sales increased 43% in 2020, while electronic shopping and mail-order sales reached $1.117 trillion in 2022. By 2026, businesses increasingly need product intelligence that is not only comprehensive but also timely and reusable.
The practical solution is to build a pipeline around clear business priorities: identify the products that matter, select appropriate refresh frequencies, normalize product and pricing attributes, validate records, preserve history, and convert changes into actionable metrics.
Connect with Real Data API to build a scalable product-data workflow for pricing intelligence, competitive analysis, and e-commerce research!
FAQs
1. What is the Google Shopping Scraper API used for?
The Google Shopping Scraper API for product data extraction helps businesses collect structured product information such as prices, sellers, ratings, availability, and product details at scale.
2. How can businesses collect Google Shopping product information?
Businesses can scrape Google Shopping product data using API workflows to automate product collection, standardize records, and support competitive pricing and assortment analysis.
3. How can businesses monitor Google Shopping prices?
Companies can extract Google Shopping product prices with API solutions to capture pricing observations, compare sellers, track changes, and build historical pricing datasets for market analysis.
4. Why use automated Google Shopping data collection?
A Real-time web data scraper for Google Shopping Products can help businesses monitor changing product information, pricing, seller activity, and availability according to their required refresh frequency.
5. How can collected product data support e-commerce analysis?
A structured E-Commerce Dataset can help retailers and brands analyze products, sellers, prices, availability, and competitive movements while supporting dashboards, research, and strategic decision-making.
Latest posts
Keeta scraper for monitoring food marketplace trends - Identify Discount Changes and Emerging Customer Demand
How to build a structured Nike product dataset for Product Intelligence and Retail Analytics
Allegro scraper for competitor price monitoring – How to Track Product Prices and Stay Ahead of Competitors
Ocado API data collection services for retailers - Track Competitor Prices and Deals






.png)



