TL;DR
- GrabFood Food Dataset helps restaurants, food brands, aggregators, and market researchers organize restaurant, menu, pricing, rating, and delivery information for structured analysis.
- GrabFood Scraper workflows can convert publicly accessible marketplace information into historical datasets that support competitor monitoring, menu research, pricing intelligence, and delivery analysis.
- From 2020–2026, Southeast Asia's food-delivery market experienced major behavioral and operational changes, making structured restaurant data increasingly valuable for businesses seeking timely market intelligence.
Introduction
GrabFood Food Dataset helps businesses analyze restaurant listings, menu structures, prices, ratings, availability, and delivery-related information in a structured format. Instead of manually checking thousands of restaurant pages, analysts can work with standardized records that make restaurant comparison, pricing research, menu analysis, and historical monitoring more efficient.
The shift toward digital food delivery accelerated sharply during 2020. Grab reported that estimated food-delivery expenditure across six Southeast Asian markets was approximately US$9.4 billion in 2020. By 2021, Grab reported US$8.5 billion in deliveries GMV, up 56% year over year, while average delivery order values had increased 41% compared with 2019.
A GrabFood Scraper can support the collection of publicly accessible restaurant and menu information, subject to website accessibility, applicable terms, and data-use requirements. Depending on the source, fields may include restaurant name, location, cuisine, menu item, price, rating, review count, availability, delivery information, and collection timestamp.
For restaurant chains, food brands, delivery-market researchers, investors, and data teams, the main challenge is not simply gathering information. It is making data consistent, comparable, historical, and useful for decision-making.
How Can Restaurant-Level Data Improve Competitive Research?
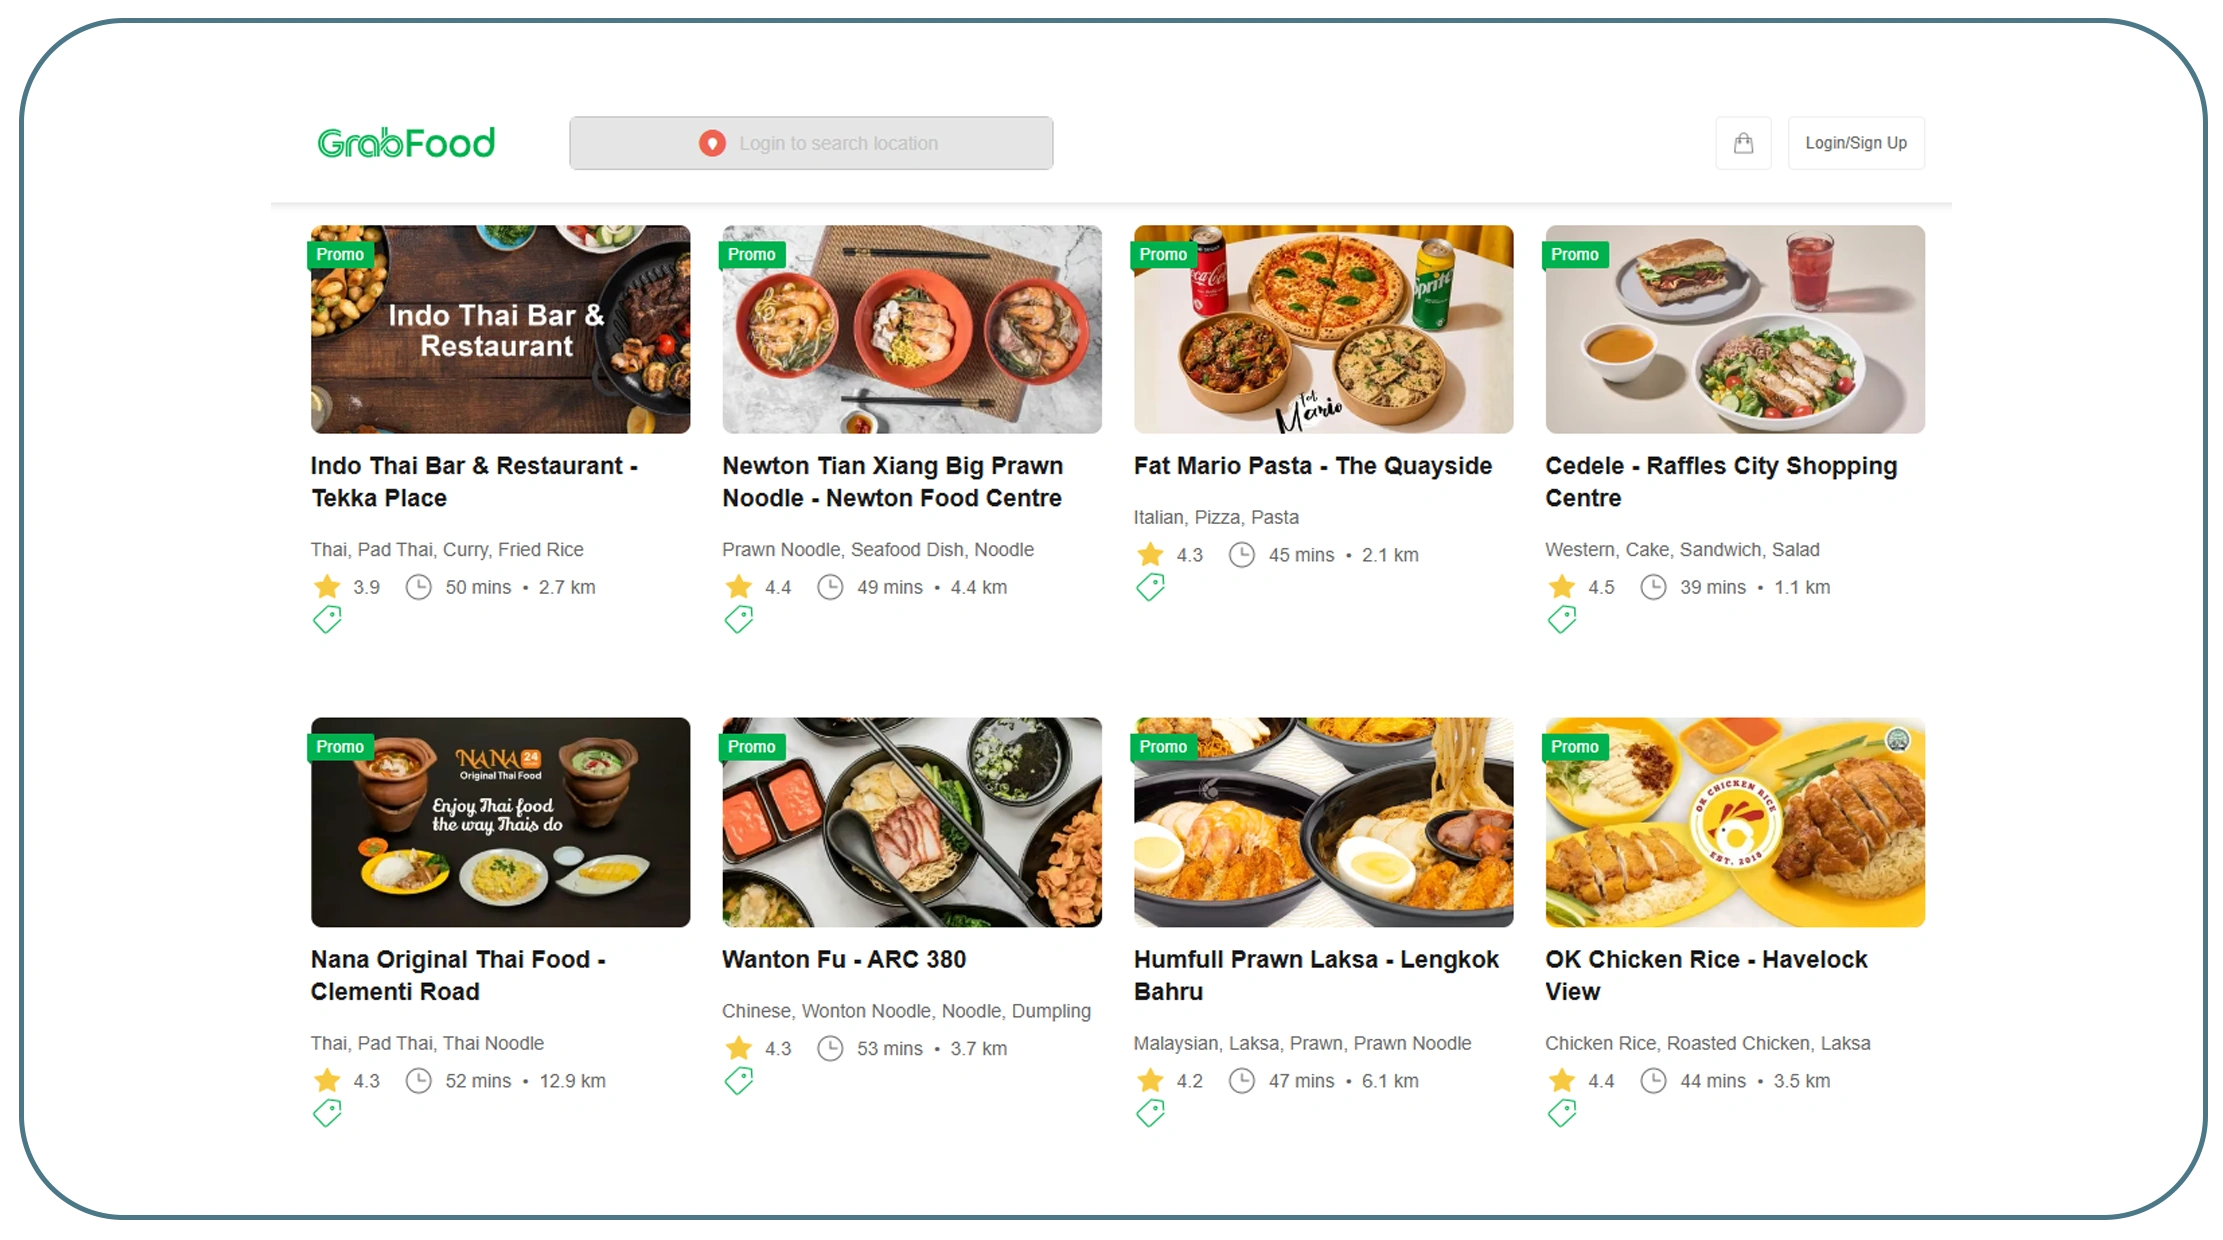
Scrape GrabFood restaurant data to create a structured view of restaurant presence, cuisine categories, geographic coverage, ratings, and marketplace positioning. This can help businesses move from manual restaurant discovery toward systematic competitive research.
Restaurant-level information can be organized around several dimensions. Location identifies where a restaurant operates, cuisine reveals its market segment, ratings provide a customer-feedback signal, and availability shows whether a listing is currently visible to consumers.
Core Restaurant Intelligence Fields
| Data Attribute | Business Application |
|---|---|
| Restaurant name | Competitor identification |
| Location | Geographic mapping |
| Cuisine | Segment analysis |
| Rating | Customer perception analysis |
| Review count | Review-volume comparison |
| Delivery availability | Coverage analysis |
| Menu count | Assortment comparison |
| Price range | Restaurant positioning |
| Timestamp | Historical monitoring |
The 2020–2026 period demonstrates why restaurant intelligence became increasingly important. During the pandemic, food delivery shifted from a convenience channel to an essential ordering mechanism in many Southeast Asian markets. Grab's 2022 research found that seven in ten Southeast Asian consumers considered deliveries a permanent part of their lifestyles.
Grab also reported that consumers ordered food deliveries 1.48 times more frequently in 2022 than in 2019. This indicates that restaurant discovery and ordering behavior had changed beyond the initial pandemic period.
For market researchers, historical restaurant datasets can reveal changes in geographic coverage, restaurant density, cuisine mix, and competitive intensity. A business entering a new city, for example, can use structured restaurant information to identify heavily represented cuisine categories and areas with fewer competing listings.
Restaurant data can also be combined with menu and price information. A restaurant with a high rating but a narrow menu may compete differently from a large chain offering hundreds of items across multiple categories. The actionable insight comes from connecting these fields rather than examining them independently.
What Menu Information Can Reveal About Food-Market Positioning?
Extract GrabFood menu information to understand what restaurants sell, how their menus are structured, and how products are priced within specific cuisines or categories.
Menu analysis becomes more valuable when individual items are normalized into consistent fields. A dataset might distinguish item name, category, description, size, price, promotional price, dietary attribute, availability, and restaurant.
Example Menu Dataset Structure
| Menu Field | Research Use |
|---|---|
| Restaurant | Establishment-level comparison |
| Item name | Product identification |
| Category | Menu segmentation |
| Description | Attribute analysis |
| Price | Price benchmarking |
| Size/portion | Value comparison |
| Availability | Menu monitoring |
| Promotion | Promotional analysis |
| Cuisine | Market segmentation |
| Timestamp | Historical comparison |
The 2020–2026 period produced substantial changes in food-ordering behavior. Grab's 2022 regional research found that average GrabFood basket size was 18% higher than in 2019, while overall food and grocery delivery expenditure increased 1.3 times between 2021 and 2022.
The same research identified changing preferences around healthy meals, snacks, sharing plates, and plant-based alternatives. Grab reported that demand for healthy meals had increased by at least two times across the region in the period covered by its 2022 report.
These trends demonstrate why menu datasets can support more than basic catalog monitoring.
A restaurant operator can examine how competitors structure their menus, which categories contain the greatest number of items, and how prices vary across comparable dishes. A food manufacturer can investigate which product categories appear frequently across restaurants. A market researcher can identify menu expansion or contraction over time.
Historical menu data can also help separate temporary promotions from persistent pricing structures. If a dish appears at a promotional price for one week and returns to its previous level, the change can be classified differently from a permanent menu-price revision.
For AI and analytics workflows, standardized menu records are particularly valuable because they make restaurant information easier to query, summarize, categorize, and compare.
How Can Price Intelligence Help Restaurants and Food Brands?
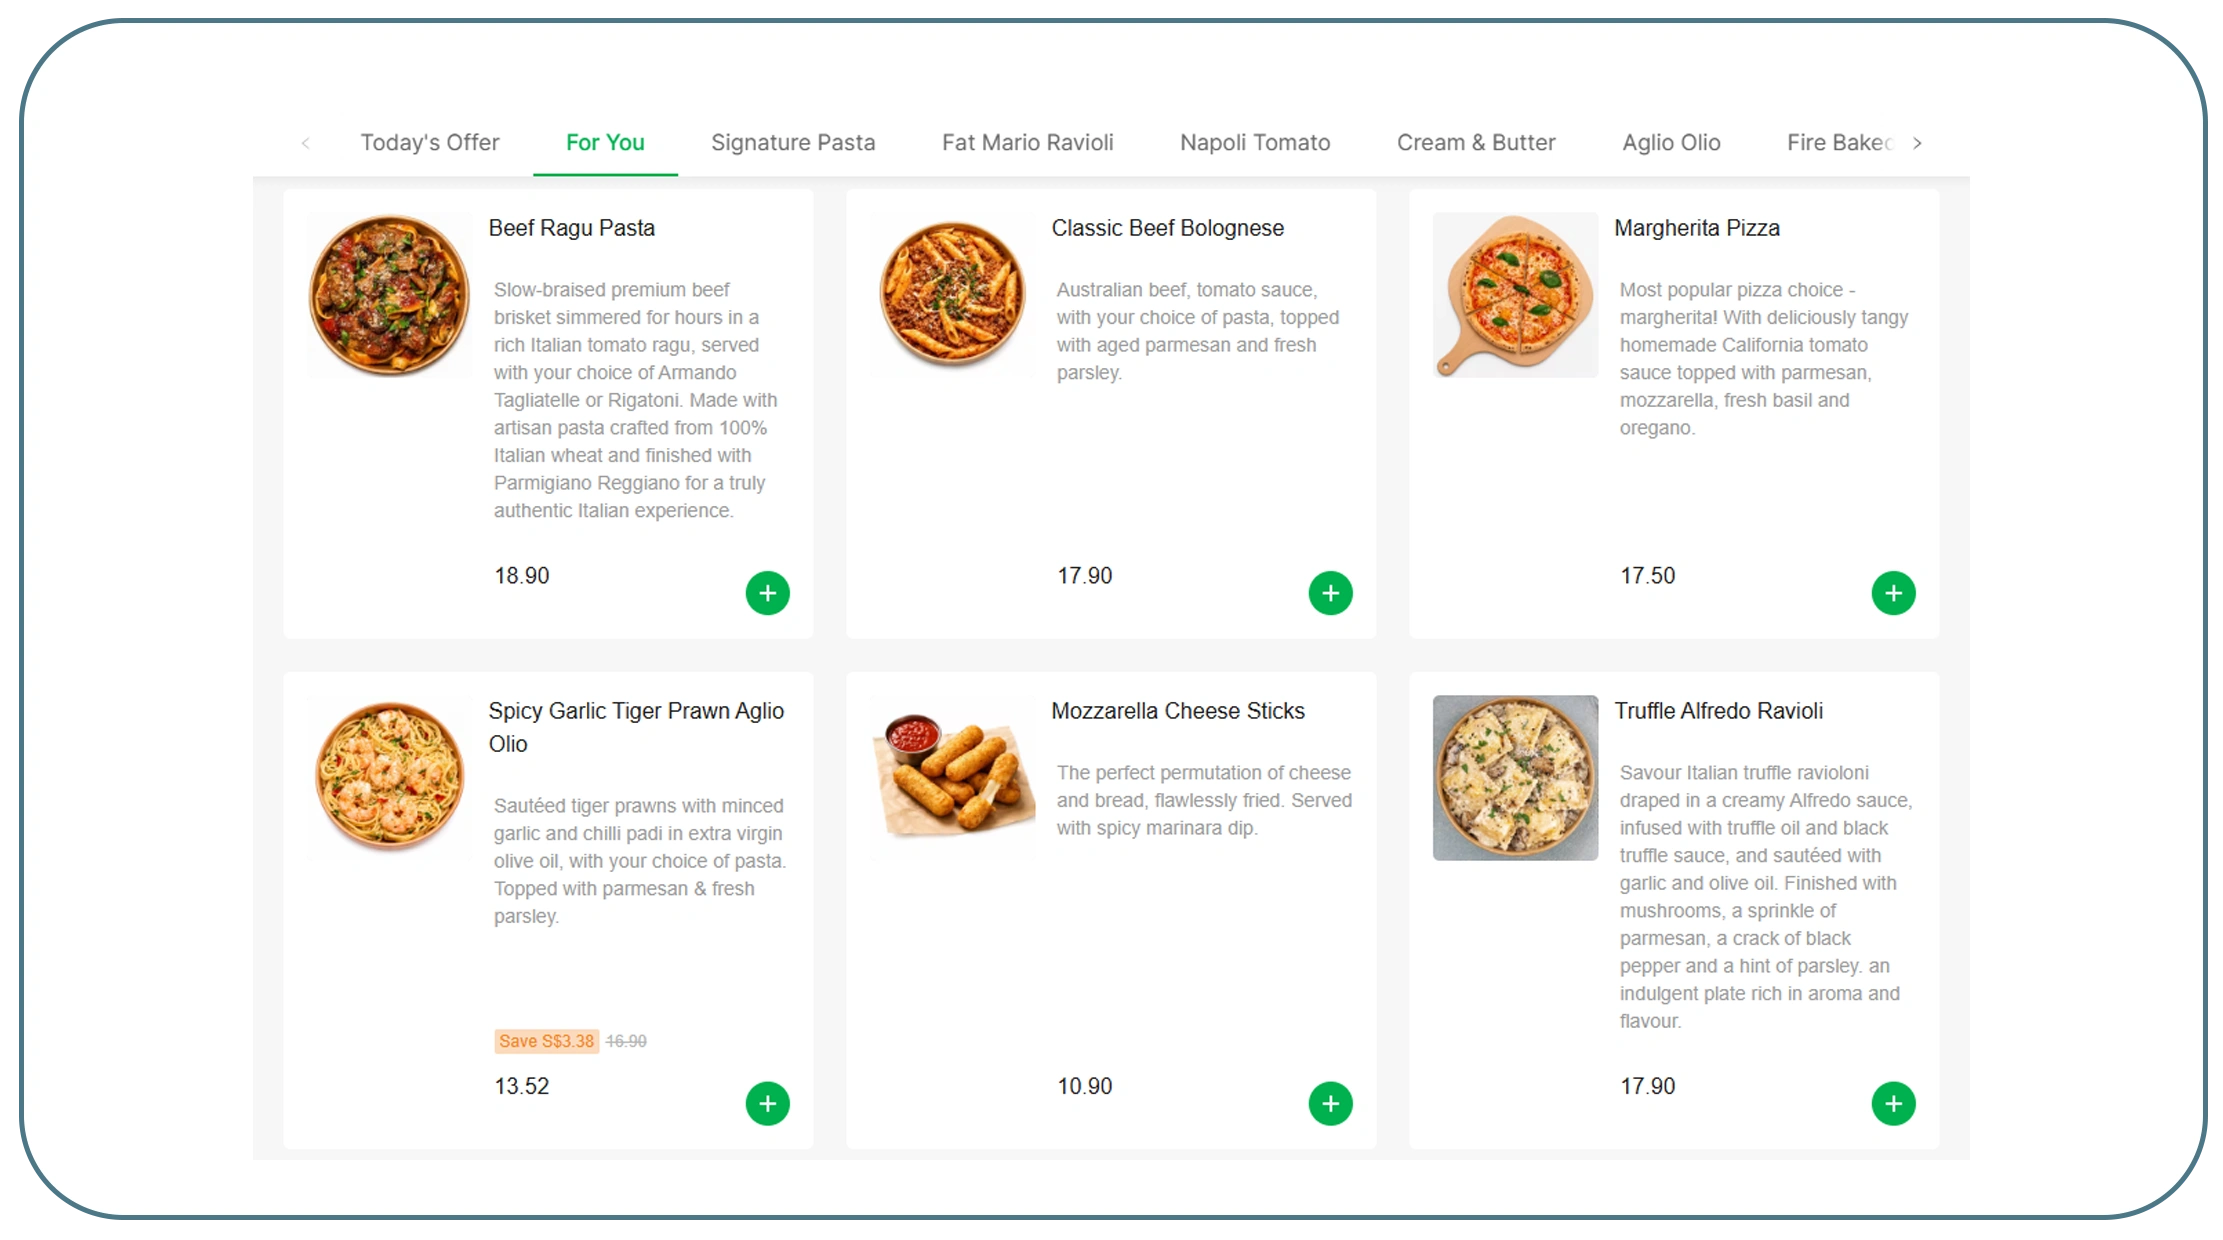
GrabFood food price data extraction provides a structured basis for studying menu prices, promotional patterns, category-level pricing, and restaurant positioning.
Food prices can vary based on cuisine, location, restaurant type, portion size, ingredients, promotions, and delivery-market conditions. Comparing raw prices without considering these variables can produce misleading conclusions.
A useful pricing dataset therefore connects price with item identity and contextual information.
Pricing Intelligence Framework
| Metric | Potential Insight |
|---|---|
| Listed price | Current menu positioning |
| Promotional price | Discount activity |
| Price range | Restaurant pricing structure |
| Category median | Benchmarking |
| Portion size | Value comparison |
| Cuisine | Segment-level analysis |
| Location | Geographic pricing differences |
| Timestamp | Historical price movement |
Grab reported that its deliveries GMV reached US$8.5 billion in 2021, a 56% year-over-year increase. In 2022, Grab reported that delivery GMV grew 24% year over year across the region in its consumer trends reporting.
These aggregate figures do not represent individual restaurant prices, but they provide context for the growing scale of delivery activity.
From 2020 to 2026, price intelligence increasingly became a multivariable problem. Businesses need to understand not only whether a dish became more expensive but also whether portion size, promotions, restaurant positioning, or local competition changed at the same time.
For example, a restaurant may list a burger at a higher price than competitors but include a larger portion or additional components. A basic price comparison would miss this distinction.
A structured dataset allows analysts to create more meaningful comparisons. Menu items can be grouped by category, portion, restaurant type, cuisine, and geographic market before price distributions are calculated.
Historical price observations can additionally reveal seasonal promotions and recurring campaign periods. This is particularly useful for food brands and restaurant chains planning promotions or reviewing competitor activity.
Build a structured food-pricing intelligence workflow to monitor restaurant prices, menu changes, promotions, ratings, and market movements across target locations.
Get Insights Now!How Can Recurring Restaurant Monitoring Improve Market Coverage?
GrabFood restaurant data collection services can help businesses establish recurring workflows instead of relying on occasional manual research.
A recurring collection process can capture restaurant listings at scheduled intervals and store changes over time. This makes it possible to identify newly listed restaurants, changed ratings, updated menus, price movements, and availability changes.
Recurring Monitoring Model
| Monitoring Area | What Can Be Tracked |
|---|---|
| Restaurants | New and existing listings |
| Menus | Added or removed dishes |
| Prices | Price movements |
| Ratings | Rating changes |
| Reviews | Review-volume changes |
| Availability | Listing status |
| Location | Geographic expansion |
| Delivery | Service coverage |
The evolution from 2020 to 2026 makes recurring monitoring particularly relevant. Grab reported operating in more than 500 cities across eight Southeast Asian countries in 2022. By 2024, Grab reported that its platform served more than 800 cities across eight Southeast Asian countries.
The increase in geographic coverage creates a larger observation set for businesses studying restaurant markets.
A one-time dataset may identify restaurants operating in a city today. Recurring collection can reveal which restaurants entered the marketplace, which disappeared, which changed categories, and how their menus evolved.
For restaurant chains, this can support expansion research. A brand can compare the number and type of competitors in different locations before entering a new market.
For food manufacturers, restaurant-level data can provide contextual information about menu demand. For example, repeated appearances of specific cuisine categories or ingredient-related menu concepts may warrant additional research.
The key is consistency. Each collection should follow a standardized schema so historical records remain comparable.
Data validation is also important. Restaurant names can change, categories may be reorganized, and duplicate listings can appear. Entity matching and normalization can reduce these problems and improve the quality of longitudinal analysis.
How Can a Structured Dataset Support Long-Term Restaurant Intelligence?
GrabFood Dataset can act as a historical foundation for analyzing restaurants, menus, prices, ratings, and delivery activity across multiple collection periods.
A high-quality dataset should preserve both current observations and historical records. Each observation should ideally include a timestamp so analysts can reconstruct what was visible at a particular point in time.
Recommended Data Architecture
| Data Layer | Example Fields |
|---|---|
| Restaurant | Name, ID, location |
| Classification | Cuisine, category |
| Menu | Item, description, category |
| Pricing | Price, promotional price |
| Reputation | Rating, review count |
| Availability | Open/closed, item availability |
| Delivery | Delivery-related fields |
| Source | URL/reference |
| Temporal | Date and timestamp |
Grab's historical reporting shows how rapidly the digital delivery environment changed. In 2020, Grab announced the expansion of GrabMart into eight Southeast Asian countries and 50 cities within three months, illustrating how quickly its broader delivery ecosystem was scaling during the pandemic.
In 2021, Grab reported more than two million registered merchant-partners across its food-delivery network. By 2024, the company reported operating across more than 800 cities in eight Southeast Asian countries.
These milestones illustrate why longitudinal datasets are useful. Market researchers can study geographic expansion, restaurant participation, menu diversity, and changing consumer-facing offerings rather than relying on a single snapshot.
A structured dataset can also feed business intelligence dashboards. Analysts can calculate restaurant counts by location, average prices by cuisine, rating distributions, menu-size changes, and new-listing rates.
For machine-learning and AI workflows, structured records provide additional advantages. Consistent fields make classification, entity matching, trend detection, and natural-language querying easier.
For example, an analyst could ask a data system to identify restaurants within a particular cuisine and location whose ratings increased over a defined period. Such questions require structured historical records rather than isolated screenshots or manually maintained notes.
How Can Delivery Marketplace Websites Expand Food-Market Research?
Extract GrabFood Delivery Websites workflows can support research into restaurant marketplaces and digital food-delivery ecosystems when data is publicly accessible and collection complies with applicable terms and requirements.
The objective should be broader than simply copying restaurant pages. A useful workflow establishes a repeatable process for identifying entities, extracting relevant fields, validating records, and storing historical observations.
- Source identification: Identify relevant publicly accessible marketplace pages.
- Restaurant discovery: Capture restaurant listings and location information.
- Menu extraction: Collect available menu categories and item attributes.
- Price normalization: Standardize price fields and promotional formats.
- Rating capture: Record ratings and available review metrics.
- Validation: Check missing, duplicate, or inconsistent fields.
- Timestamping: Attach collection dates to every observation.
- Storage: Maintain historical records for longitudinal analysis.
- Analytics: Connect datasets with dashboards or internal systems.
The 2020–2026 period shows that delivery behavior became deeply integrated into everyday consumer routines. Grab's 2022 research found that seven in ten surveyed Southeast Asian consumers considered delivery a permanent part of their lifestyles.
The same research found that GrabFood consumers ordered food 1.48 times more frequently in 2022 than in 2019.
This creates opportunities for data-driven analysis across restaurant supply and consumer-facing marketplace information.
For a restaurant chain, delivery-marketplace data can help compare its digital presence with competing restaurants. For a market research company, it can provide structured inputs for regional food-market studies. For food-tech companies, it can support category mapping and marketplace intelligence.
However, delivery data should be interpreted carefully. A marketplace listing does not necessarily represent actual sales volume, and a visible menu does not prove that an item was ordered. These distinctions should remain explicit in analytical reports.
The strongest approach combines marketplace observations with other available business, consumer, and market indicators.
Why Choose Real Data API?
Businesses researching food-delivery markets need data that is structured, consistent, scalable, and suitable for recurring analysis. Food Data Scraping can support the transformation of publicly accessible restaurant and menu information into organized datasets for competitive intelligence, market research, pricing analysis, and trend monitoring.
Real Data API can help businesses build workflows around:
- Restaurant discovery and monitoring
- Menu and item-level collection
- Price tracking
- Rating and review metrics
- Location-level analysis
- Availability monitoring
- Historical datasets
- Data normalization
- Scheduled collection
- Analytics-ready delivery
For restaurant chains, this can reduce manual marketplace research. For food brands, it can create a broader view of menu placement and pricing. For researchers, structured records can make longitudinal comparisons easier.
A strong implementation should also prioritize data validation and historical consistency. Restaurant names, categories, menus, and prices can change frequently, so datasets need clear timestamps and standardized fields.
Real Data API can also support customized schemas based on a buyer's requirements. A restaurant chain may prioritize competitors and locations, while a food manufacturer may require cuisine, menu-item, and price-level information.
The objective is to create data that can move directly into dashboards, spreadsheets, databases, analytics platforms, or machine-learning workflows.
Conclusion
The growth of digital food delivery from 2020 through 2026 has created a large and constantly changing marketplace for restaurants, food brands, and consumers. Grab reported that delivery GMV grew 56% in 2021 to US$8.5 billion, while its 2022 consumer research showed that delivery had become a permanent habit for many Southeast Asian consumers.
A GrabFood Food Dataset gives businesses a structured way to examine restaurant listings, menus, prices, ratings, availability, and delivery-related signals. Historical collection adds another layer by showing how these attributes change over time.
For restaurant chains, food brands, market researchers, and food-tech teams, the greatest value comes from connecting restaurant, menu, price, and geographic information into one consistent analytical framework.
Contact Real Data API to build a customized food-delivery data solution for restaurant intelligence, menu analysis, price monitoring, ratings research, and delivery-market insights!
FAQs
What is a GrabFood Food Dataset?
A GrabFood Food Dataset is a structured collection of restaurant, menu, price, rating, availability, location, and delivery-related information gathered for food-market research and analysis.
How does a GrabFood Scraper support restaurant research?
A GrabFood Scraper can collect publicly accessible restaurant and menu information at scale, helping businesses organize listings, prices, ratings, categories, availability, and timestamps for analysis.
What is included in a GrabFood Dataset?
A GrabFood Dataset may include restaurant names, locations, cuisine types, menu items, prices, ratings, review counts, availability, URLs, and historical collection timestamps.
Can businesses Extract GrabFood Delivery Websites data for analysis?
Yes, Extract GrabFood Delivery Websites workflows can organize publicly accessible marketplace information for restaurant, menu, price, and delivery research, subject to applicable access conditions and terms.
Why is Food Data Scraping useful for delivery-market intelligence?
Food Data Scraping helps businesses structure restaurant and menu information at scale, making it easier to compare prices, categories, ratings, availability, and market changes over time.
Latest posts

How Prada Fashion Dataset Helps Businesses Track Luxury Products, Prices, Categories, and Fashion Trends for Better Market Insights
How Snapdeal E-commerce Dataset Helps Analyze Products, Prices, Sellers, and Marketplace Trends?
.webp)
How Uniqlo Fashion Dataset Helps Analyze Products, Prices, Categories, and Apparel Trends?

How Travel Dataset Solves Destination Intelligence Gaps with Flights, Hotels, Prices, Destinations, and Travel Market Trends







.png)



