
TL;DR
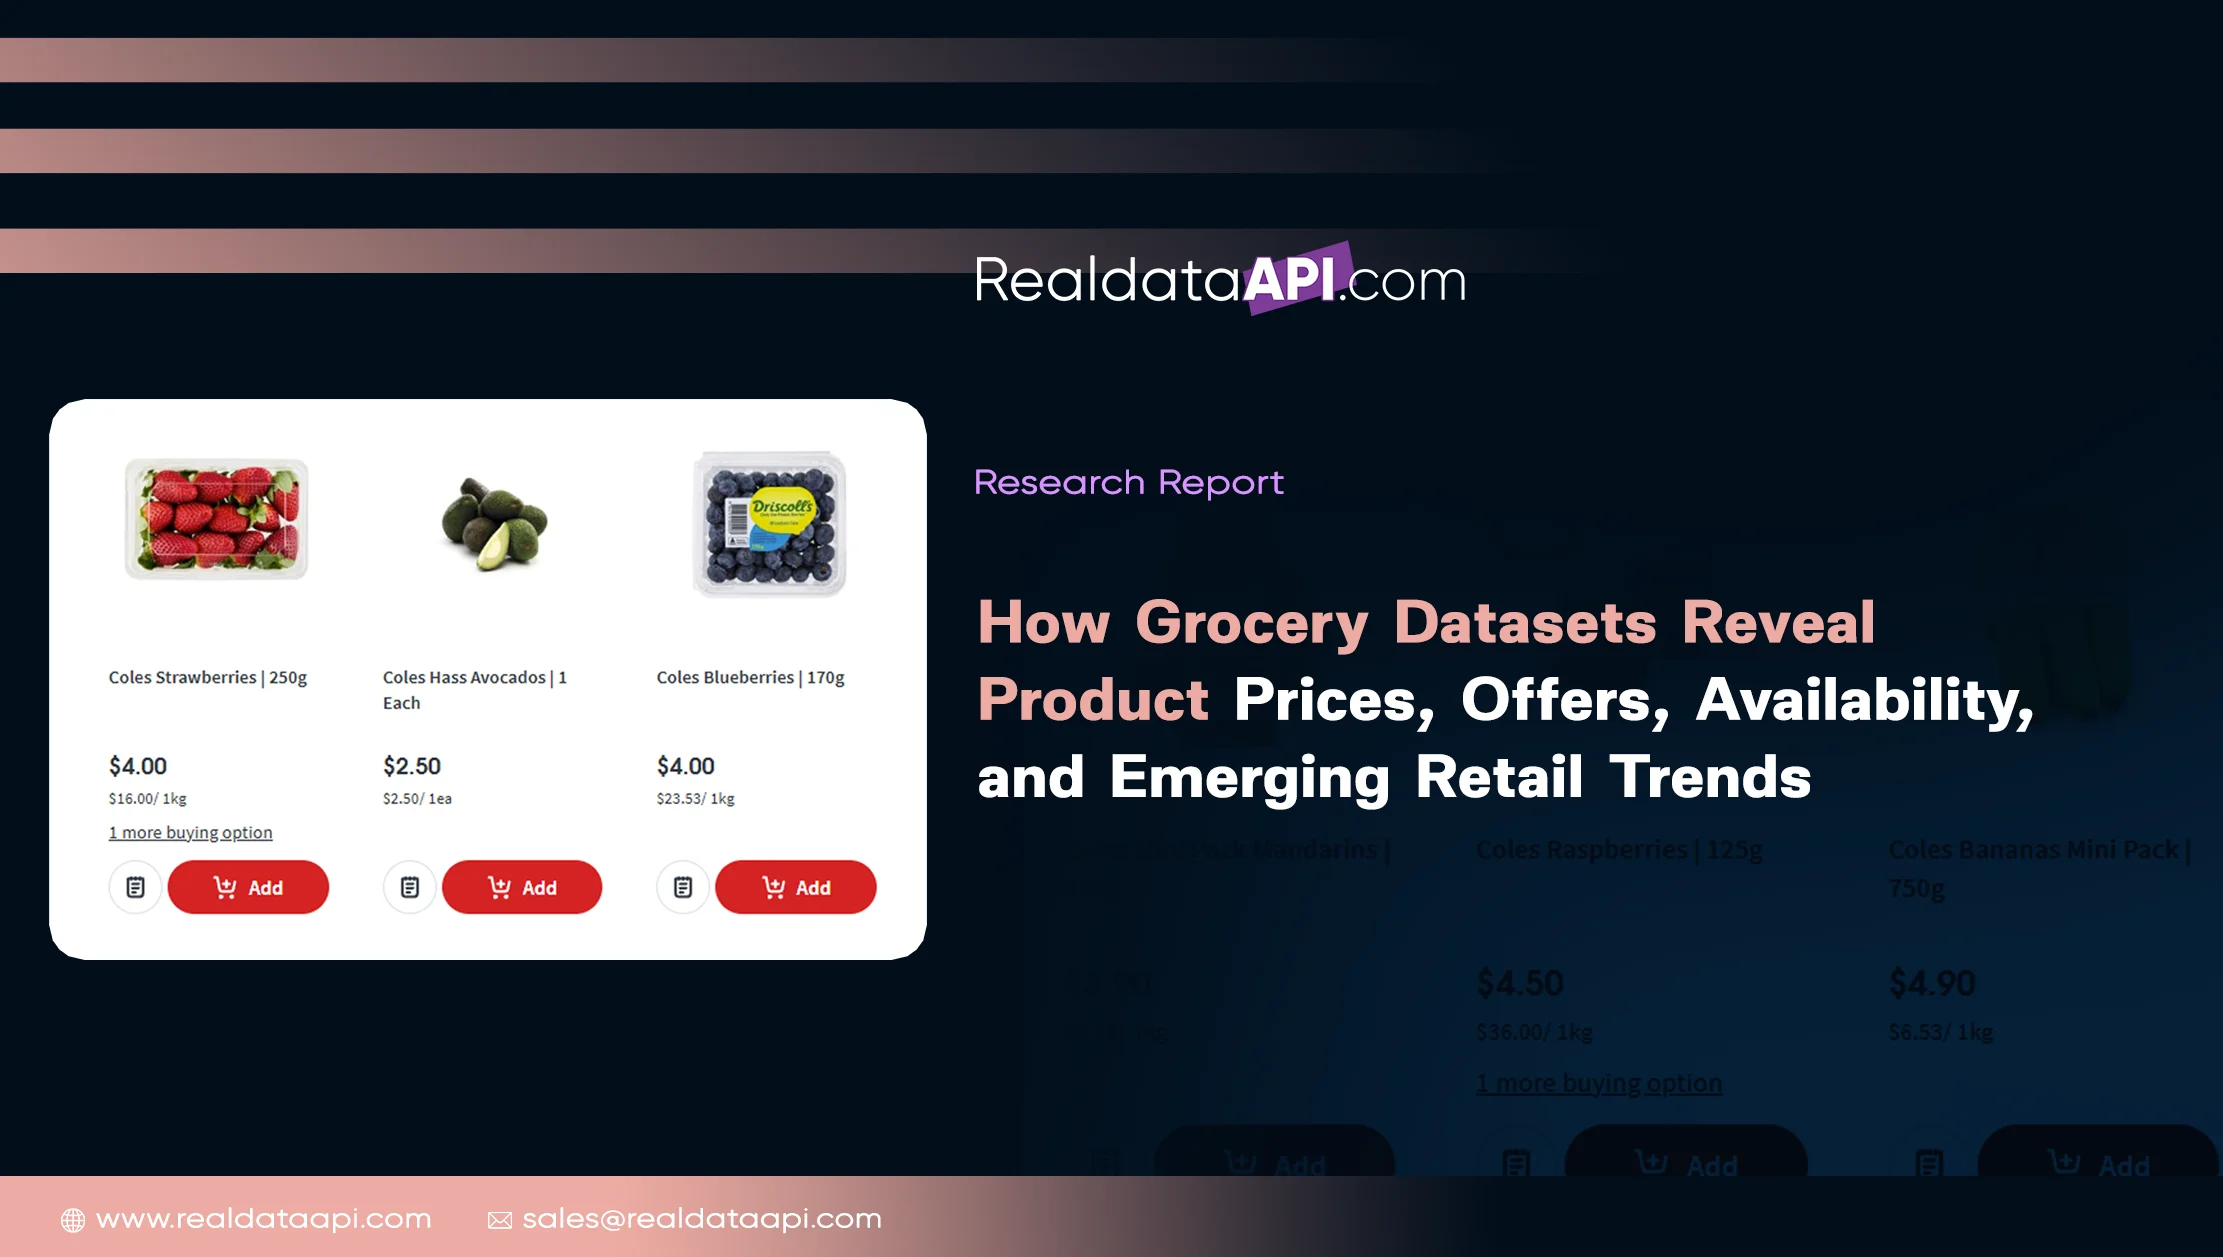
- Grocery Datasets help retailers and brands analyze product prices, promotions, stock availability, assortment changes, and broader retail movements across multiple channels.
- Grocery Data Scraping enables businesses to collect recurring product-level information and transform fragmented online grocery data into structured insights for pricing, competitive intelligence, and market research.
Introduction
The grocery industry operates in a highly dynamic environment where product prices, promotional offers, inventory levels, assortment, and consumer demand can change frequently. Retailers, FMCG brands, distributors, and market researchers therefore require timely data to understand what is happening across digital grocery channels.
Grocery Datasets can bring together product names, categories, brands, pack sizes, prices, discounts, availability, ratings, sellers, and other retail attributes in a structured format. Instead of reviewing individual retailer websites manually, businesses can use organized datasets to compare thousands of products and identify meaningful changes over time.
At the same time, Grocery Data Scraping can support recurring collection from online grocery stores, marketplaces, quick-commerce platforms, and retailer websites. When scheduled at appropriate intervals, this approach creates historical datasets that help organizations identify price movements, promotional cycles, assortment expansion, product removals, and availability fluctuations.
For retail market research, the value comes from turning individual observations into comparable records. A single product price may have limited meaning, but thousands of observations collected across retailers and dates can reveal pricing patterns, competitive gaps, and changing market conditions.
The following sections examine how structured grocery data can support research, monitoring, analytics, APIs, and dashboards from 2020 through 2026.
Understanding Market Research Through Structured Data
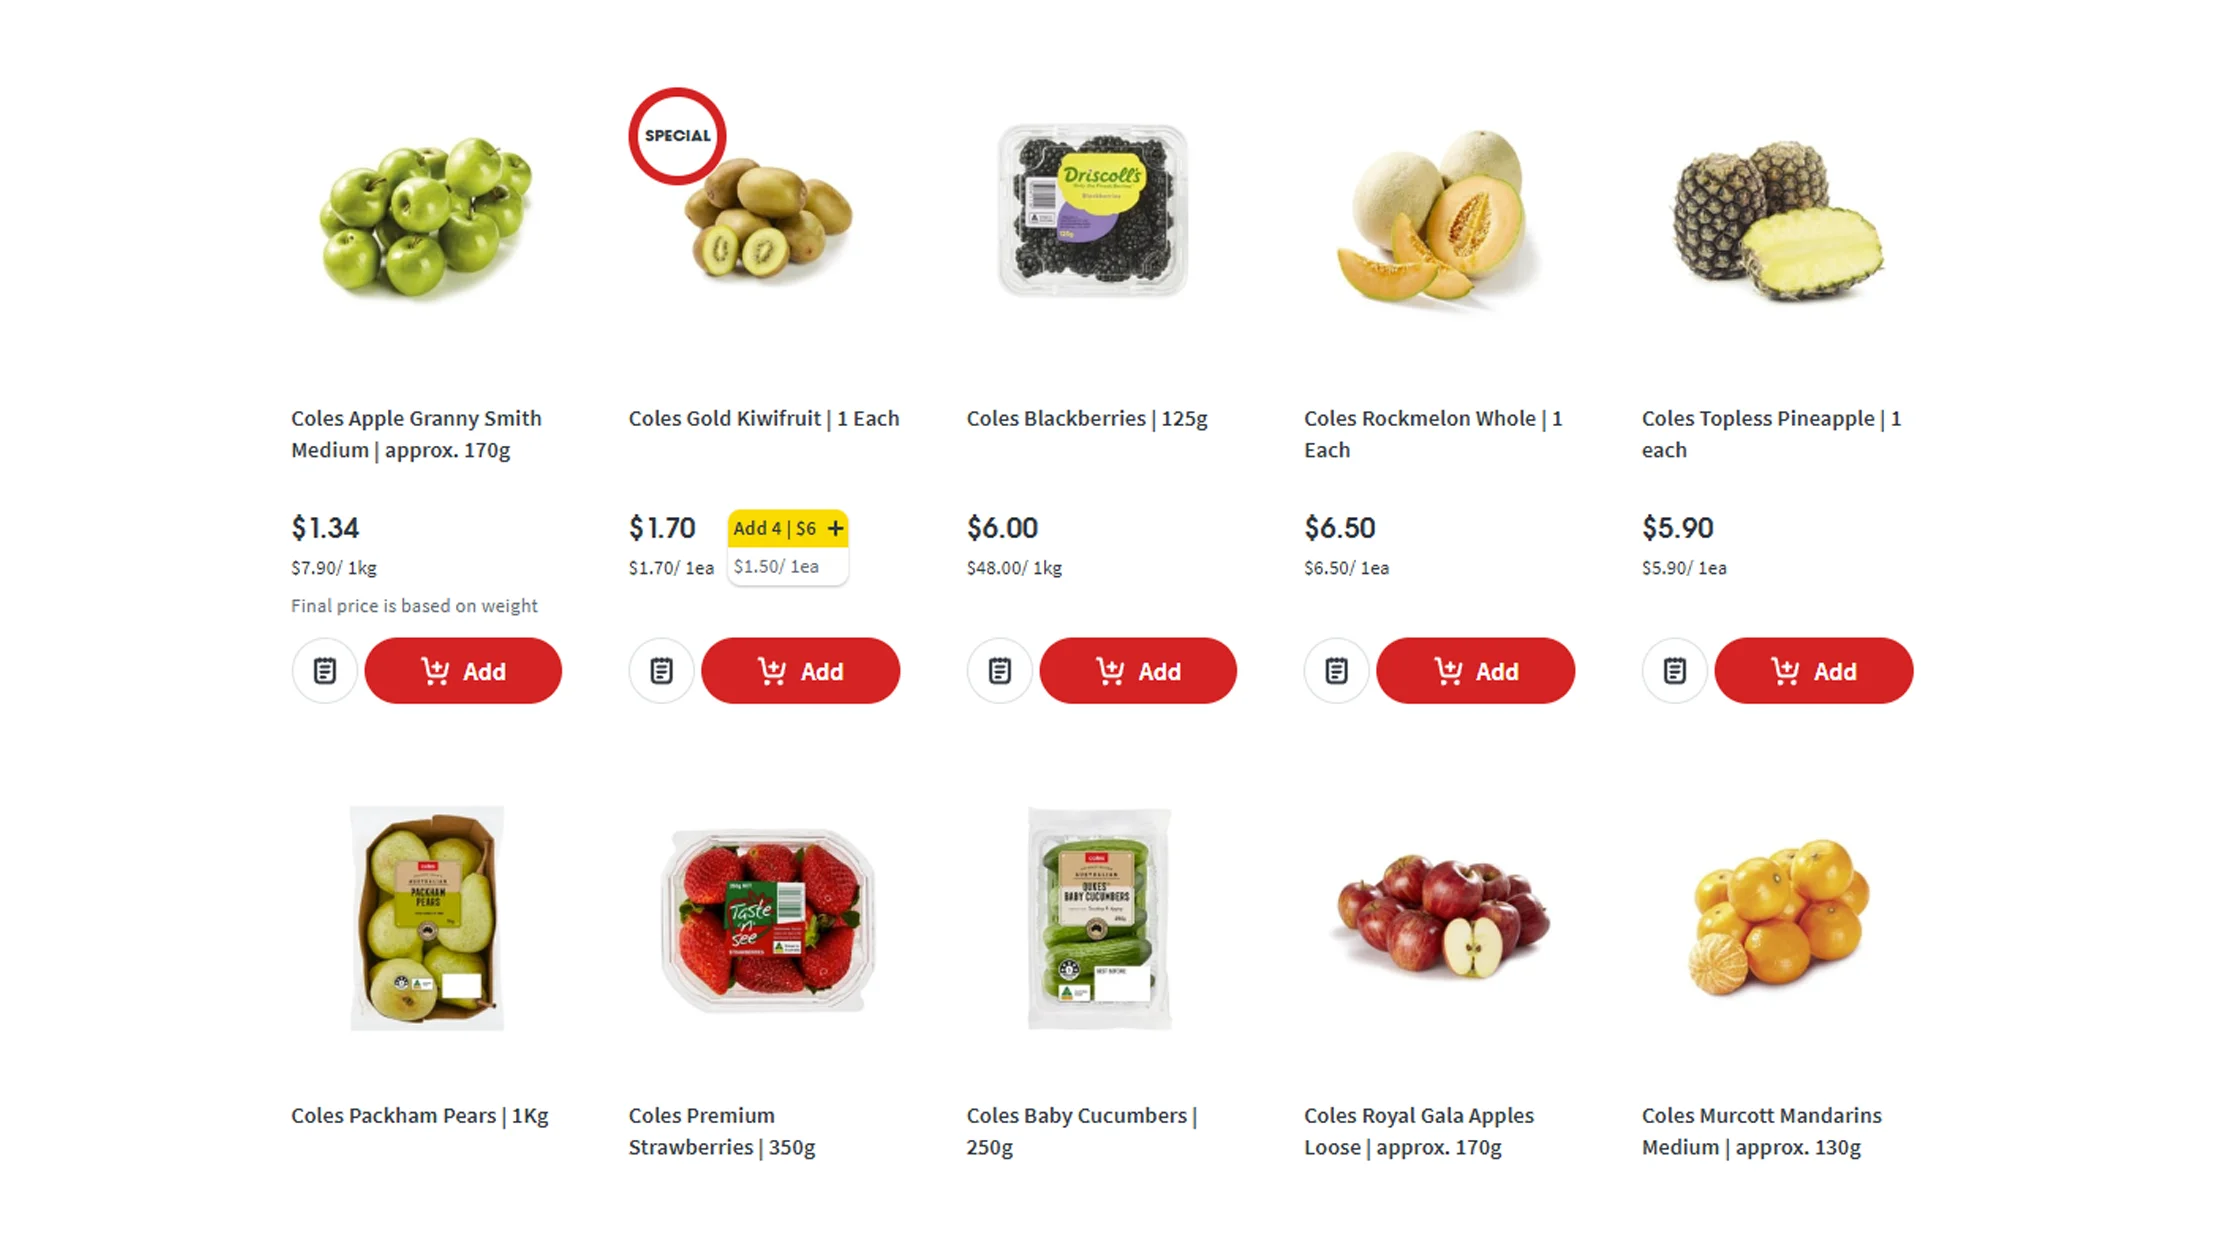
Retail market research increasingly depends on granular product information rather than occasional surveys or manually captured snapshots. Extracting grocery information at SKU level allows businesses to examine how products behave across retailers, categories, locations, and time periods.
A structured extraction workflow can capture product title, brand, category, subcategory, pack size, MRP, selling price, discount, promotional message, availability, seller, product URL, and collection timestamp. These fields can then be standardized to make comparisons possible.
For example, a retailer selling a 1-liter cooking oil product at a different price from another retailer creates an immediate benchmarking opportunity. When similar observations are collected every day or week, researchers can identify whether the difference is temporary, promotion-driven, or part of a longer pricing pattern.
Example Research Metrics
| Metric | Example Measurement | Research Use |
|---|---|---|
| Products monitored | 50,000+ SKUs | Market coverage |
| Retailers covered | 10–50 | Competitive comparison |
| Price observations | 1M+ records | Price trend analysis |
| Availability checks | Daily/hourly | Stock monitoring |
| Categories | 20+ | Assortment research |
These figures represent example research-program scales rather than universal industry benchmarks.
2020–2026 Market Evolution
Between 2020 and 2026, grocery retail research increasingly moved toward digital and continuously refreshed information. In 2020, changes in shopping behavior and supply conditions increased the importance of understanding product availability and online assortment. During 2021, digital grocery channels became increasingly important sources of observable retail information, creating more opportunities for structured online product research. In 2022, inflationary pressure and changing input costs made price comparisons more relevant to retailers and brands. By 2023, quick-commerce and marketplace channels provided additional product-level signals, including local availability and promotional changes. During 2024, organizations increasingly connected product data with competitive intelligence, category management, and pricing workflows. In 2025, automation and API-based delivery became more relevant for businesses requiring frequent data refreshes and integration with internal analytics environments. By 2026, grocery research increasingly benefits from combining historical product observations with automated monitoring, location-level comparisons, promotional intelligence, and dashboard-based reporting. Across this period, the central shift has been from occasional manual research toward structured, repeatable, and scalable retail intelligence workflows.
Tracking Price Changes and Promotional Activity
Price monitoring is one of the most important applications of grocery intelligence. Grocery prices can change because of promotions, supplier costs, seasonal demand, retailer strategies, competitor activity, or inventory conditions.
Real-Time Grocery Data Supports Price Monitoring by providing frequent observations of product prices across selected retailers or marketplaces. Businesses can compare current prices against historical records, identify unusual changes, and measure the frequency of promotions.
A pricing dataset may include:
- Product and SKU identifiers
- Regular price
- Current selling price
- Discount percentage
- Promotion type
- Pack size
- Availability
- Retailer
- Timestamp
- Product URL
Example Price Monitoring Table
| KPI | Example Value | Business Application |
|---|---|---|
| SKUs monitored | 100,000 | Large-scale assortment tracking |
| Daily observations | 500,000 | Frequent price checks |
| Retail channels | 25 | Competitor benchmarking |
| Historical period | 12–36 months | Trend identification |
| Price-change alerts | Configurable | Exception monitoring |
The values above illustrate possible monitoring configurations rather than claims about a specific market.
2020–2026 Pricing Intelligence Development
From 2020 to 2026, grocery pricing analysis became increasingly connected with digital retail behavior. In 2020, businesses faced rapidly changing demand and supply conditions, making basic price and availability observations useful for market assessment. In 2021, online grocery expansion generated more observable pricing information across retailers and marketplaces. During 2022, inflation and cost pressures increased attention toward price movements, discount depth, and category-level comparisons. In 2023, retailers and brands could increasingly compare prices across traditional e-commerce, quick-commerce, and other digital channels. In 2024, promotional intelligence became more granular, with businesses examining discount frequency, promotional duration, and differences between standard and promotional pricing. In 2025, automated pipelines supported more frequent refresh cycles and enabled pricing data to feed internal dashboards and analytics systems. In 2026, businesses can combine historical price observations with availability, assortment, and promotional signals to develop a broader view of competitive retail activity. This progression demonstrates why continuously refreshed product information can be more useful than isolated price snapshots when organizations need to understand market movements.
Turn changing grocery prices into actionable competitive intelligence with Real Data API!
Get Insights Now!Building a Detailed View of Grocery Assortments
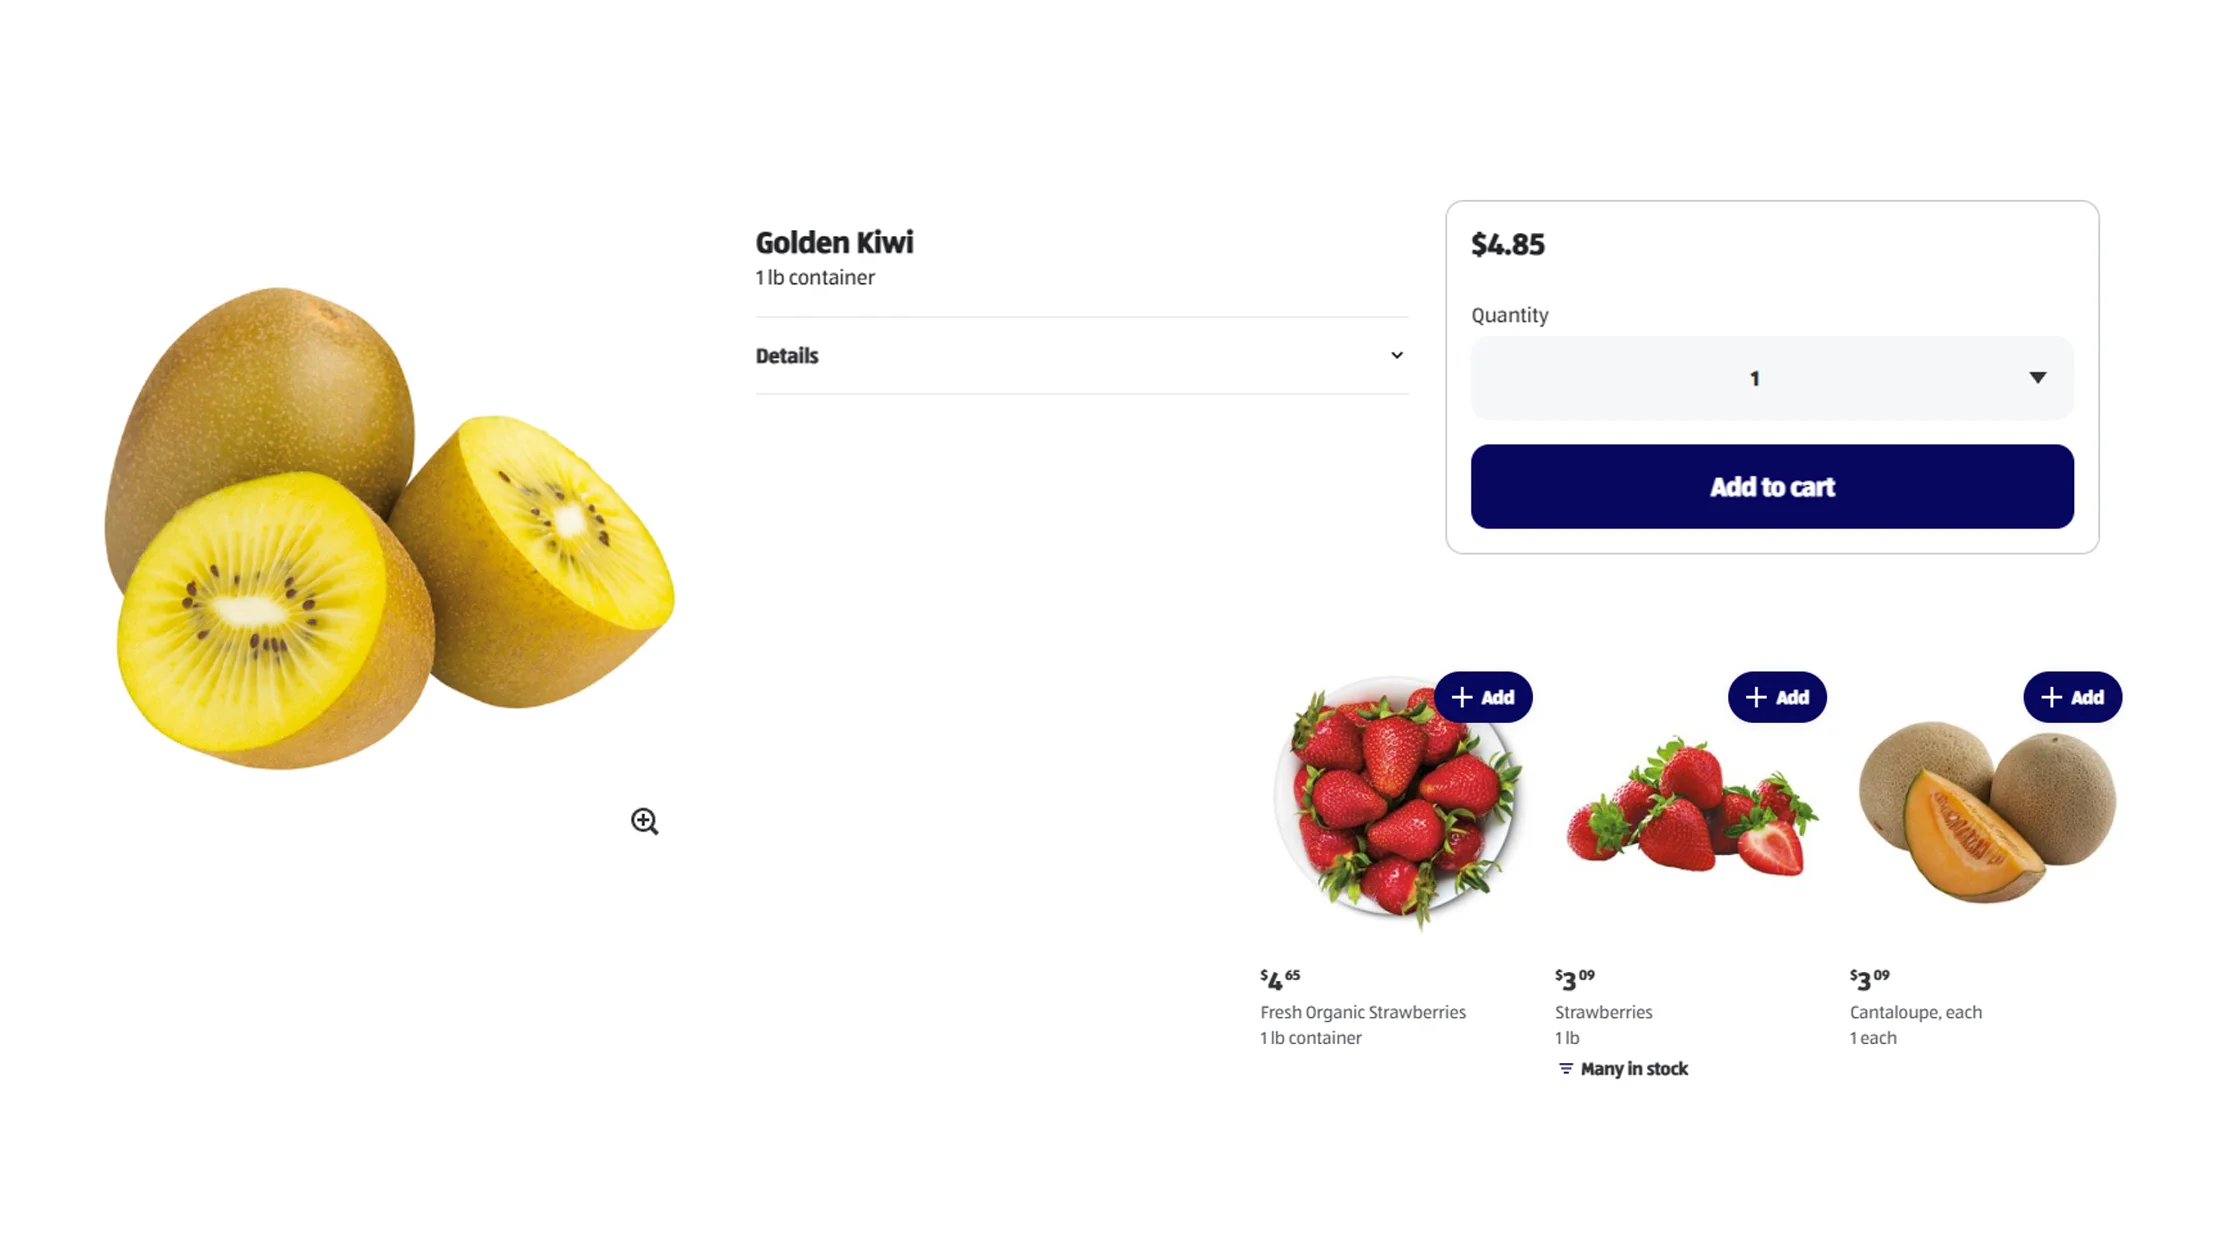
Understanding assortment is as important as monitoring price. A product can disappear from one retailer while remaining available at another. New brands may enter a category, private-label products may expand, or pack sizes may change.
Grocery product data scraping can help organizations maintain structured records of these changes. By comparing repeated snapshots, analysts can identify newly listed products, discontinued products, assortment gaps, and changes in category composition.
Example Assortment Intelligence
| Attribute | Data Point | Potential Insight |
|---|---|---|
| Product count | 75,000 | Assortment size |
| Brand count | 4,500 | Brand diversity |
| Category count | 30 | Category coverage |
| New listings | 2,000/month | Market expansion |
| Delisted products | 1,200/month | Assortment changes |
These are illustrative analytical values designed to demonstrate how an assortment-monitoring program can be structured.
2020–2026 Assortment Trends
The period from 2020 to 2026 reflects a major evolution in how grocery assortment can be observed digitally. In 2020, online grocery catalogs became an increasingly important source of information about product availability and consumer-facing assortment. In 2021, the growth of digital shopping created more opportunities to compare categories and brands across multiple online stores. In 2022, retailers and FMCG companies became more interested in understanding assortment alongside pricing as market conditions changed. During 2023, quick-commerce platforms added another layer of assortment intelligence because localized catalogs could vary by fulfillment location. In 2024, businesses increasingly examined assortment gaps, private-label presence, pack-size variations, and category-level competition. During 2025, automated data pipelines made recurring catalog comparisons more practical for large product universes. By 2026, assortment intelligence can combine product listings, price, promotion, availability, retailer, and historical observations. This creates a broader framework for understanding not only what products are present, but also how their commercial positioning changes over time. For FMCG manufacturers, this information can support distribution analysis, competitor research, category planning, and identification of potential assortment opportunities.
Connecting Product Intelligence With Business Systems
An API-based delivery model allows structured retail information to move directly into business applications. Instead of downloading files manually, organizations can integrate data into databases, analytics platforms, business intelligence tools, or internal applications.
A grocery product data API can provide structured fields such as product identifiers, names, categories, brands, pack sizes, prices, discounts, availability, sellers, and timestamps.
Example API Data Structure
| Field | Example |
|---|---|
| Product ID | SKU-102938 |
| Product Name | Premium Rice |
| Brand | Example Brand |
| Pack Size | 5 kg |
| Price | 425 |
| Discount | 8% |
| Availability | In Stock |
| Retailer | Retailer A |
| Timestamp | 2026-09-22 |
An API can also support scheduled collection and downstream processing. Organizations may use the information to populate pricing applications, category analytics, competitor-monitoring systems, or automated alerts.
2020–2026 Integration Progress
Between 2020 and 2026, retail data infrastructure increasingly shifted from isolated spreadsheets toward connected data environments. In 2020, many research workflows relied heavily on manually maintained files and periodic reporting. By 2021, businesses with growing online retail operations began requiring more structured and repeatable feeds. During 2022, integration became increasingly important as pricing and assortment information needed to be compared across more channels. In 2023, APIs and automated pipelines enabled organizations to move product observations into databases and analytics systems with less manual intervention. During 2024, integration with dashboards, data warehouses, alerting systems, and business intelligence environments became increasingly relevant. In 2025, organizations could combine multiple retail data sources within centralized analytical workflows. By 2026, API-based delivery can support near-continuous data flows, allowing teams to work with refreshed product information without repeatedly rebuilding collection processes. This approach is particularly useful for companies that need standardized records at scale and want retail intelligence to become part of their existing technology infrastructure rather than remain a separate research activity.
Creating Historical Datasets for Trend Analysis
A Grocery Dataset becomes particularly valuable when it contains historical observations rather than only current information. Historical records allow analysts to compare prices, availability, promotions, and assortment across different periods.
For example, a retailer can examine whether a product's price increased gradually or changed sharply. A brand can identify when competitors introduced new pack sizes. A market researcher can compare promotional activity across seasons.
Example Historical Analysis
| Analysis Area | Historical Signal | Possible Output |
|---|---|---|
| Price | Monthly price records | Price trend |
| Promotions | Discount history | Promotion frequency |
| Availability | Stock observations | Availability rate |
| Assortment | Product additions/removals | Catalog evolution |
| Competition | Cross-retailer prices | Benchmarking |
2020–2026 Historical Perspective
Historical retail data collected from 2020 through 2026 can provide a valuable framework for understanding long-term grocery-market development. The 2020 period offers a baseline for examining major changes in online shopping and product availability. Data from 2021 can help researchers identify the continued development of digital grocery assortments. In 2022, price observations became particularly relevant for examining changes across essential categories and promotional strategies. The 2023 period introduced more opportunities to compare traditional online grocery channels with newer fulfillment and quick-commerce models. During 2024, longer historical records enabled deeper analysis of recurring promotions, assortment changes, and competitive price positioning. In 2025, businesses could increasingly combine historical product records with automated monitoring and business intelligence systems. By 2026, a six-year historical window can support year-over-year comparisons, seasonal analysis, product lifecycle research, retailer benchmarking, and category-level trend studies. The main benefit of maintaining historical records is context: a current price, availability status, or promotion becomes more meaningful when analysts can compare it with previous observations. This makes historical grocery data useful for both strategic research and recurring operational analysis.
Turning Retail Data Into Actionable Visual Insights
A Grocery Delivery Dashboard can transform large volumes of product observations into visual indicators that decision-makers can review quickly.
Dashboards can display price changes, availability rates, promotional activity, category movements, retailer comparisons, and assortment changes. Filters can allow users to examine individual brands, categories, retailers, products, locations, or time periods.
Example Dashboard KPIs
| KPI | Example Display |
|---|---|
| Products tracked | 100,000 |
| Price changes | 7,500 |
| Out-of-stock products | 6.8% |
| Active promotions | 12,400 |
| New listings | 3,100 |
| Retailers monitored | 20 |
Again, these values are example dashboard metrics rather than market-wide statistics.
2020–2026 Analytics Development
From 2020 to 2026, retail analytics increasingly progressed from static reporting toward interactive monitoring. In 2020, businesses often relied on periodic spreadsheets and manually prepared reports to review digital grocery activity. In 2021, expanding online catalogs created greater demand for structured visualization of product and pricing information. During 2022, dashboards became increasingly useful for examining price movements and availability across categories. In 2023, broader digital retail adoption created opportunities to bring multiple channels into unified reporting environments. By 2024, dashboards could combine pricing, assortment, promotional, and availability indicators to provide a more complete view of retail performance. During 2025, automated refreshes and API integrations enabled dashboards to display more frequently updated information. By 2026, organizations can use dashboard-driven workflows to monitor thousands or millions of product observations while allowing users to drill into individual SKUs, brands, categories, retailers, and periods. This progression makes visual analytics particularly valuable for decision-makers who need to identify exceptions quickly rather than manually inspect raw records. A well-designed dashboard can therefore serve as the final layer connecting large-scale data collection with everyday retail decision-making.
Why Choose Real Data API?
Real Data API can support organizations that require structured and scalable retail intelligence across grocery markets. The focus is on transforming online product information into usable datasets and data feeds that can support research, monitoring, analytics, and business applications.
Key capabilities can include:
- Product, price, offer, and availability data collection
- Structured and standardized retail datasets
- Recurring data collection workflows
- Product and SKU-level monitoring
- Historical data development
- Multi-retailer comparison
- API-based data delivery
- Data validation and normalization
- Analytics-ready output
- Support for dashboards and business intelligence systems
For businesses operating across multiple categories or markets, scalable Web Scraping Services can help reduce the manual effort involved in collecting and organizing large volumes of online retail information.
At the center of these workflows, Grocery Datasets can provide the historical and structured foundation needed for product intelligence, competitive research, price analysis, assortment monitoring, and retail trend discovery.
Conclusion
Grocery retail data has become increasingly important for organizations seeking visibility into changing prices, offers, product availability, assortment, and competitive movements. From market research and price monitoring to API integration and interactive dashboards, structured product information can support multiple stages of the retail intelligence process.
The 2020–2026 period demonstrates a broader movement toward automated, scalable, and continuously refreshed retail analytics. Instead of relying exclusively on isolated observations, organizations can develop historical records that reveal how products and prices evolve over time.
Grocery Datasets can help retailers, FMCG brands, researchers, and analytics teams convert fragmented online information into structured business intelligence.
Explore Real Data API to build scalable grocery data workflows for product, price, offer, availability, and retail trend analysis!
FAQs
What are Grocery Datasets used for?
Grocery Datasets can help businesses monitor product prices, promotions, availability, assortment, and retailer activity for competitive intelligence, market research, pricing analysis, and retail trend monitoring.
How does Grocery Data Scraping support retail analysis?
Grocery Data Scraping collects product information from online retail sources and organizes it into structured records that can support recurring price, assortment, availability, and promotion analysis.
What is Grocery Data Extraction for Retail Market Research?
Grocery Data Extraction for Retail Market Research involves collecting product-level information such as prices, brands, pack sizes, discounts, and availability to identify market patterns and competitive movements.
How does Real-Time Grocery Data Supports Price Monitoring work?
Real-Time Grocery Data Supports Price Monitoring by providing frequently refreshed product-price observations that allow businesses to compare current pricing, promotions, and availability against historical or competitor data.
How can businesses collect grocery data through an API?
Businesses can use grocery product data scraping workflows and integrate structured outputs into internal systems. Use Real Data API to support automated collection, processing, and delivery.
Latest posts
How Uber Eats API Helps Businesses Overcome Restaurant, Menu, and Pricing Data Challenges
How Myntra API Solves Fashion Retail Challenges with Fashion Product, Price, Brand, and Category Data
How Nykaa Fashion Dataset Solves Product, Price, Brand, and Fashion Market Trend Tracking Challenges
Harrods UK: The World's Leading Luxury Department Store - A Complete Guide to Harrods Data Scraping, API Access, and Datasets






.png)



