Introduction
Quick commerce intelligence report using Getir data can help retailers, grocery brands, investors, and market researchers understand pricing, promotions, assortment, availability, and competitive movements in rapid grocery delivery. The core approach is simple: collect product-level data regularly, standardize it, compare changes over time, and turn those observations into market intelligence.
Getir provides an important case study because its growth and retrenchment reflect the wider evolution of quick commerce. The company reached a valuation of nearly $12 billion during the pandemic-era expansion, but in April 2024 announced that it would leave the UK, Germany, Netherlands, and most other European and U.S. operations to focus on Turkey. Those markets represented about 7% of revenue.
A Getir Daily Grocery Scraping API can help analysts monitor product prices, discounts, assortment, and availability at regular intervals. This creates a historical dataset instead of relying on occasional manual checks.
Quick Commerce Market Signals, 2020-2026
| Year | Market Development | Intelligence Implication |
|---|---|---|
| 2020 | Pandemic accelerates online grocery adoption | Demand monitoring becomes critical |
| 2021 | Rapid expansion of instant-delivery models | Competitive benchmarking intensifies |
| 2022 | Funding and inflation reshape unit economics | Price and promotion tracking gains importance |
| 2023 | Market consolidation begins | Assortment and competitor monitoring matter more |
| 2024 | Getir exits several international markets | Sustainable growth becomes a key question |
| 2025 | Quick commerce focuses more on economics | Margin and pricing intelligence gain value |
| 2026 | Data-led optimization becomes central | Continuous market monitoring supports decisions |
Bottom line: Getir data can help businesses understand not only what products cost, but also how pricing, promotions, assortment, and availability change as quick commerce markets mature.
How Can Businesses Track Grocery Prices in Real Time?
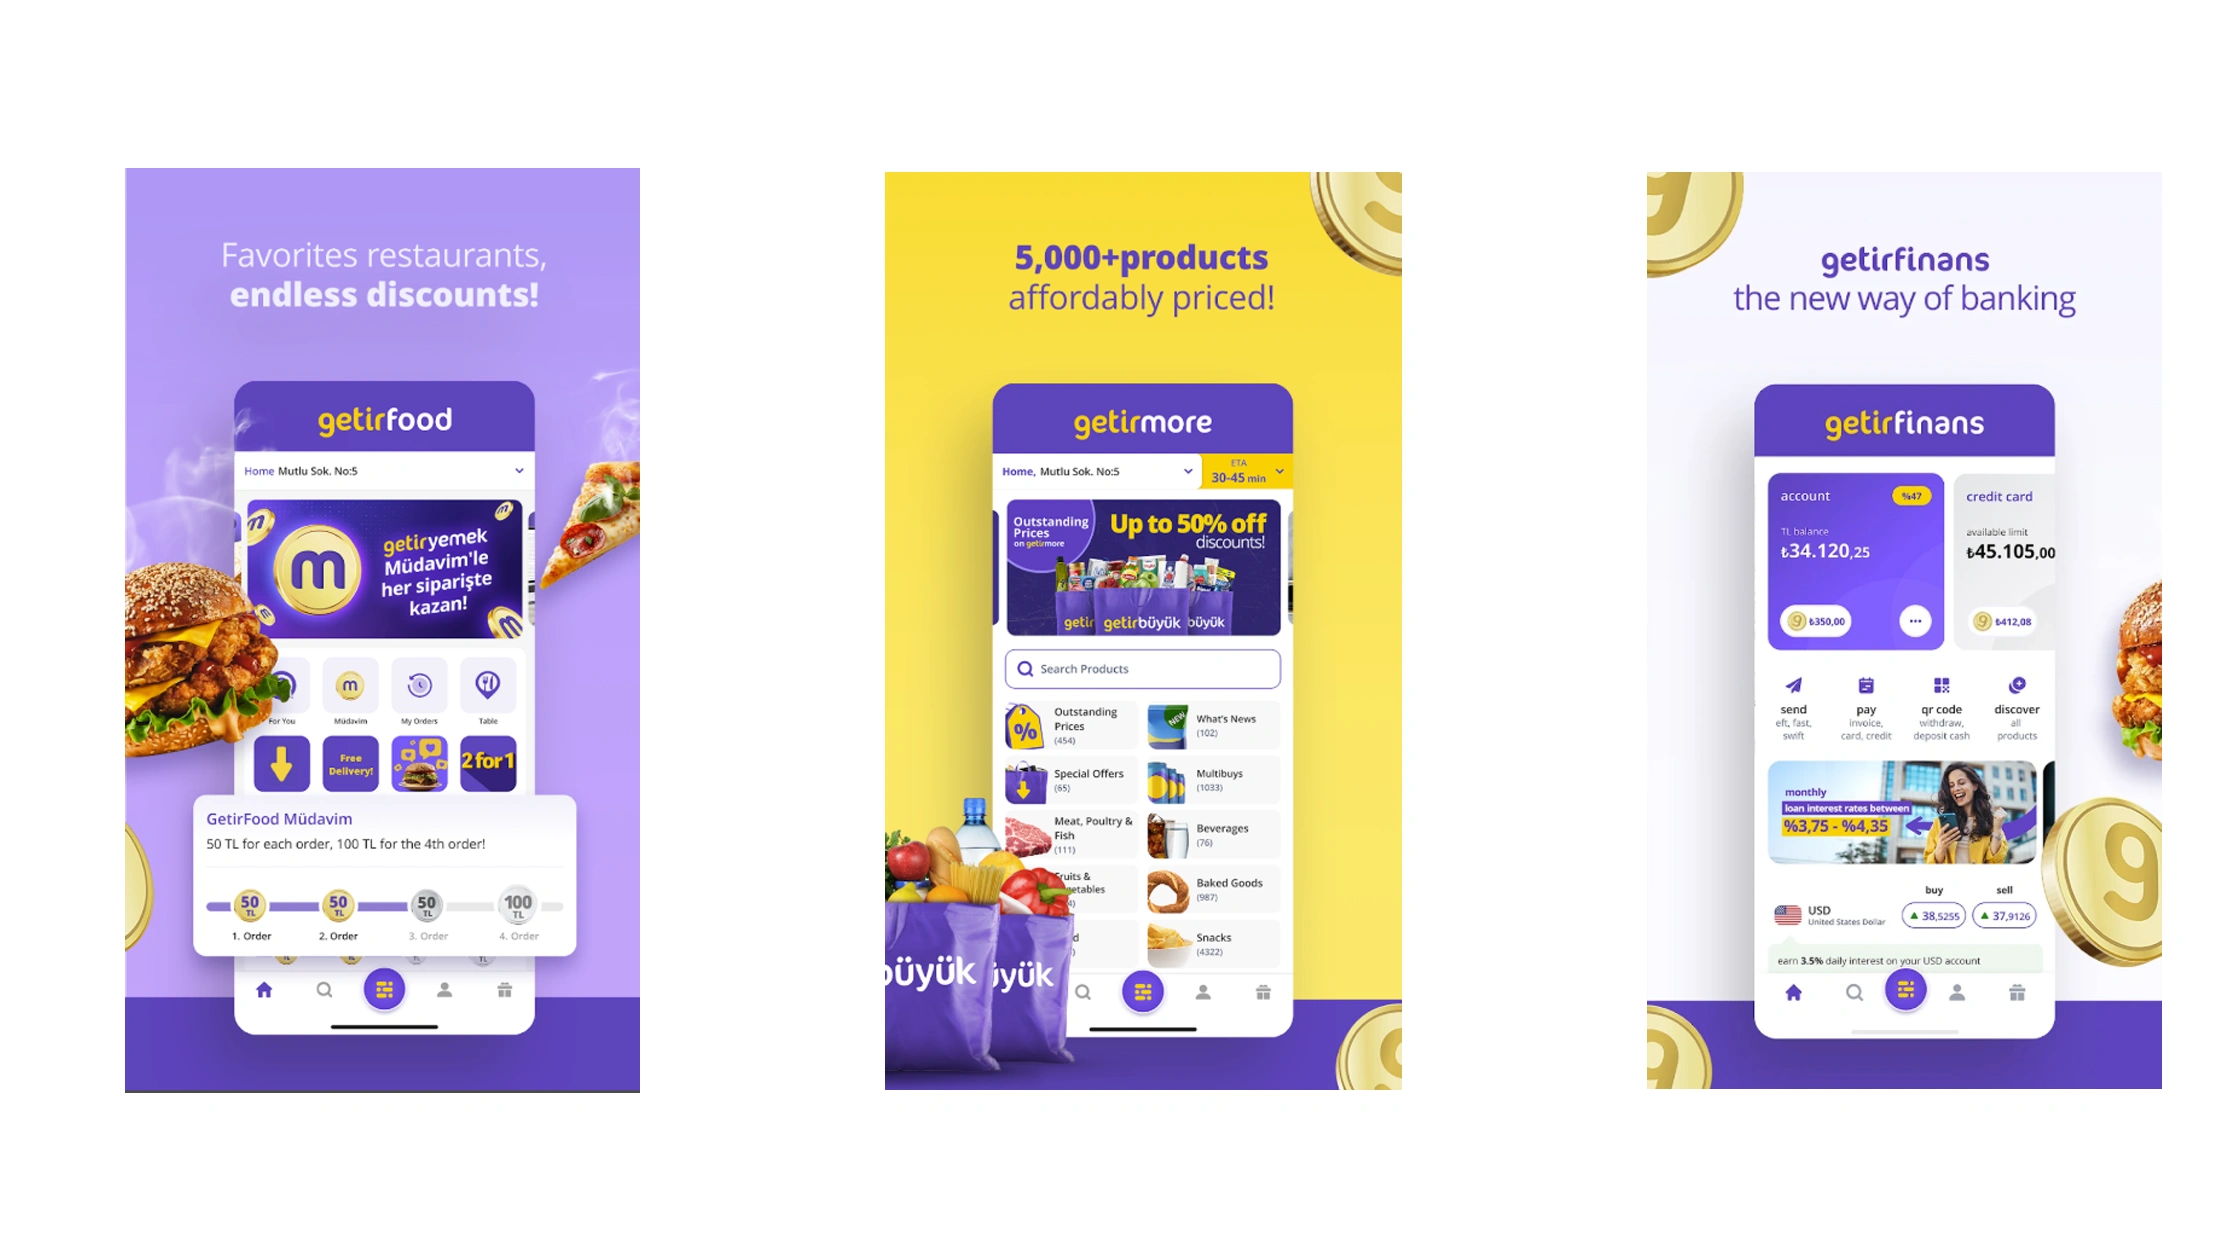
Scrape Getir grocery prices in real time to build a continuous view of product-level pricing. Quick commerce prices can vary by product, location, promotion, time, and availability. A single manual observation may therefore provide only a temporary snapshot.
A structured collection process can capture product name, category, brand, pack size, displayed price, discounted price, availability, and collection timestamp. Analysts can then calculate price changes and identify recurring patterns.
This matters because quick commerce depends on a large number of small, frequent purchases. A pricing change on a popular product can influence basket economics and customer perception. Real-time or frequent data collection can help retailers benchmark their own prices and identify unusual movements.
Getir's international retreat also demonstrates why market context matters. In 2024, the company decided to focus on Turkey after rapid pandemic-era expansion and weaker economics in several overseas markets.
Pricing Intelligence Framework, 2020-2026
| Year | Pricing Focus | Key Metric |
|---|---|---|
| 2020 | Pandemic price baseline | Average product price |
| 2021 | Expansion pricing | Price by category |
| 2022 | Inflation impact | Year-over-year change |
| 2023 | Competitive pricing | Price gap |
| 2024 | Market consolidation | Discount frequency |
| 2025 | Margin discipline | Net promotional price |
| 2026 | Dynamic monitoring | Price-change alerts |
Businesses can use these observations to identify price leaders, detect sudden increases, compare equivalent pack sizes, and monitor high-frequency grocery categories.
The strongest approach does not simply collect prices. It preserves historical observations. This allows analysts to distinguish a temporary promotion from a sustained pricing strategy.
What Can Price Fluctuation Data Tell Retailers?
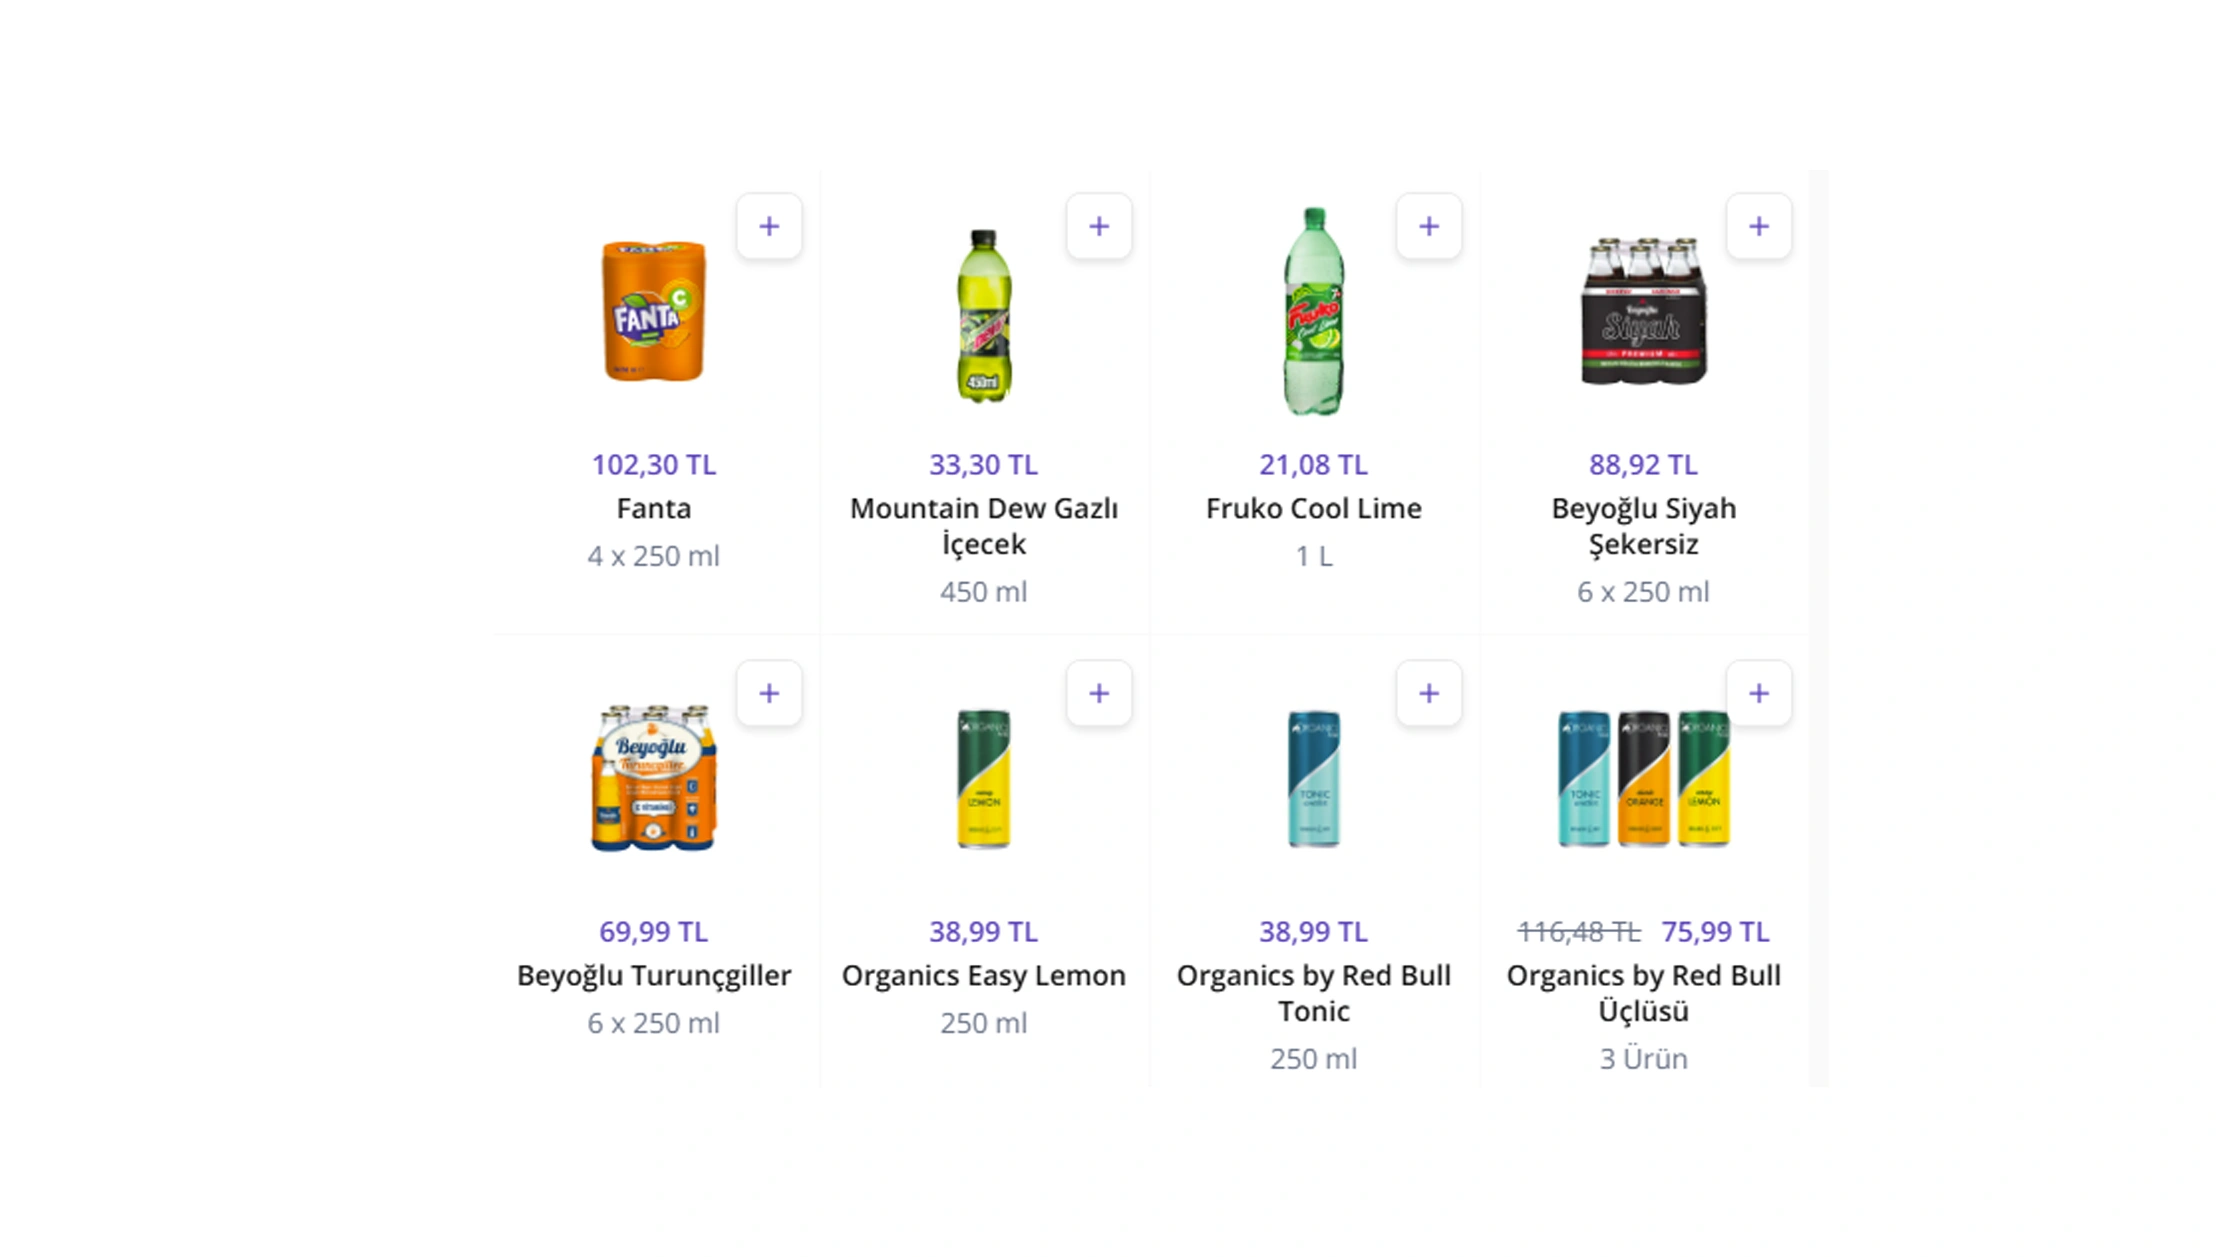
Web Scraping grocery price fluctuations using Getir data can reveal how grocery prices move across categories, brands, locations, and time periods. This is particularly useful when inflation, promotions, supply changes, and competitive pressure affect retail pricing.
The first step is normalization. Analysts should compare equivalent products using consistent units. A 500-gram product should not be directly compared with a one-kilogram product without calculating a normalized unit price.
A second step is frequency. Daily collection can reveal short-term promotions. Weekly collection can identify broader pricing patterns. Longer historical periods can expose seasonal behavior.
Inflation makes this especially important. The quick-commerce model grew rapidly during COVID-19, but the industry later faced higher operating costs and pressure to prove sustainable economics. Getir's 2024 withdrawal from several international markets illustrates the shift from expansion toward profitability and operational focus.
Price-Fluctuation Research Timeline
| Year | Market Condition | Suggested Analysis |
|---|---|---|
| 2020 | Demand shock | Baseline price tracking |
| 2021 | Rapid adoption | Category comparison |
| 2022 | Inflation pressure | Price-change index |
| 2023 | Competition increases | Competitor price gaps |
| 2024 | Consolidation | Promotion effectiveness |
| 2025 | Profitability focus | Margin-oriented analysis |
| 2026 | Data-driven retail | Automated alerts |
Analysts can create a price volatility score using the frequency and magnitude of product changes. They can also identify products with unusually high promotional activity.
For brands, this data supports channel monitoring. For retailers, it supports competitive benchmarking. For investors, it can provide evidence about pricing behavior and market maturity.
How Can Promotion Data Improve Competitive Analysis?
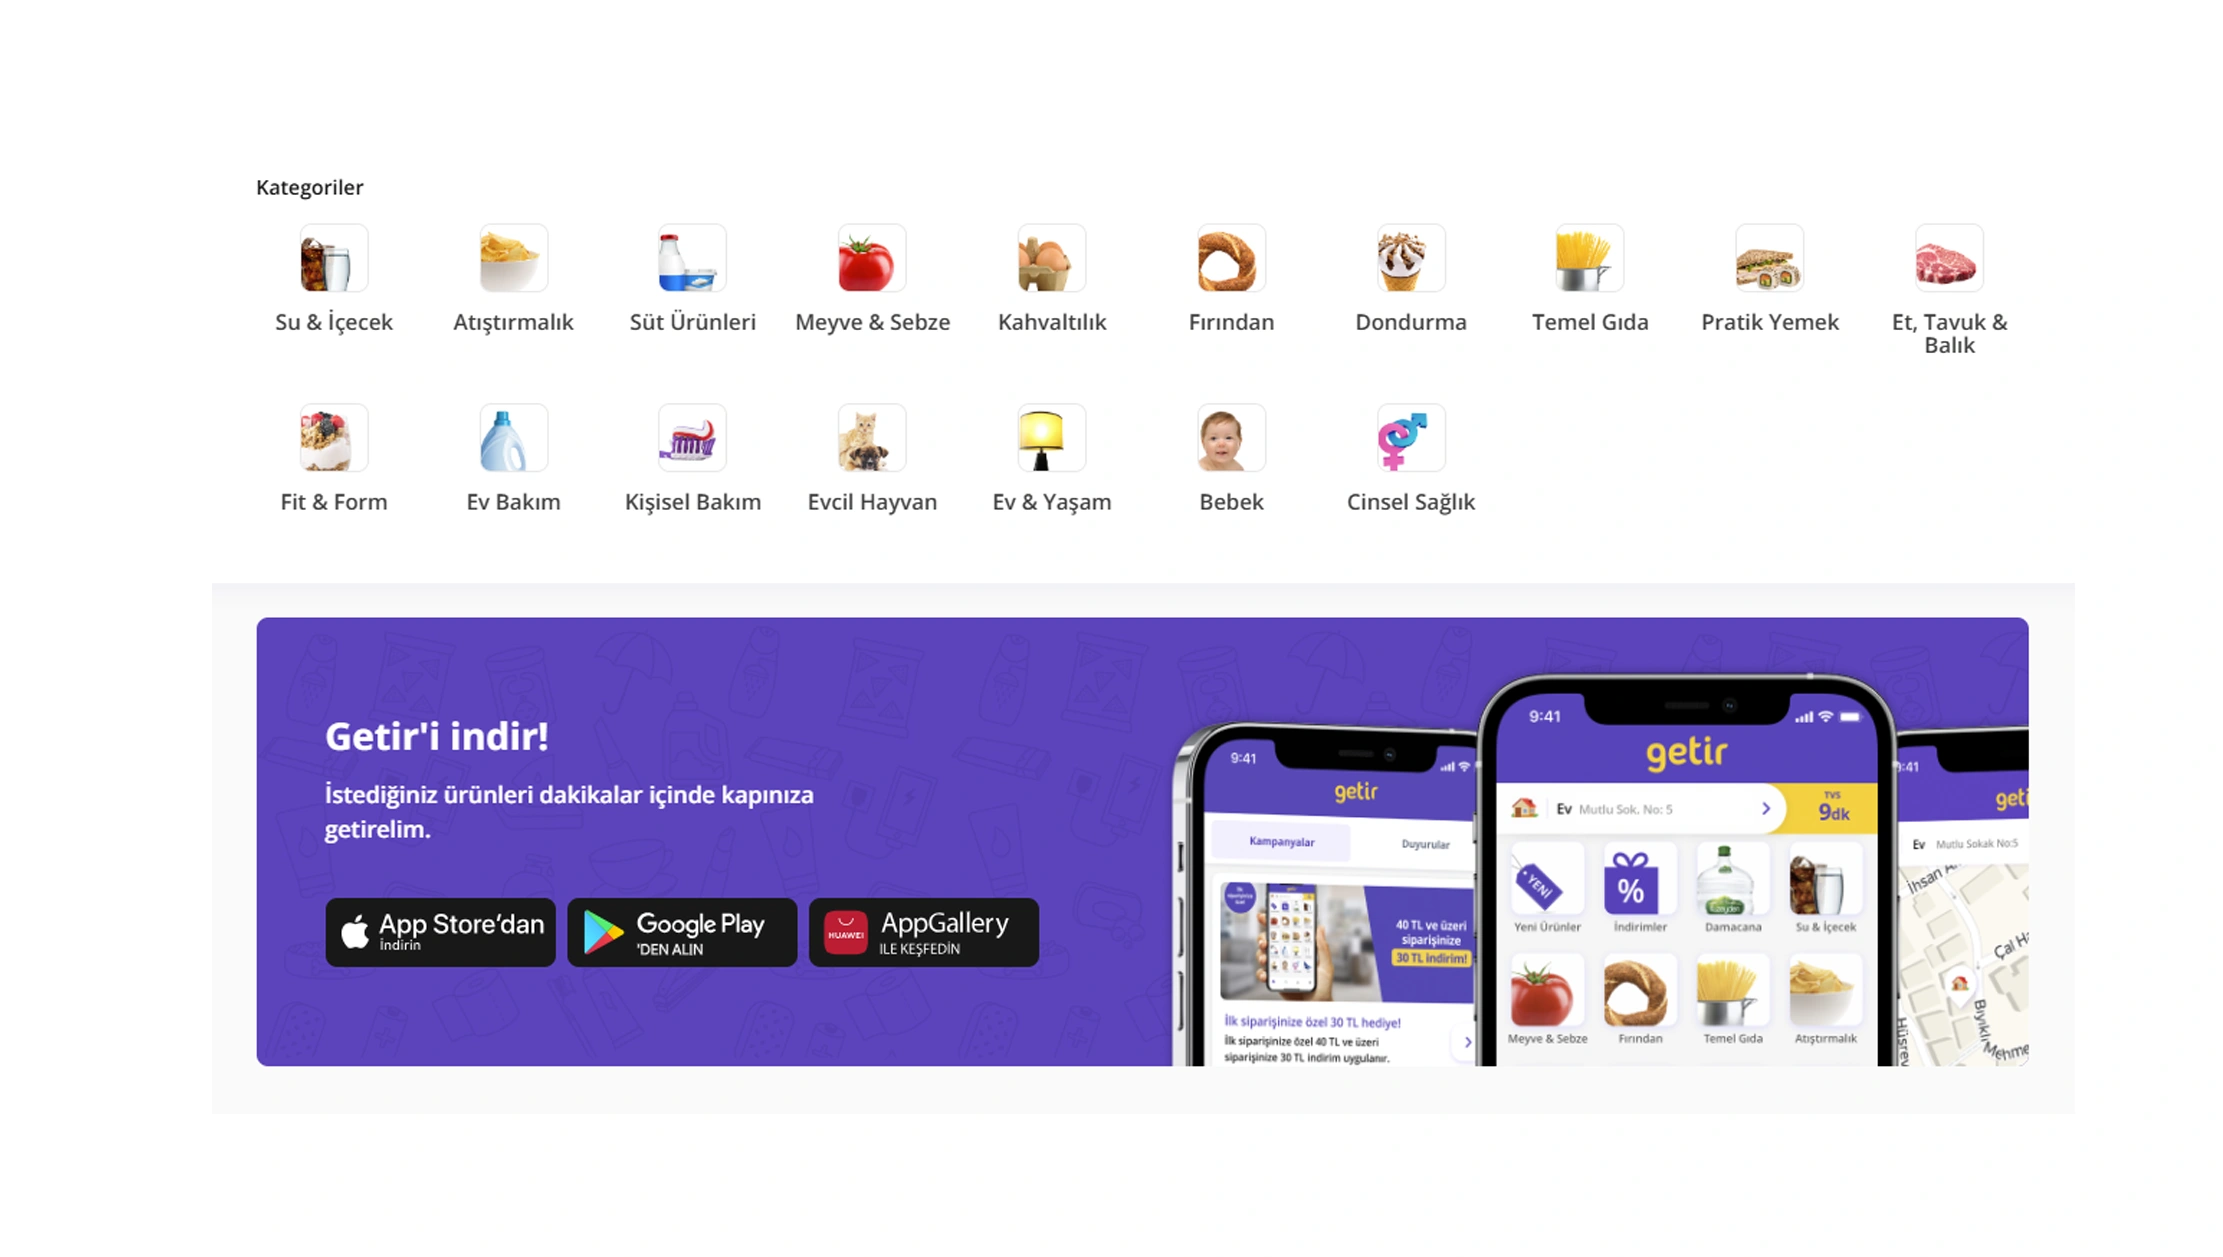
Extract Getir grocery promotions and discounts data to understand how quick-commerce platforms use offers to attract and retain customers. Promotions can include percentage discounts, fixed-price offers, bundle deals, reduced prices, and category-specific campaigns.
A promotion dataset should record the original price, promotional price, discount percentage, product, category, collection date, and availability. Historical records can then show which products receive discounts most often.
Promotion analysis can reveal several useful patterns. A retailer may discover that staple products receive frequent discounts while premium products remain closer to list price. A brand may identify competitors using aggressive discounts on the same category. An investor may see whether promotional intensity is increasing or decreasing.
Getir's trajectory provides a useful strategic backdrop. The company expanded aggressively during the pandemic and later faced weaker post-pandemic demand and strong competition. Reuters reported that Getir had reached a $12 billion valuation during its expansion phase before announcing its 2024 international retreat.
Promotional Intelligence, 2020-2026
| Year | Promotion Trend | Research Objective |
|---|---|---|
| 2020 | High convenience demand | Establish baseline |
| 2021 | Customer acquisition | Track discount depth |
| 2022 | Inflation sensitivity | Measure promotion response |
| 2023 | Competitive pressure | Compare campaign frequency |
| 2024 | Market restructuring | Evaluate promotional discipline |
| 2025 | Profitability focus | Measure discount efficiency |
| 2026 | Optimization | Automate promotion alerts |
Promotion data becomes more valuable when combined with prices and availability. A discount is less meaningful if the product is unavailable. This is why a complete quick-commerce dataset should capture multiple dimensions at the same time.
Why Is a Getir Scraper Useful for Market Intelligence?
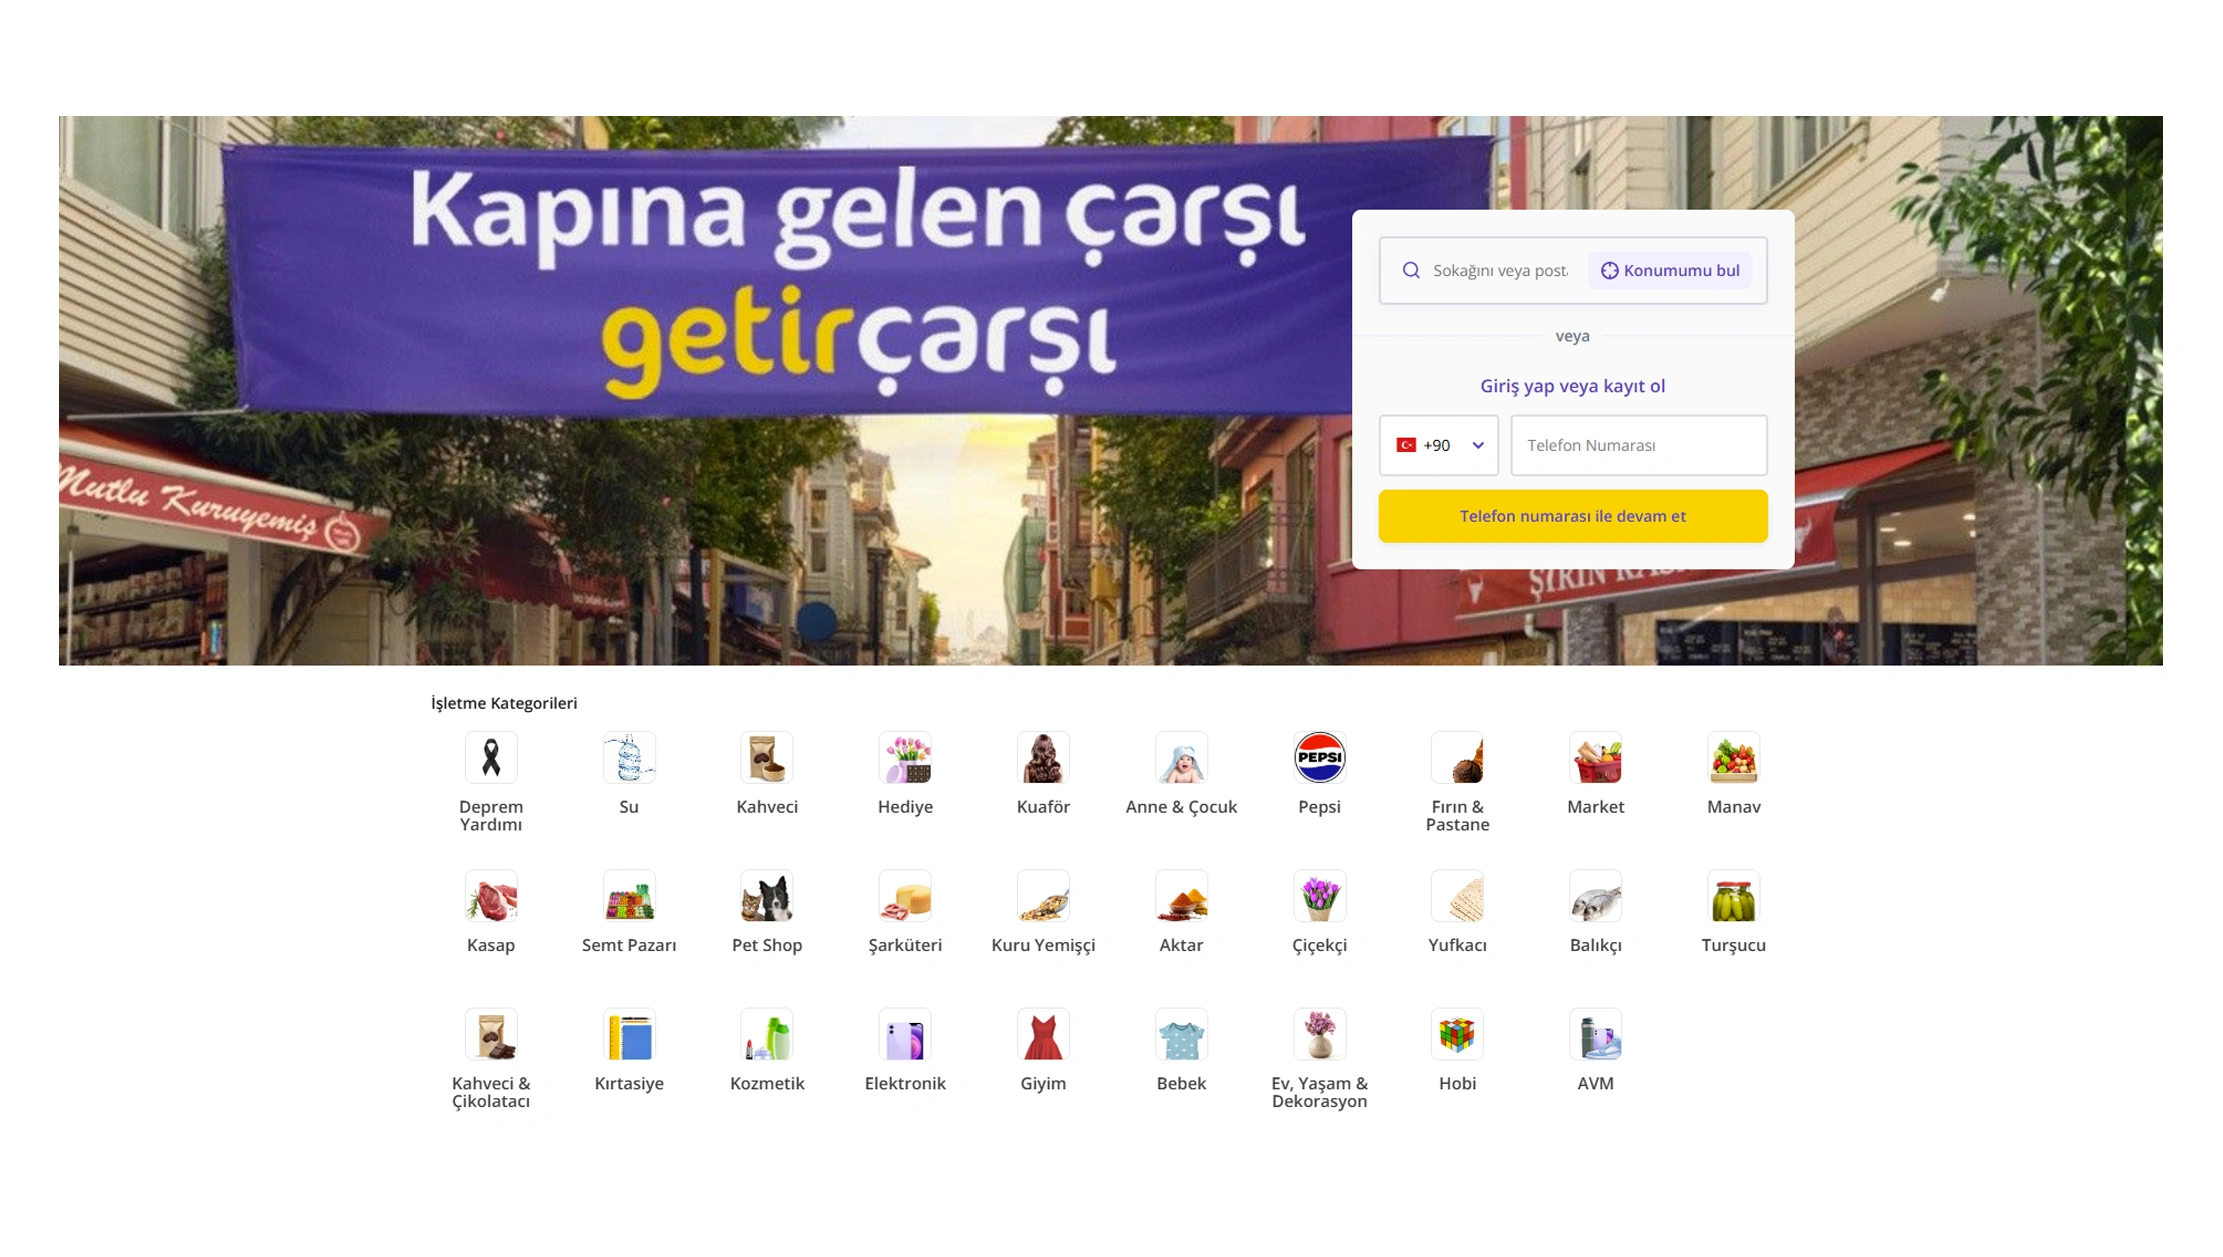
A Getir Scraper can automate the collection of product and market observations that analysts would otherwise gather manually. The purpose is not simply to gather more data. The purpose is to create a consistent stream of structured information for analysis.
A useful scraping workflow can capture product names, categories, brands, pack sizes, prices, promotions, availability, and timestamps. Analysts can then organize these fields into a historical database.
The dataset can support dashboards and alerts. For example, a retailer could receive an alert when a competitor changes the price of a key product. A brand could track the visibility and pricing of its products. A researcher could compare category-level price movements across locations.
Getir's global footprint changed significantly between 2020 and 2024. Eurofound reports that Getir employed about 32,000 people globally in 2023 and announced approximately 5,600 planned job losses in connection with its 2024 international restructuring.
Operational Intelligence Timeline
| Year | Data Priority | Example Output |
|---|---|---|
| 2020 | Product discovery | Initial catalog |
| 2021 | Market expansion | Location coverage |
| 2022 | Pricing | Historical price series |
| 2023 | Promotions | Discount database |
| 2024 | Market changes | Availability trends |
| 2025 | Optimization | Competitive dashboard |
| 2026 | Automation | Real-time alerts |
The value of automated collection increases as the number of products and markets grows. Analysts can spend less time gathering information and more time interpreting it.
How Can a Historical Dataset Support Grocery Intelligence?

A Web Scraping Getir Dataset can transform individual product observations into a long-term research asset. Each record can represent a product at a specific location and time. This structure allows analysts to compare the same product across days, weeks, and years.
A high-quality dataset should include unique product identifiers where possible. It should also preserve product names, brands, categories, pack sizes, prices, promotions, availability, and timestamps.
Historical data enables several analytical models. Researchers can calculate median prices. They can measure discount frequency. They can identify products with recurring stockouts. They can compare assortment breadth between locations.
This is important because quick commerce is highly localized. Assortments can differ by fulfillment location, neighborhood, demand, and inventory. A national average can therefore hide important local differences.
Research on quick-commerce assortment planning also highlights the importance of matching online assortment decisions with local customer demand.
Dataset Development, 2020-2026
| Year | Dataset Stage | Analytical Value |
|---|---|---|
| 2020 | Initial records | Baseline |
| 2021 | Wider coverage | Market comparison |
| 2022 | Historical depth | Trend analysis |
| 2023 | More product fields | Category intelligence |
| 2024 | Market restructuring | Competitive analysis |
| 2025 | Data enrichment | Predictive modeling |
| 2026 | Continuous collection | Real-time intelligence |
A historical dataset also supports machine learning. Models can use previous prices, promotions, product availability, and category behavior to identify likely future movements.
The key requirement is data consistency. Without standardized fields and timestamps, historical comparisons become unreliable.
What Are the Main Applications of a Quick-Commerce Data API?
A Quick Commerce Data Scraping API can provide structured information to businesses that need continuous market intelligence. Instead of manually collecting product information, teams can connect data workflows to analytical systems.
Common applications include price benchmarking, competitor monitoring, promotion tracking, assortment analysis, availability monitoring, category research, and market forecasting.
Retailers can use the data to compare their prices with marketplace prices. Consumer brands can monitor how their products appear across channels. Investors can study market behavior. Consulting teams can build research reports from historical observations.
The global quick-commerce sector has also shown why continuous monitoring matters. Getir's 2024 decision to focus on Turkey followed a period of rapid expansion and subsequent pressure from competition and weaker post-pandemic demand.
API Use Cases Across the Market Cycle
| Year | Primary Use Case | Business Question |
|---|---|---|
| 2020 | Market discovery | What products are available? |
| 2021 | Competitor monitoring | How are assortments changing? |
| 2022 | Price intelligence | How fast are prices moving? |
| 2023 | Promotion analysis | Which offers are most common? |
| 2024 | Market restructuring | Which markets remain attractive? |
| 2025 | Predictive analytics | What trends are emerging? |
| 2026 | Automated intelligence | What changed today? |
An API-driven workflow can feed dashboards, databases, spreadsheets, data warehouses, and business intelligence platforms. It can also support automated alerts when specific products or categories change.
The strongest implementation combines fresh observations with historical records. That creates a richer picture of both current conditions and long-term trends.
Why Choose Real Data API for Quick Commerce Intelligence?
Quick commerce intelligence report using Getir data becomes more useful when businesses can access consistent, structured, and scalable data for analysis. Real Data API can help organizations build automated workflows for product, price, promotion, and availability intelligence.
The platform approach can reduce repetitive research and make recurring data collection easier to integrate into business workflows.
Key advantages
- Structured data: Organize grocery information into consistent fields.
- Scalable workflows: Support larger product and market research projects.
- Historical tracking: Preserve previous prices, promotions, and availability observations.
- Competitive intelligence: Compare products, pricing, and promotions.
- Faster research: Reduce manual marketplace monitoring.
- Analytics-ready output: Prepare data for dashboards, databases, and models.
- Automated monitoring: Support recurring collection and change detection.
The need for this type of intelligence is clear from Getir's market history. The company expanded rapidly during the pandemic, reached a valuation close to $12 billion, and later shifted its strategy toward Turkey after exiting several international markets.
This makes Getir more than a grocery-delivery example. It provides a useful case for understanding how pricing, promotions, assortment, competition, and market economics interact in quick commerce.
Conclusion
Quick commerce is no longer defined only by delivery speed. Pricing, assortment, promotions, availability, customer demand, and operational economics now shape competitive performance.
A structured data strategy helps businesses monitor these factors continuously. Price histories can reveal inflation and competitive changes. Promotion records can show discount intensity. Assortment data can identify category opportunities. Availability records can reveal supply gaps. Historical snapshots can support forecasting.
Getir's journey demonstrates why this intelligence matters. The company grew rapidly during the pandemic, reached a reported $12 billion valuation, and then retreated from major international markets in 2024 to concentrate on Turkey.
For retailers, brands, investors, and market researchers, Quick commerce intelligence report using Getir data can provide a practical framework for understanding how the sector changes over time.
The goal is not simply to collect grocery listings. The goal is to convert product-level observations into actionable intelligence.
Build your quick-commerce intelligence pipeline with Real Data API and turn Getir market data into scalable pricing, promotion, assortment, and competitive insights!
Latest posts

Zara Web Data Scraper For Fashion Trend Analysis - How Retailers Overcome Fast-Changing Fashion Demand & Inventory Challenges

How Real Estate Web Scraping Using Bayut API Solves Rental Pricing and Property Tracking Problems?

How Trendyol Data Collection for Ecommerce Market Research Solves Assortment, Pricing, and Market Intelligence Challenges?
How Gemini Scraper For Real-Time Data Extraction Enables Faster Market Intelligence, Monitoring, and Competitive Analysis






.png)



