Quick Summary
- real-time food data scraping services help food brands continuously monitor products, prices, menus, promotions, availability, and competitor activity across digital food channels, reducing dependence on manual market research.
- A Food Scraping API converts changing food-market information into structured datasets that teams can use for pricing intelligence, assortment planning, trend analysis, competitor monitoring, and faster commercial decisions.
Introduction
Food brands struggle to make fast decisions when product, menu, price, and availability information changes across restaurants, marketplaces, grocery platforms, and delivery apps. real-time food data scraping services solve this visibility gap by converting fragmented online information into structured, comparable, and analysis-ready data.
The problem is not simply collecting more information. Commercial teams need the right information at the right frequency. A Food Scraping API can support automated collection while reducing repetitive research, helping pricing managers, restaurant groups, food manufacturers, marketplace teams, and competitive-intelligence analysts work from a consistent data layer.
The need for this capability has expanded as food commerce has moved toward digital ordering and omnichannel discovery. In India, foodservice e-commerce generated about US$10 billion in retail sales in 2024, up from US$3.1 billion in 2019, according to an Agriculture and Agri-Food Canada market overview citing Euromonitor data.
For a food brand, the business question is therefore straightforward: how can teams identify changes in competitor prices, product availability, menus, promotions, and customer-facing assortment before those changes affect sales or market position?
How Can Brands Build a Reliable View of a Changing Food Market?
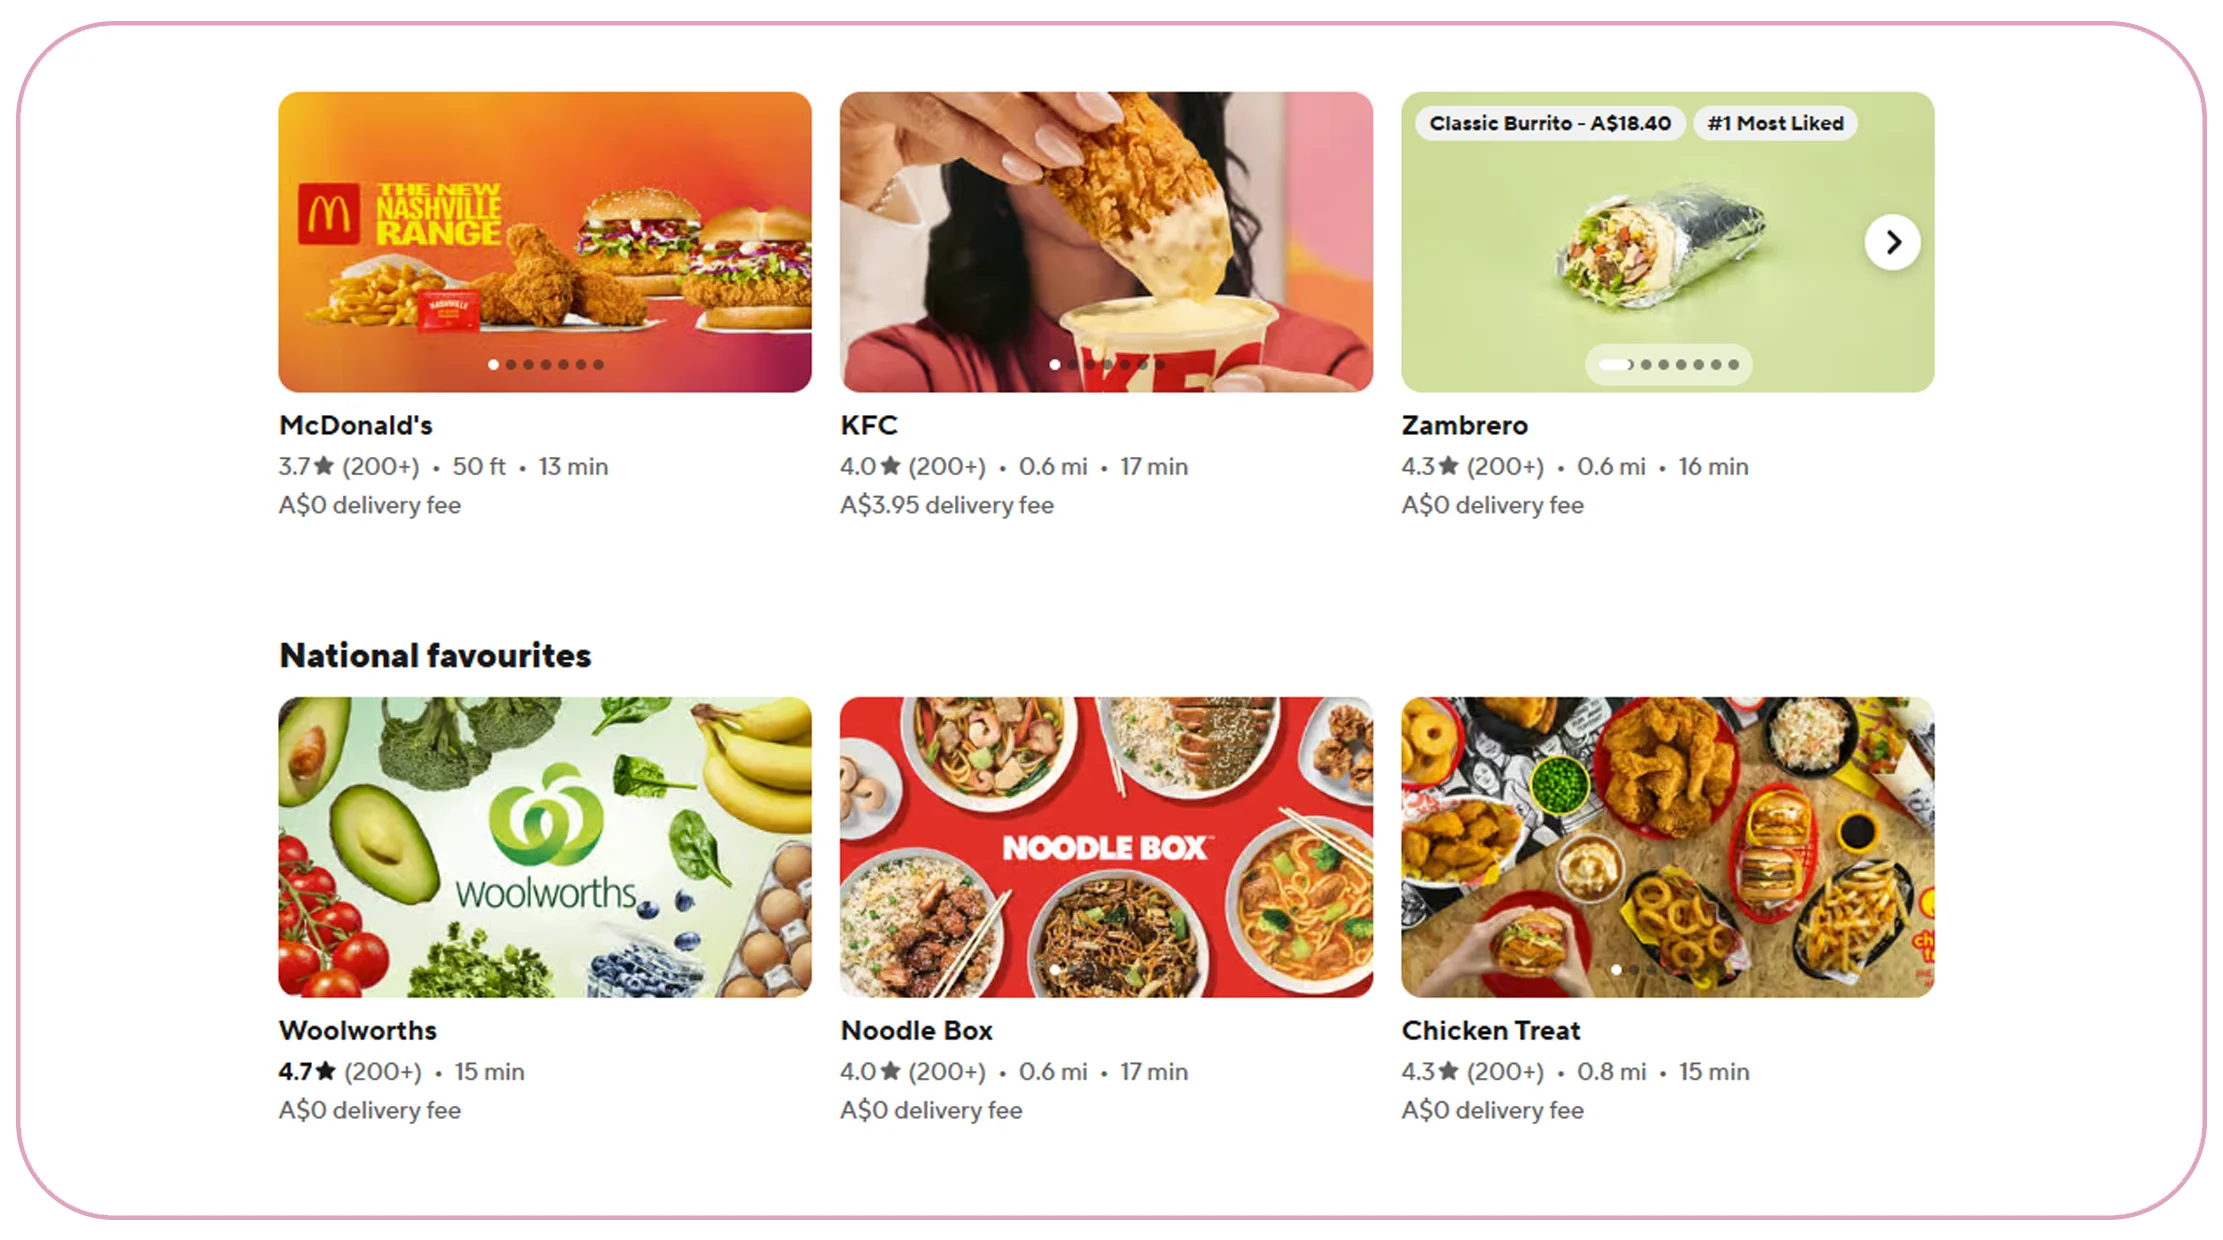
Food brands need a dependable way to collect information from multiple digital sources because individual websites and apps rarely present market information in a standardized format. One competitor may publish prices by product size, another by meal combination, while a delivery platform may show promotional pricing based on location or time.
food delivery data scraping services can help commercial teams bring these fragmented observations into a standardized dataset. Relevant fields can include restaurant name, cuisine, item name, category, price, discount, rating, review count, delivery information, location, availability, and timestamp.
The evolution from 2020 to 2026 illustrates why frequency matters. During 2020–2021, digital ordering became more important as consumers shifted toward online channels. From 2022–2023, businesses increasingly needed competitive visibility as physical and digital channels operated together. By 2024–2025, food delivery had become a significant commercial channel in markets such as India. The Agriculture and Agri-Food Canada report shows Indian delivery foodservice value rising from US$3.2 billion in 2019 to US$10.2 billion in 2024, representing 25.9% annual growth over that period.
Uber also reported that Delivery Gross Bookings reached $20.1 billion in Q4 2024, up 18% year over year, demonstrating the scale of digital food and delivery activity globally.
| Period | Market intelligence priority | Business requirement |
|---|---|---|
| 2020 | Digital availability | Identify online assortment |
| 2021 | Channel expansion | Track new digital listings |
| 2022 | Competitive normalization | Compare prices and promotions |
| 2023 | Omnichannel monitoring | Connect restaurant and delivery data |
| 2024 | Market acceleration | Increase monitoring frequency |
| 2025 | Real-time competition | Detect changes faster |
| 2026 | Predictive intelligence | Convert observations into actions |
For buyers, the key insight is that data frequency should follow business volatility. Fast-moving menu prices may require daily or hourly observation, while broader assortment benchmarking can often work with scheduled collection.
What Information Should Brands Capture From Restaurant Menus?
Menu intelligence is valuable because a menu is more than a list of dishes. It represents a restaurant's product strategy, pricing architecture, promotional positioning, and response to customer demand.
Brands can scrape restaurant menu data to identify changes in item names, portion sizes, meal combinations, prices, add-ons, dietary labels, categories, and promotional offers. This information can reveal whether competitors are introducing premium products, reducing prices, expanding healthy options, or adjusting menus around seasonal demand.
The 2020–2026 period changed how menu intelligence should be interpreted. In 2020, availability and digital presence were critical because restaurants were adapting to disrupted operating conditions. By 2021 and 2022, menu digitization became increasingly important as online ordering remained central to customer discovery. During 2023 and 2024, competitive teams could use digital menus to compare positioning across locations and platforms. In 2025–2026, the more advanced requirement is historical comparison: understanding not only what a menu looks like today but how it has changed.
India's foodservice e-commerce segment reached US$10.0 billion in 2024, while online ordering represented US$10.0 billion compared with US$50.5 billion in offline ordering, according to the cited Euromonitor-based market overview.
| Menu signal | What it can reveal | Commercial use |
|---|---|---|
| New item | Innovation activity | Product benchmarking |
| Price change | Pricing strategy | Competitive pricing |
| Combo introduction | Basket strategy | Offer optimization |
| Item removal | Portfolio rationalization | Assortment analysis |
| Portion change | Value strategy | Price-per-unit analysis |
| Category expansion | Demand opportunity | Product planning |
| Rating movement | Customer response | Quality monitoring |
The actionable opportunity is to connect menu snapshots over time. A single menu provides a current view; repeated observations create a competitive timeline.
Why Are Structured Food Data Interfaces Becoming Important?
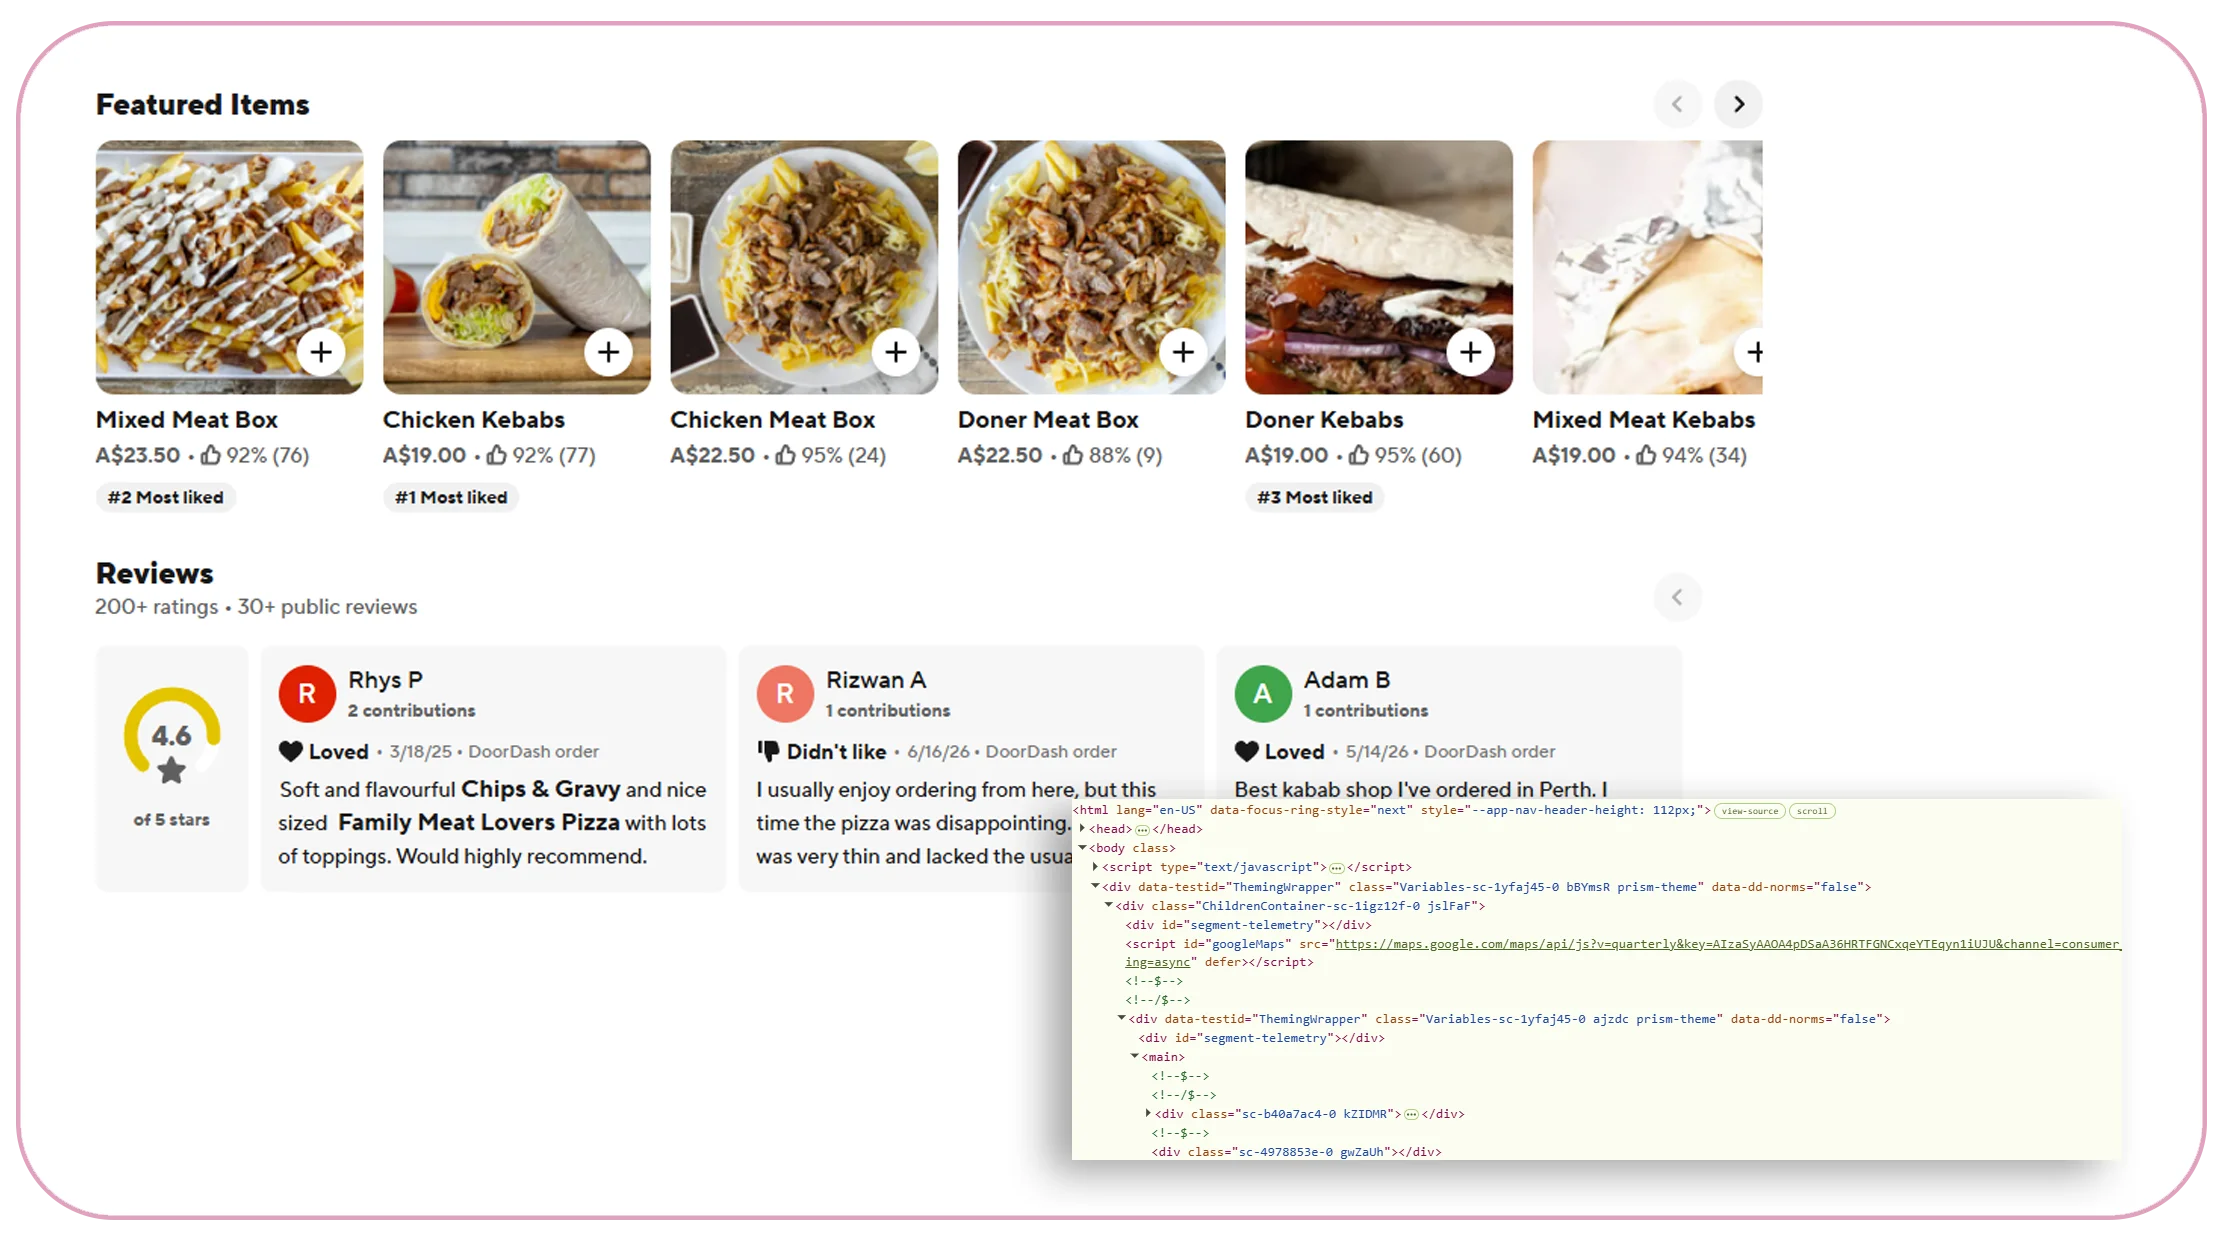
Food intelligence teams often collect information from restaurants, marketplaces, grocery websites, delivery platforms, and other digital sources. Without a standardized data structure, analysts spend significant time cleaning names, categories, prices, locations, and product identifiers before analysis can begin.
food data API services address this operational challenge by providing structured information that can be integrated into dashboards, databases, analytics platforms, or internal applications. The value is not simply technical access. It is the ability to create a repeatable pipeline from online observation to business action.
From 2020 through 2026, the commercial requirement evolved from basic digital presence monitoring toward continuous competitive intelligence. In 2020, teams primarily needed to understand whether products and menus were available online. By 2022, comparison across multiple platforms became more useful. In 2024, India's foodservice e-commerce sales reached US$10 billion, showing how important online food channels had become to the broader market. By 2025–2026, businesses increasingly need structured historical records to identify trends rather than manually review isolated pages.
| Data layer | Example fields | Business outcome |
|---|---|---|
| Product | Name, category, SKU | Assortment analysis |
| Pricing | List price, sale price | Price benchmarking |
| Availability | In-stock, unavailable | Supply monitoring |
| Location | City, area, postcode | Geographic intelligence |
| Reviews | Rating, review count | Customer sentiment proxy |
| Promotions | Discount, offer | Promotion comparison |
| Timestamp | Date and time | Trend analysis |
The strongest implementation combines structured collection with validation, deduplication, historical storage, and clear business rules.
Turn fragmented food-market information into structured intelligence with Real Data API and build a more responsive competitive-monitoring workflow!
Get Insights Now!How Can Brands Identify Pricing Changes Before They Affect Market Position?
Price changes can occur frequently and may differ by product, location, platform, promotion, package size, and time. Manual monitoring therefore creates a high risk of delayed or incomplete competitive intelligence.
food pricing data collection services help businesses capture price observations at defined intervals and compare them against historical records. Instead of asking only, "What is the competitor's price today?" teams can ask more useful questions: How often did the price change? Was the change promotional? Did competitors respond? Which locations showed the largest difference?
The progression from 2020 to 2026 makes historical pricing increasingly valuable. During 2020–2021, businesses dealt with major changes in purchasing behavior and channel availability. In 2022–2023, inflation and competitive pressure increased the importance of price monitoring. In 2024, Indian delivery foodservice reached US$10.2 billion, while online foodservice ordering reached approximately US$10.0 billion, according to Euromonitor data cited by Agriculture and Agri-Food Canada. By 2025–2026, pricing teams can increasingly combine historical observations with promotion calendars, competitor assortment, and location-level data.
| Pricing metric | What to monitor | Decision supported |
|---|---|---|
| Price index | Competitor vs. own price | Pricing strategy |
| Discount depth | Regular vs. promotional price | Promotion planning |
| Price frequency | Number of changes | Volatility assessment |
| Location variance | Same item across areas | Local pricing |
| Bundle value | Individual vs. combo price | Offer design |
| Historical movement | Price over time | Trend detection |
The key insight is to treat price as a time-series signal rather than a static field. This allows commercial teams to identify persistent pricing patterns instead of reacting to isolated changes.
How Does Automated Collection Improve Food Competitive Intelligence?
Food Data Scraping becomes strategically useful when collection is connected to a specific business question. Collecting thousands of records without defining the intended decision creates a large dataset but limited business value.
A stronger approach begins with the buyer persona. Pricing managers need competitive price movement. Product managers need assortment and menu changes. Restaurant operators need local competitor intelligence. Category managers need availability and promotional signals. Market researchers need historical datasets that reveal structural changes.
The 2020–2026 period demonstrates the increasing value of this approach. Early digital monitoring focused on presence and availability. Later, businesses needed broader competitive comparisons. In 2024, India's packaged food market reached US$104.5 billion in retail sales, while dairy alone represented US$31.7 billion, according to an Agriculture and Agri-Food Canada market overview citing Euromonitor. Such category scale makes manual competitor monitoring increasingly difficult.
| Buyer persona | Primary pain point | Useful intelligence |
|---|---|---|
| Pricing Manager | Slow price discovery | Competitor price movements |
| Category Manager | Assortment uncertainty | Product and menu changes |
| Restaurant Group | Local competition | Menu and offer comparison |
| Brand Manager | Market visibility | Promotions and positioning |
| Market Researcher | Fragmented information | Historical market datasets |
| E-commerce Manager | Digital shelf changes | Availability and assortment |
A practical workflow should collect, normalize, validate, timestamp, store, and analyze information. Businesses should also establish thresholds for action, such as a competitor price change above a defined percentage or repeated availability loss across monitored locations.
The objective is not to scrape everything. It is to capture the signals that can change a commercial decision.
How Can a Food Dashboard Turn Data Into Faster Decisions?
A Food Dashboard can convert thousands of individual observations into a visual decision layer for executives and operational teams. Instead of manually comparing websites, users can monitor price movements, assortment changes, availability, promotions, ratings, and geographic differences from a centralized interface.
The evolution from 2020 to 2026 also changes what dashboards should display. A 2020-style dashboard might focus on basic availability. A 2022 dashboard could emphasize competitive pricing. A 2024 dashboard could combine product, restaurant, and delivery information. A 2026 dashboard should ideally support historical comparisons, alerts, segmentation, and trend interpretation.
For example, a pricing manager could see that a competitor reduced the price of a high-volume product in three cities. A category manager could identify five newly launched menu items. A brand manager could see that a promotion appeared on one marketplace but not another. These are operational decisions enabled by structured observations.
| Dashboard view | KPI | Recommended action |
|---|---|---|
| Price monitor | Price variance | Review pricing |
| Availability monitor | Stock/listing rate | Investigate supply |
| Menu monitor | New/removed items | Review assortment |
| Promotion monitor | Discount depth | Benchmark offers |
| Location monitor | Geographic variance | Localize strategy |
| Trend monitor | Change frequency | Detect market movement |
Real Data API can support this workflow by helping businesses obtain structured, reusable information that can feed analytical systems. The objective should be a closed loop: collect data, detect change, interpret the signal, assign an owner, and measure the resulting business action.
Why Choose Real Data API?
Food intelligence projects often fail because data collection and business requirements are treated as separate activities. A strong provider should understand the fields decision-makers actually need and deliver information in a format that can be integrated into existing analytical workflows.
Real Data API is positioned around structured web data collection for businesses that need repeatable market intelligence. Its value for food-sector use cases lies in supporting scalable collection, structured outputs, historical records, data normalization, and workflows designed around specific commercial requirements.
Food Datasets can help organizations move beyond one-time research toward repeatable intelligence. Instead of conducting a manual competitor study every few weeks, teams can maintain historical records and compare market conditions over time.
For food brands, useful datasets can cover products, restaurants, menus, prices, promotions, ratings, reviews, locations, availability, and other relevant attributes. The exact schema should depend on the business question and monitoring frequency.
A practical evaluation should consider coverage, update frequency, data quality, historical availability, scalability, output formats, and integration requirements. Teams should also define success metrics before implementation, such as reduced research time, improved price visibility, faster competitive response, or broader market coverage.
The right data partner should therefore be evaluated not only on how much information it can collect but on how effectively that information can support a measurable business decision.
Conclusion
Food brands can no longer rely on occasional manual checks when product assortments, restaurant menus, prices, promotions, and availability change continuously across digital channels. real-time food data scraping services provide a practical foundation for monitoring these changes and converting them into structured competitive intelligence.
The most effective strategy is decision-led: identify the business problem, define the required data fields, establish collection frequency, normalize the information, preserve historical records, and connect important changes to measurable actions. The 2020–2026 shift toward digital food ordering makes this approach increasingly relevant as online channels become a larger part of food discovery and purchasing.
For pricing teams, the priority may be competitive price movement. For product teams, it may be assortment changes. For restaurant groups, it may be local menu intelligence. For executives, it may be a consolidated view of market movement.
Partner with Real Data API to build structured food intelligence workflows that help your team monitor market changes, identify competitive opportunities, and make faster data-driven decisions!
FAQs
1. What are the benefits of real-time food data scraping services?
They help brands continuously monitor product prices, menus, promotions, availability, and competitors, enabling faster pricing, assortment, market research, and competitive-intelligence decisions.
2. How does a Food Scraping API help businesses?
A Food Scraping API delivers structured food information that teams can integrate into databases, dashboards, analytics systems, and automated workflows for repeatable market monitoring.
3. When should brands use food delivery data scraping services?
Brands should use them when they need frequent visibility into restaurant listings, delivery-platform prices, menus, promotions, availability, locations, and competitive changes across digital channels.
4. What information can businesses scrape restaurant menu data for?
Businesses can capture menu names, categories, prices, descriptions, sizes, combinations, add-ons, availability, ratings, promotions, and location-specific differences for competitive analysis and product planning.
5. How can food data API services support market research?
They can provide structured, repeatable datasets that help researchers compare products, prices, menus, promotions, availability, and market changes across competitors, locations, platforms, and time periods.
Latest posts
Why Sainsbury's grocery data web scraper Is Essential for Smarter Grocery Pricing and Product Intelligence
How Talabat Scraper Helps Brands Monitor Talabat Listings, Discounts, Reviews, and Availability at Scale
How Twitter Scraper Enables Faster Social Media Data Collection for Trend, Competitor, Audience Intelligence, and Social Media Data Collection
How Trip.com travel dataset Helps Brands Track Hotel Prices, Reviews, Availability, and Competitor Trends






.png)



