Quick Summary
- Sainsbury's grocery data web scraper helps grocery businesses address the challenge of tracking changing prices, product ranges, promotions, and availability across a large digital assortment.
- A Grocery Scraping API can turn recurring product observations into structured datasets, enabling pricing teams, category managers, retailers, and analysts to identify market movements faster and make better assortment and competitive decisions.
Introduction
Grocery businesses operate in a market where prices, promotions, product ranges, and availability can change frequently. Sainsbury's grocery data web scraper can help businesses transform publicly available grocery information into structured intelligence for competitive pricing, assortment analysis, availability monitoring, and market research. The core business problem is simple: manually checking hundreds or thousands of grocery products cannot provide the speed, consistency, or historical visibility required for modern retail decisions.
Sainsbury's Scraper own results illustrate the scale and importance of its grocery operation. For the 52 weeks ending 1 March 2025, Sainsbury's grocery sales reached £24.777 billion, up 4.5% from £23.699 billion a year earlier. Its 2025 report also stated that online grocery sales increased 7% year over year. (Sainsbury's)
For retailers, brands, pricing teams, and category managers, this creates a valuable intelligence opportunity. Product-level monitoring can help answer practical questions: Which products changed price? Which promotions appeared or disappeared? Which products became unavailable? How did assortment change? Where are competitors positioned differently?
Why Is Grocery Pricing Intelligence Becoming a Business Priority?
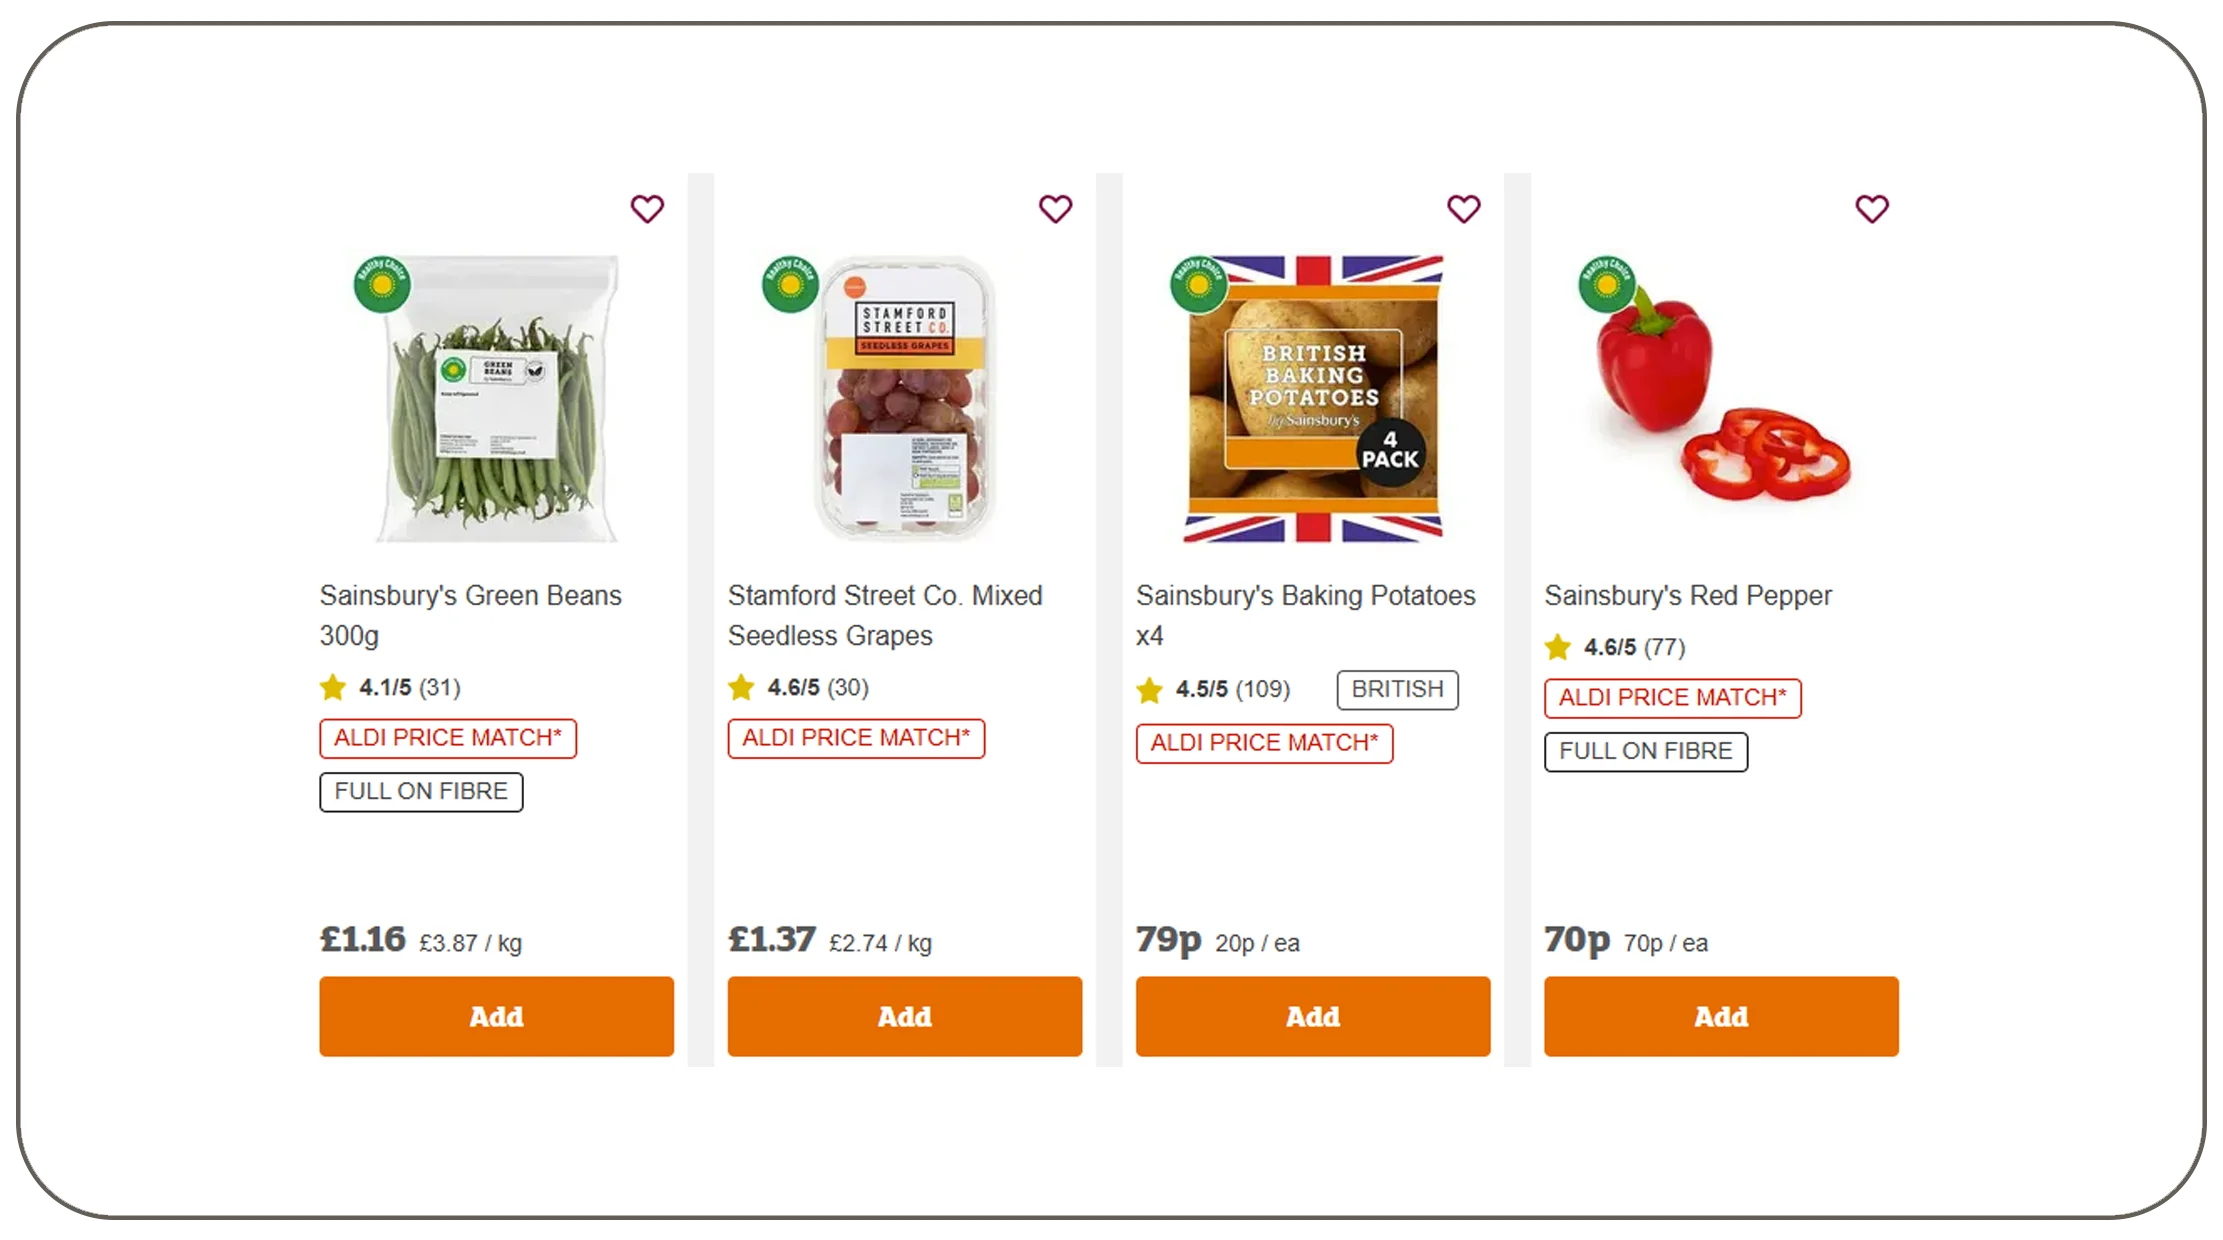
The first challenge is pricing volatility. Grocery businesses need to understand not only their own prices but also how competing retailers position similar products. A manual analyst may be able to check a small selection of products, but that approach becomes inefficient when the objective is to monitor thousands of SKUs repeatedly.
This is particularly important because price competition is closely connected to customer perception. Sainsbury's has highlighted its investment in value, including more than £1 billion invested in lowering prices over four years. It also reported that customers saved more than £2 billion through Nectar Prices during 2024/25, with more than 9,000 offers available. (Sainsbury's)
For a pricing or category team, this means that a single product price is not enough. Analysts need context around promotions, pack sizes, brands, categories, competing products, and historical price movements.
What Happens When Businesses Rely on Manual Monitoring?
| Business Problem | Manual Impact | Data-Led Approach | Business Benefit |
|---|---|---|---|
| Frequent price changes | Delayed detection | Scheduled monitoring | Faster price intelligence |
| Promotional changes | Difficult to track historically | Time-stamped records | Better promotion analysis |
| Product availability | Manual checks are inconsistent | Recurring availability checks | Better stock visibility |
| Assortment changes | Difficult to identify | Product-level comparison | Improved assortment intelligence |
| Competitor benchmarking | Limited SKU coverage | Scalable collection | Broader market visibility |
2020–2026 Evolution
Between 2020 and 2021, grocery shopping behavior changed sharply as consumers moved toward online purchasing. Sainsbury's reported grocery sales growth of 7.8% in 2020/21 and digital sales growth of 102%; its online grocery sales increased 120%, with more than 850,000 online orders fulfilled each week. (Sainsbury's) In 2021/22, online grocery demand remained more than double pre-pandemic levels, while online represented 17% of grocery sales. (Sainsbury's) By 2024/25, online grocery sales were still growing, increasing 7% year over year. (Sainsbury's) In 2025/26, Sainsbury's reported grocery sales of £24.256 billion and online grocery sales growth of 13%. (Sainsbury's) This progression shows why recurring digital shelf monitoring has become increasingly important for grocery businesses.
How Can Businesses Build a Reliable Product Intelligence Pipeline?
The next challenge is product visibility. Grocery businesses may need to monitor product names, brands, categories, pack sizes, prices, discounts, promotions, ratings, URLs, and availability indicators. Collecting these attributes manually creates fragmented spreadsheets that are difficult to refresh and compare.
A structured workflow designed to extract Sainsbury's grocery data can provide a consistent product-level view. The objective is not simply to collect more records. The objective is to create a standardized dataset where each product can be identified and compared across collection periods.
For example, a category manager monitoring breakfast cereals could compare brand, pack size, current price, promotional price, availability, and product positioning across multiple collection dates. This makes it possible to distinguish between a genuine price movement and a change caused by pack-size variation.
A strong pipeline should include source discovery, field mapping, extraction, normalization, validation, duplicate handling, timestamping, and structured delivery. Product identifiers should be retained wherever accessible so historical observations can be linked to the correct item.
Which Product Fields Matter Most?
| Data Field | Business Question |
|---|---|
| Product name | What product is being sold? |
| Brand | Which brands compete in the category? |
| Category | Where is the product positioned? |
| Pack size | Is the comparison like-for-like? |
| Current price | What is the current price position? |
| Promotional price | What offer is active? |
| Availability | Can customers currently purchase it? |
| Product URL | Where can the record be verified? |
| Collection timestamp | When was the information observed? |
| Product identifier | How can historical records be matched? |
2020–2026 Evolution
In 2020, digital grocery expanded rapidly as retailers responded to unprecedented demand. Sainsbury's reported that online grocery sales increased 120% in 2020/21 and that 17% of grocery sales had moved online, compared with 8% in 2019/20. (Sainsbury's) In 2021/22, the company continued to report online grocery at 17% of grocery sales, with an average of 690,000 orders per week. (Sainsbury's) By 2024/25, online grocery sales grew another 7%, supported by improvements in digital product presentation and customer experience. (Sainsbury's) In 2025/26, online grocery sales increased 13%, while Sainsbury's continued investing in digital experiences and AI-led personalization. (Sainsbury's) The business lesson is clear: as digital grocery becomes more sophisticated, product-level data needs to become equally structured.
Want structured grocery intelligence for pricing and product analysis? Talk to Real Data API about a customized data collection solution!
Get Insights Now!What Can Historical Price Data Reveal About Grocery Competition?
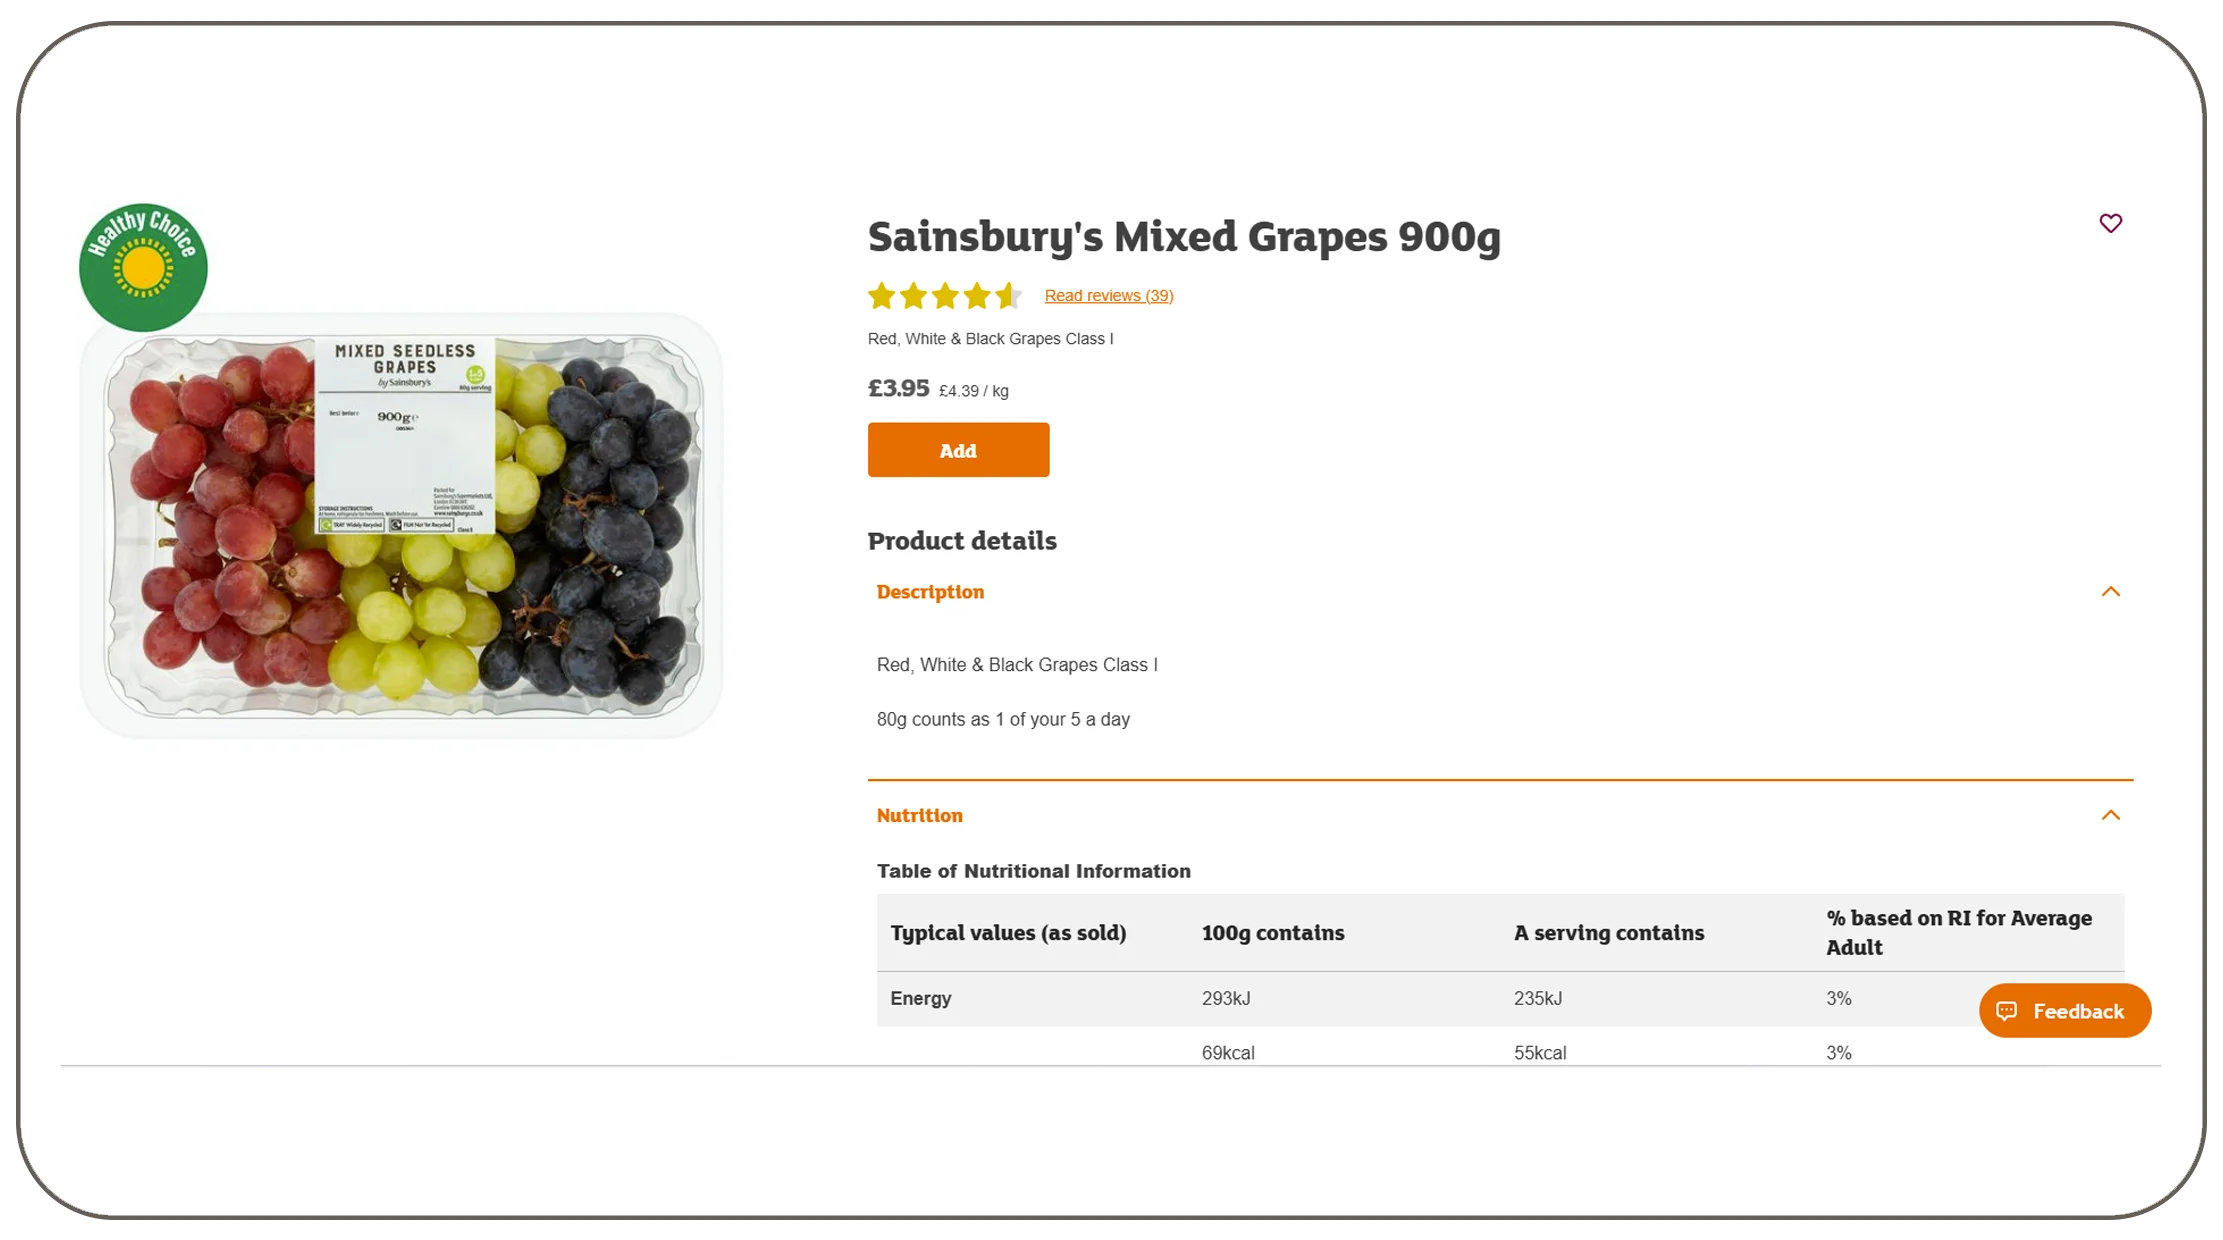
Price monitoring becomes more valuable when businesses maintain historical records rather than looking at isolated snapshots. A retailer may know that a product currently costs £3.50, but that figure becomes much more meaningful when compared with its price last week, last month, or during a previous promotional cycle.
A Sainsbury's price data API can support a structured approach to recurring price intelligence by delivering standardized price observations into analytics workflows. The important business outcome is not simply access to prices; it is the ability to transform repeated observations into measurable trends.
For example, a pricing manager can establish a competitive price index for selected grocery categories. Category managers can identify products with persistent price gaps, while procurement teams can examine how promotional pricing changes over time.
Price intelligence can also support margin and promotion analysis. A business can compare regular price, promotional price, pack size, and historical observations to identify whether a promotion represents a meaningful price change or simply a temporary campaign.
How Should Businesses Analyze Price Movements?
| Price Signal | What It Can Show | Potential Decision |
|---|---|---|
| Regular price change | Long-term positioning | Reassess price strategy |
| Promotional price | Short-term competitiveness | Evaluate campaign response |
| Price gap | Relative market position | Review competitive pricing |
| Pack-size variation | Unit economics | Normalize comparisons |
| Repeated discounts | Promotion frequency | Assess promotional strategy |
| Historical trend | Price direction | Support forecasting |
2020–2026 Evolution
Sainsbury's 2020/21 results demonstrated the importance of grocery pricing during a period of exceptional demand and changing consumer behavior. Grocery sales grew 7.8%, while the company emphasized value and availability. (Sainsbury's) In 2021/22, Sainsbury's stated that investment in grocery prices contributed to strong grocery volume market-share performance. (Sainsbury's) In 2024/25, the retailer said it had invested more than £1 billion in prices over four years and expanded value mechanisms such as Aldi Price Match and Nectar Prices. (Sainsbury's) In 2025/26, grocery sales increased 5.2% on a total-sales basis, while Sainsbury's said it had reached its highest food-volume market share in ten years. (Sainsbury's) These developments demonstrate why historical price intelligence is increasingly useful for grocery strategy.
How Can Retailers Detect Availability Problems Earlier?
Price intelligence alone cannot explain the complete customer experience. A product can have a competitive price but still fail to generate sales if it is unavailable. For this reason, scrape Sainsbury's availability data can be valuable for businesses investigating stock visibility, assortment gaps, and digital shelf performance.
Availability information can help businesses determine whether a product is consistently visible, temporarily unavailable, or showing a recurring pattern of stock disruption. When collected alongside price and product information, these signals create a more complete picture of marketplace conditions.
Consider a brand monitoring 500 products. If 30 products repeatedly become unavailable, the business can investigate whether the issue is category-specific, regional, promotional, or related to supply. A one-time snapshot would not reveal the pattern.
What Availability KPIs Should Teams Track?
| KPI | Purpose |
|---|---|
| Availability rate | Measures the proportion of monitored products available |
| Out-of-stock frequency | Identifies recurring availability problems |
| Availability duration | Shows how long products remain unavailable |
| Category availability | Highlights category-level gaps |
| Product-level availability | Identifies specific SKU issues |
| Change frequency | Shows how often availability status changes |
2020–2026 Evolution
Availability became particularly important during the 2020 grocery disruption, when retailers faced unprecedented demand and supply-chain pressure. Sainsbury's reported exceptional online demand and more than 850,000 online orders a week in 2020/21. (Sainsbury's) In 2021/22, the company continued to focus on improved picking rates, delivery efficiency, and online fulfillment. (Sainsbury's) By 2024/25, Sainsbury's said improved online availability was recognized by customers, while online grocery sales increased 7%. (Sainsbury's) In 2025/26, online grocery sales grew 13% and OnDemand sales increased 69% to more than £700 million, covering 70% of the UK population. (Sainsbury's) As fulfillment becomes faster, availability monitoring becomes increasingly important because customers expect products to be both visible and purchasable.
How Does Real-Time Grocery Intelligence Improve Retail Decisions?
Modern grocery teams increasingly need timely information rather than monthly reports. real-time Sainsbury's supermarket data can help decision-makers monitor rapidly changing product, price, promotional, and availability signals when their business requires frequent updates.
The definition of "real time" should be aligned with the use case. A strategic assortment review may require daily data, while a highly competitive pricing operation could require substantially more frequent observations. The correct frequency depends on the rate of change, business objectives, and cost of monitoring.
For example, a pricing team can use frequent observations to identify significant price movements. A brand manager can monitor whether key products remain visible. A market researcher can use historical records to identify seasonal patterns.
Which Teams Benefit From Timely Grocery Data?
| Business Team | Use Case |
|---|---|
| Pricing | Competitive price benchmarking |
| Category Management | Assortment comparison |
| E-commerce | Digital shelf monitoring |
| Marketing | Promotion tracking |
| Procurement | Supplier and category analysis |
| Market Research | Market trend analysis |
| Business Intelligence | Dashboard development |
2020–2026 Evolution
The transition from store-led to omnichannel grocery accelerated in 2020, when Sainsbury's digital sales increased 102%. (Sainsbury's) In 2021/22, 39% of Sainsbury's overall sales came through digital channels, compared with 23% in 2019/20. (Sainsbury's) By 2024/25, online grocery sales had grown 7%, while OnDemand expanded to more than 1,200 locations and served more than 65% of the population through the channel. (Sainsbury's) In 2025/26, OnDemand sales rose 69% to more than £700 million and coverage reached 70% of the UK population. (Sainsbury's) The shift shows why businesses increasingly need timely digital shelf intelligence rather than periodic manual research.
How Can Automated Monitoring Reduce Grocery Research Workloads?
A major operational problem for grocery businesses is repetitive research. Analysts may spend hours checking product pages, copying prices, recording promotional information, and comparing availability. As product coverage increases, the workload grows almost linearly unless the process is automated.
A Sainsbury's Scraper can be incorporated into a structured workflow to automate recurring product observation and organize records according to predefined fields. The business benefit is not simply automation. It is the ability to make monitoring repeatable.
A category manager can define a list of products and categories to monitor. The workflow can collect the required attributes, standardize the records, validate fields, and deliver the information into a database or analytics environment. Historical observations can then be compared to identify meaningful changes.
The workflow should also include quality controls. Data validation can identify missing fields, unexpected values, duplicate products, and structural changes. Monitoring rules can flag significant deviations for human review.
What Does an Automated Workflow Look Like?
| Stage | Activity | Business Output |
|---|---|---|
| Scope | Select products and categories | Monitoring universe |
| Collection | Capture required fields | Raw observations |
| Normalization | Standardize values | Comparable records |
| Validation | Check data quality | Cleaner dataset |
| Historical storage | Retain timestamps | Trend visibility |
| Analysis | Compare observations | Business insights |
| Alerts | Flag important changes | Faster response |
2020–2026 Evolution
Sainsbury's 2020/21 results showed how quickly online grocery operations could scale, with more than 850,000 online orders fulfilled each week. (Sainsbury's) By 2021/22, the company was averaging 690,000 online orders per week and continuing to improve fulfillment productivity. (Sainsbury's) In 2024/25, Sainsbury's highlighted improvements to the online customer journey, including better product range presentation and more relevant suggested basket additions. (Sainsbury's) In 2025/26, the company said it was joining its online grocery, ChopChop, and SmartShop apps into one coherent app to create a foundation for personalization and AI-led experiences. (Sainsbury's) As digital operations become more automated, external market monitoring must also become scalable.
What Should a Useful Grocery Dataset Contain?
A successful grocery intelligence program depends on data structure. A collection containing product names and prices alone may not answer the business questions that pricing and category teams need to solve.
A sainsbury's grocery dataset should be designed around the intended analytical use case. For pricing intelligence, the dataset may require product identifiers, brand, category, pack size, regular price, promotional price, discount information, and collection timestamp. For availability analysis, availability status and historical observations become essential.
The dataset should also support historical comparison. Each record needs a timestamp so analysts can determine when an observation was captured. Where possible, stable identifiers should connect multiple observations to the same product.
This structure allows businesses to create dashboards showing price changes, availability rates, assortment movements, promotional activity, and category-level trends.
Example Dataset Structure
| Field | Example Business Use |
|---|---|
| Product ID | Historical product matching |
| Product Name | Product identification |
| Brand | Brand comparison |
| Category | Category intelligence |
| Pack Size | Like-for-like analysis |
| Price | Price benchmarking |
| Promotion | Promotional monitoring |
| Availability | Stock visibility |
| URL | Source verification |
| Timestamp | Historical analysis |
2020–2026 Evolution
Sainsbury's digital grocery expansion during 2020/21 demonstrated why structured datasets became increasingly valuable for online retail analysis. Grocery sales rose 7.8%, while digital sales increased 102%. (Sainsbury's) In 2021/22, 17% of grocery sales were online, with digital channels representing 39% of total business sales. (Sainsbury's) By 2024/25, grocery sales reached £24.777 billion and online grocery sales increased 7%. (Sainsbury's) In 2025/26, Sainsbury's reported £24.256 billion in grocery sales and 13% online grocery sales growth. (Sainsbury's) The progression demonstrates why historical, structured grocery datasets are increasingly useful for understanding digital retail markets.
Why Choose Real Data API?
Real Data API helps businesses build structured data workflows around clearly defined commercial objectives. The focus is not simply on collecting large volumes of records but on creating datasets that can support pricing intelligence, product monitoring, competitive analysis, assortment research, and availability tracking.
Businesses can define the products, categories, attributes, frequency, and delivery format required for their specific use case. Data can then be collected, normalized, validated, and organized for downstream analytics. This reduces the operational burden associated with manually checking product information and maintaining disconnected spreadsheets.
A major advantage is scalability. A monitoring project can begin with a focused product universe and expand as business requirements grow. Historical data can also support trend analysis, allowing teams to compare observations across collection periods rather than relying on isolated snapshots.
Real Data API can support retailers, brands, category managers, market researchers, pricing teams, and business intelligence professionals that need repeatable grocery intelligence workflows.
The broader value comes from connecting data collection with business outcomes. A well-designed workflow can help teams improve monitoring frequency, increase product coverage, identify pricing changes sooner, analyze availability patterns, and build stronger competitive intelligence.
For businesses evaluating Grocery Datasets, the objective should always be clear: collect the data required to answer a specific commercial question, validate it properly, retain historical context, and make it accessible to the people responsible for decisions.
How Should Businesses Implement Grocery Intelligence?
A practical implementation starts with the business question. Pricing teams may want to identify competitive price gaps, while category managers may want to monitor assortment changes. E-commerce teams may focus on availability and digital shelf visibility.
The next step is defining the monitoring universe. Businesses should identify categories, products, brands, pack sizes, and attributes that matter. This prevents unnecessary data collection and keeps the project aligned with business objectives.
The data workflow should then establish collection frequency, validation rules, historical storage, and delivery formats. Dashboards can be created once sufficient historical data has accumulated.
Recommended KPI Framework
| KPI | What It Measures |
|---|---|
| Price change detection rate | How quickly price movements are identified |
| Availability rate | Percentage of monitored products available |
| Data accuracy | Reliability of collected records |
| Monitoring frequency | How often products are observed |
| Coverage | Percentage of target assortment monitored |
| Response time | Time between change detection and action |
| Competitive price gap | Difference versus benchmark prices |
| Assortment visibility | Coverage of relevant products and categories |
The most important principle is to connect each KPI to a business decision. Data collection should lead to action, whether that means changing a price, reviewing an assortment, investigating an availability issue, adjusting a promotion, or identifying a new market opportunity.
What Are the Common Challenges and How Can Businesses Overcome Them?
Data quality is the first challenge. Product pages can change structure, fields can become unavailable, and product information may vary between collection periods. Automated validation and monitoring are therefore necessary.
The second challenge is product matching. Similar products may have different pack sizes, promotional prices, or descriptions. Businesses should use stable identifiers where available and apply normalization rules before making comparisons.
The third challenge is frequency. Collecting data too infrequently can miss important changes, while collecting too frequently can increase unnecessary processing. The right schedule should reflect the commercial importance and volatility of each category.
The fourth challenge is interpretation. A price change does not automatically mean a competitor has changed its strategy. Businesses need historical context and supporting attributes before drawing conclusions.
Finally, responsible data collection matters. Organizations should use publicly accessible or authorized information and comply with applicable laws, contractual requirements, website terms, and privacy obligations.
Conclusion
Grocery businesses need more than isolated product information to make informed pricing and assortment decisions. They need structured, historical, and consistently monitored intelligence that connects product, price, promotion, and availability signals. Sainsbury's grocery data web scraper can support this objective by helping businesses create recurring product intelligence workflows designed around specific commercial questions.
The opportunity extends beyond monitoring. With properly structured data, pricing teams can benchmark competitive positions, category managers can identify assortment changes, e-commerce teams can monitor availability, and market researchers can analyze longer-term trends.
Real Data API can help businesses turn recurring grocery observations into analytics-ready intelligence through customized collection, normalization, validation, and delivery workflows.
Ready to improve grocery pricing and product intelligence? Contact Real Data API to build a customized grocery data solution aligned with your products, categories, KPIs, and monitoring requirements!
FAQs
1. What is a grocery data scraper used for?
A Sainsbury's grocery data web scraper can collect permitted product information such as prices, categories, pack sizes, promotions, and availability to support competitive analysis and retail intelligence.
2. Can grocery data be collected through an API?
Yes. A Grocery Scraping API can provide structured product observations for analytics workflows, helping businesses automate recurring collection and reduce manual research across large grocery assortments.
3. What information can businesses collect?
Businesses can extract Sainsbury's grocery data including product names, brands, categories, prices, promotional information, pack sizes, availability, URLs, and timestamps where publicly accessible and permitted.
4. Why monitor grocery prices?
A Sainsbury's price data API can support recurring price intelligence, helping pricing teams identify changes, compare historical observations, benchmark categories, and investigate competitive pricing movements more efficiently.
5. How does availability monitoring help retailers?
Businesses can scrape Sainsbury's availability data to identify recurring product availability patterns, assortment gaps, and changes that may affect digital shelf visibility and customer purchasing opportunities.
Latest posts
Why Sainsbury's grocery data web scraper Is Essential for Smarter Grocery Pricing and Product Intelligence
How Talabat Scraper Helps Brands Monitor Talabat Listings, Discounts, Reviews, and Availability at Scale
How Twitter Scraper Enables Faster Social Media Data Collection for Trend, Competitor, Audience Intelligence, and Social Media Data Collection

How Trip.com travel dataset Helps Brands Track Hotel Prices, Reviews, Availability, and Competitor Trends






.png)



