.gif)
.png)


Introduction
Real estate companies need current, structured property intelligence to understand pricing, inventory, competition, and demand. Realtor.com data extraction for real estate companies helps transform publicly available property listing information into organized datasets that can support market research, pricing analysis, investment decisions, and portfolio strategy. A Realtor.com Scraper can automate the collection of listing-level information such as asking price, property type, location, bedrooms, bathrooms, square footage, listing status, days on market, and other available attributes.
The need for timely intelligence has increased as the U.S. housing market has moved from pandemic-era scarcity toward a more balanced environment. Realtor.com's July 2026 forecast expects existing-home sales to reach 4.10 million, up 1.0% year over year, while median existing-home prices are projected to rise only 1.2%. For-sale inventory is forecast to increase 3.6%.
For real estate companies, these shifts make static market reports less useful. Decision-makers need granular information that can reveal differences between neighborhoods, property segments, price bands, and competing listings. Automated extraction can provide the foundation for that intelligence while reducing repetitive manual research.
| Indicator | 2020-2026 Market Context |
|---|---|
| 2020 | Pandemic disruption and unusually constrained housing supply |
| 2021 | Strong buyer demand and rapid price appreciation |
| 2022 | Higher mortgage rates began changing affordability |
| 2023 | Inventory remained constrained while affordability pressures persisted |
| 2024 | Existing-home sales reached a 29-year low at 4.06 million |
| 2025 | Inventory recovery accelerated, with Realtor.com reporting 15.2% annual inventory growth |
| 2026 | Price growth is forecast at 1.2%, with inventory growth at 3.6% |
The core value is not simply collecting more listings. It is converting property-level observations into repeatable intelligence that helps real estate companies identify what changed, where it changed, and what action should follow.
How can companies improve pricing decisions with live listing intelligence?
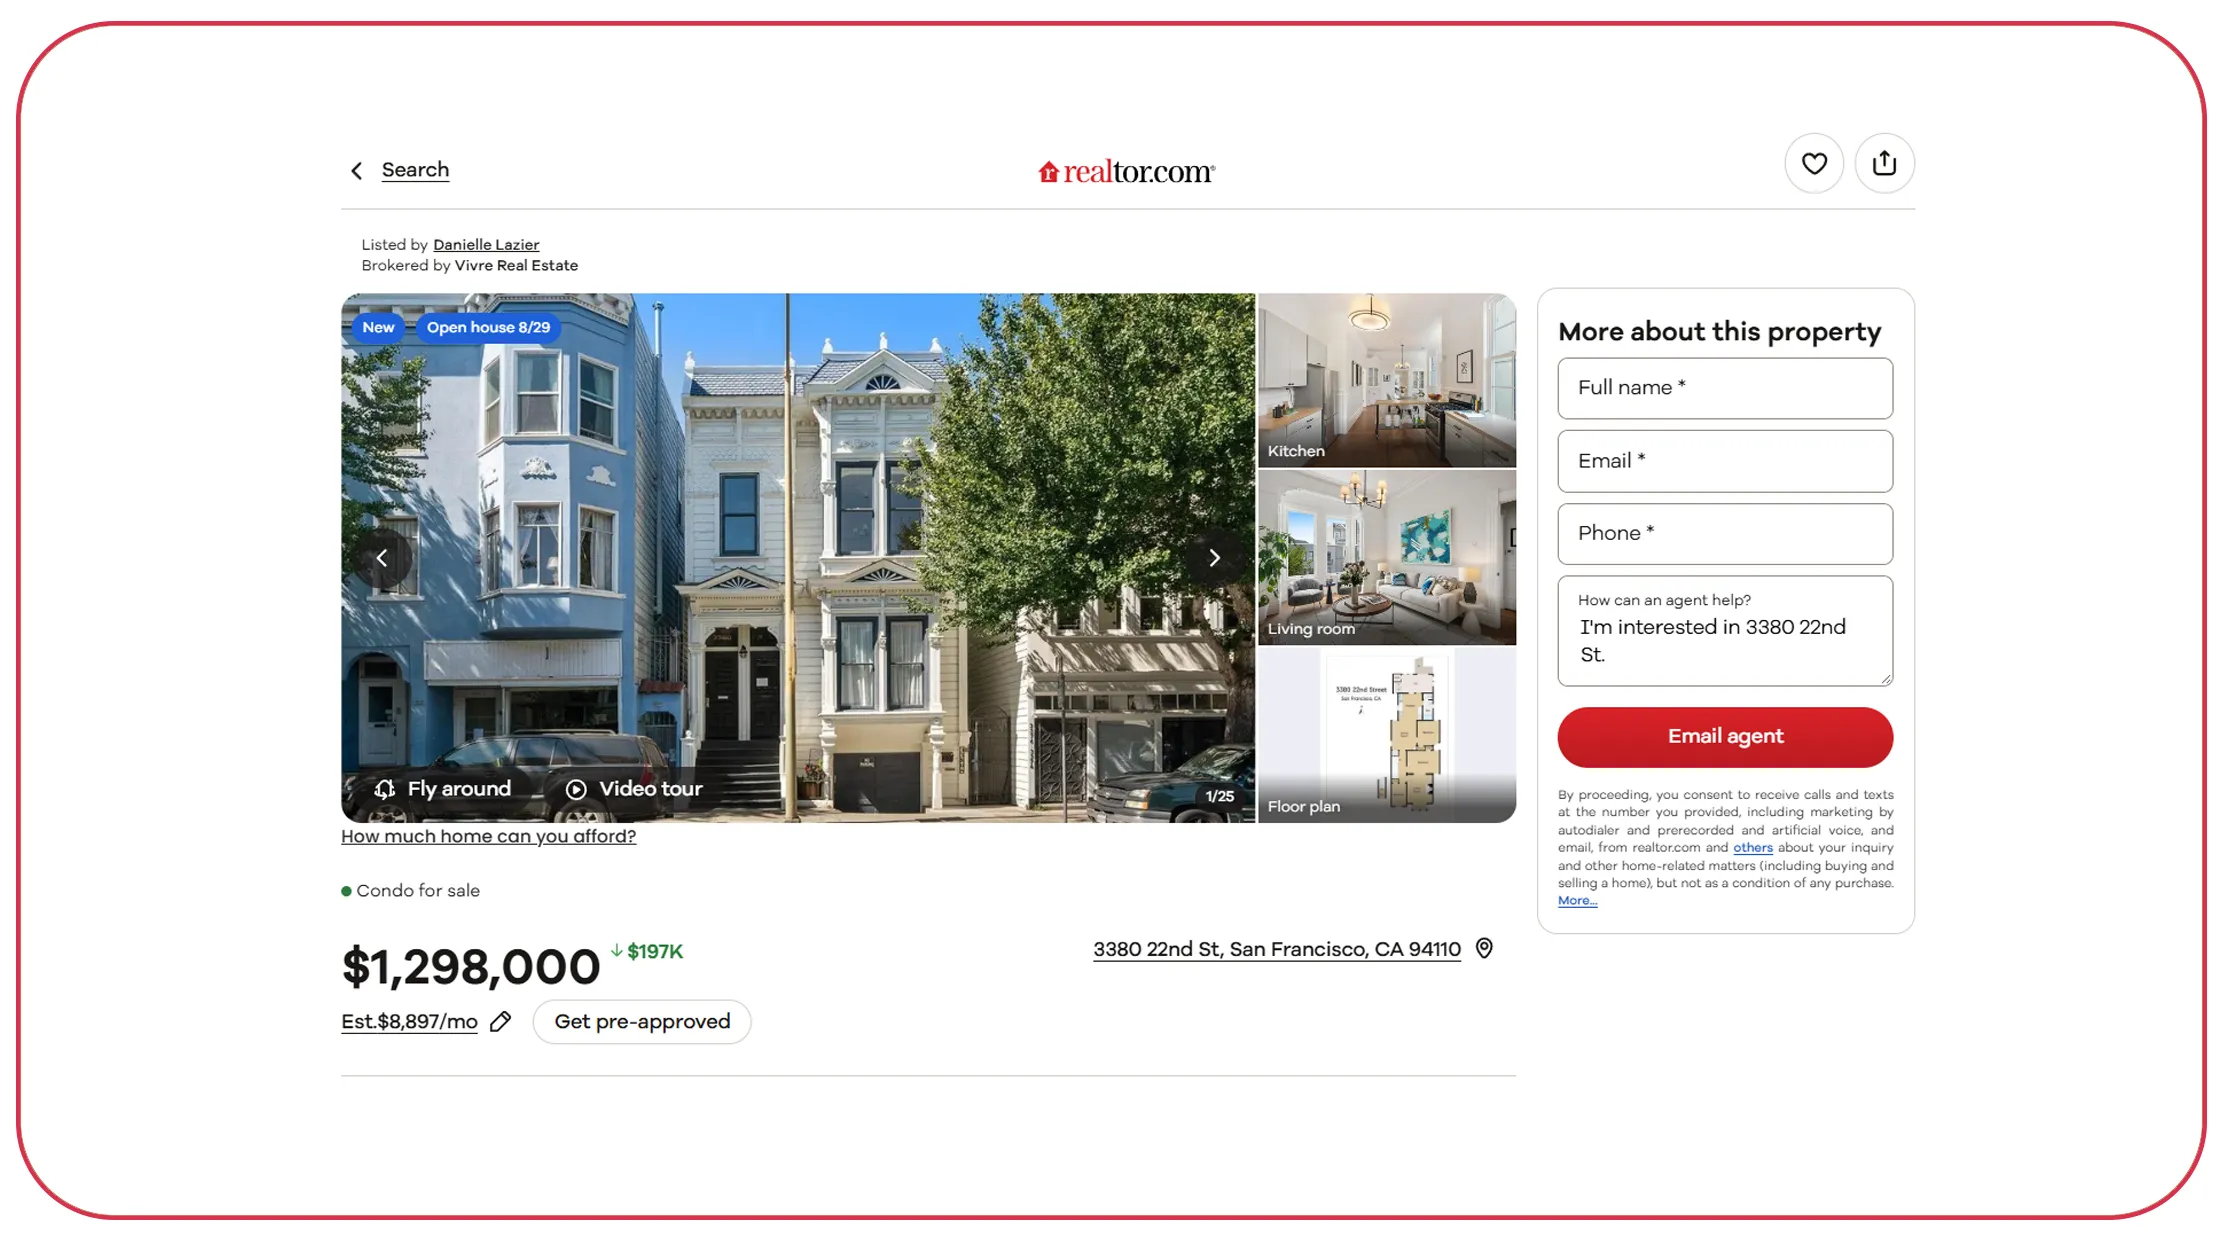
Real estate pricing becomes difficult when companies rely on outdated comparables or broad market averages. real-time Realtor.com property price data can support a more dynamic view of asking prices, property attributes, neighborhood competition, and listing activity. Instead of analyzing a market only once a month, companies can establish recurring collection workflows and compare snapshots over time.
For example, a brokerage evaluating a suburban market could monitor comparable properties across several ZIP codes. If similar three-bedroom homes begin appearing at lower asking prices while inventory rises, the company can flag potential softening before relying solely on a quarterly market report. Developers and investors can similarly compare price movements across property types and locations.
Realtor.com's 2026 midyear forecast illustrates why this matters. The platform revised expected existing-home price appreciation from 2.2% to 1.2%, while its forecast for for-sale inventory growth was revised to 3.6%.
| Year | Market Signal | Business Intelligence Implication |
|---|---|---|
| 2020 | Supply disruption | Track scarcity and price volatility |
| 2021 | Strong demand | Identify fast-moving submarkets |
| 2022 | Rate-driven affordability pressure | Reassess price sensitivity |
| 2023 | Limited inventory | Monitor competitive availability |
| 2024 | 4.06M existing-home sales | Identify low-turnover markets |
| 2025 | 15.2% inventory growth | Expand competitive monitoring |
| 2026 | 1.2% forecast price growth | Watch pricing pressure closely |
The actionable approach is to collect comparable listings consistently, normalize price and property attributes, calculate changes between snapshots, and create alerts for significant movements. This allows pricing teams to move from retrospective reporting toward continuous market monitoring.
How does automated research reveal local market opportunities?
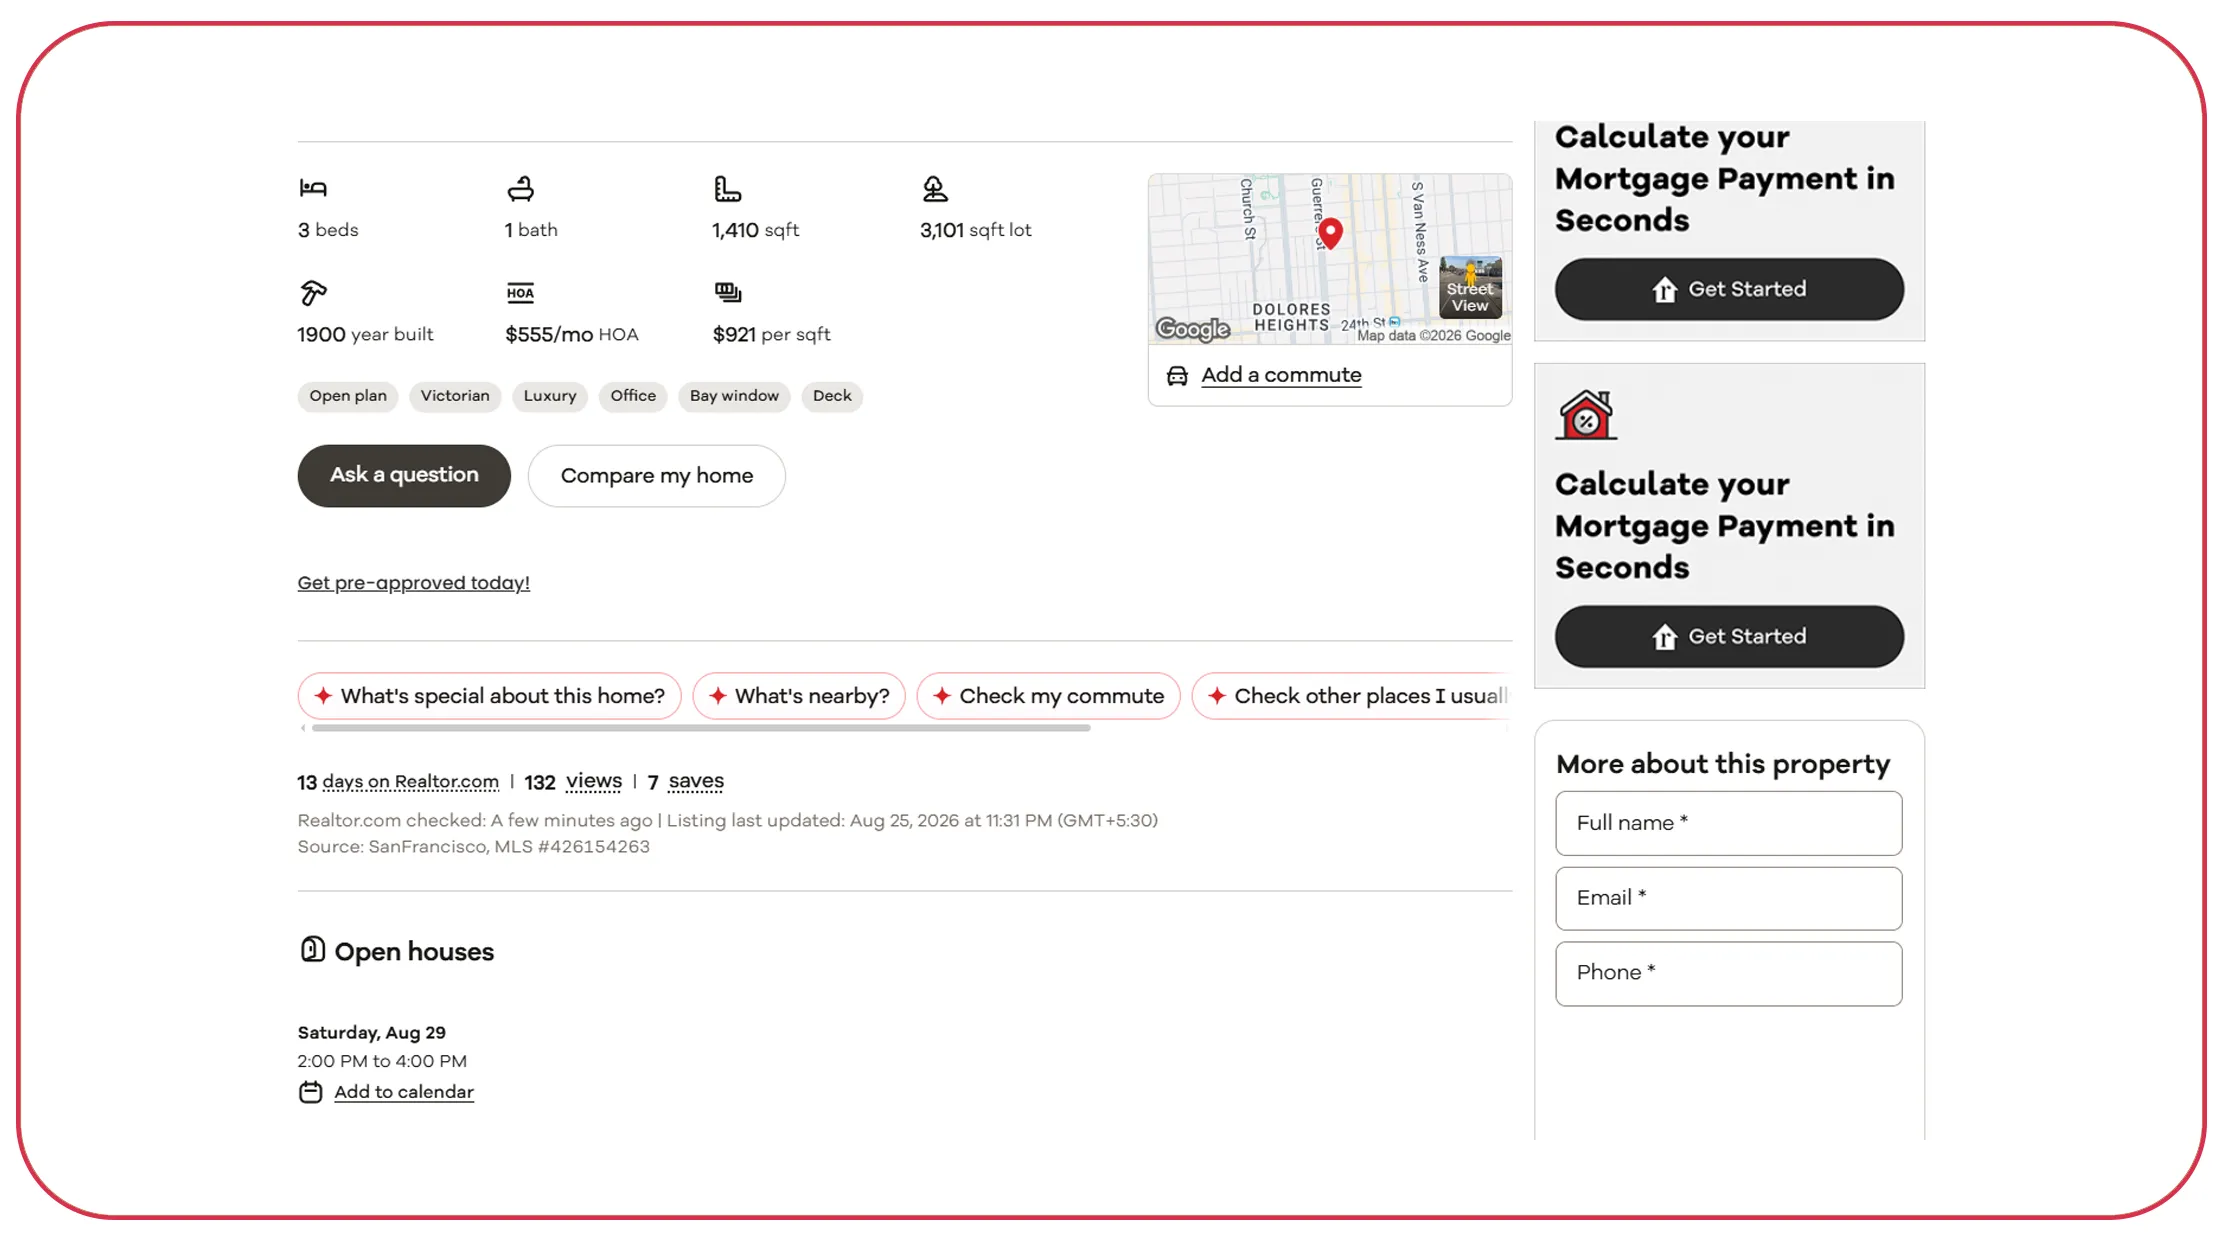
Market research often fails when datasets are too broad. National averages can hide substantial differences between cities, ZIP codes, neighborhoods, and property categories. A Realtor.com web data scraper for market research can help researchers build structured datasets around specific geographic and property criteria.
A real estate company can segment collected listings by location, price range, property type, bedroom count, square footage, listing status, and other available fields. The resulting dataset can be used to identify supply concentrations, pricing clusters, competitive gaps, and changing listing activity.
This becomes especially important because the 2026 market is not moving uniformly. Realtor.com's August 2026 research describes a K-shaped housing market in which entry-level and luxury segments are behaving differently, despite broader signs of market balance.
| Year | Research Focus | Potential Output |
|---|---|---|
| 2020 | Supply shock | Inventory baseline |
| 2021 | Demand acceleration | High-demand location mapping |
| 2022 | Affordability changes | Price-band analysis |
| 2023 | Competitive inventory | Neighborhood comparison |
| 2024 | Sales slowdown | Demand opportunity identification |
| 2025 | Inventory recovery | New competitive benchmarks |
| 2026 | Market segmentation | Segment-level opportunity mapping |
The strongest workflow combines automated collection with normalization and historical comparison. Researchers can create a recurring dataset rather than repeatedly starting from scratch.
For investors, this can help identify areas where listing prices remain attractive relative to nearby markets. For brokerages, it can reveal where competition is increasing. For property managers and developers, it can help compare supply and pricing across target locations.
The objective is therefore not merely to scrape listings. It is to create a research framework that turns changing property information into measurable market signals.
What can an extraction interface contribute to property analytics?
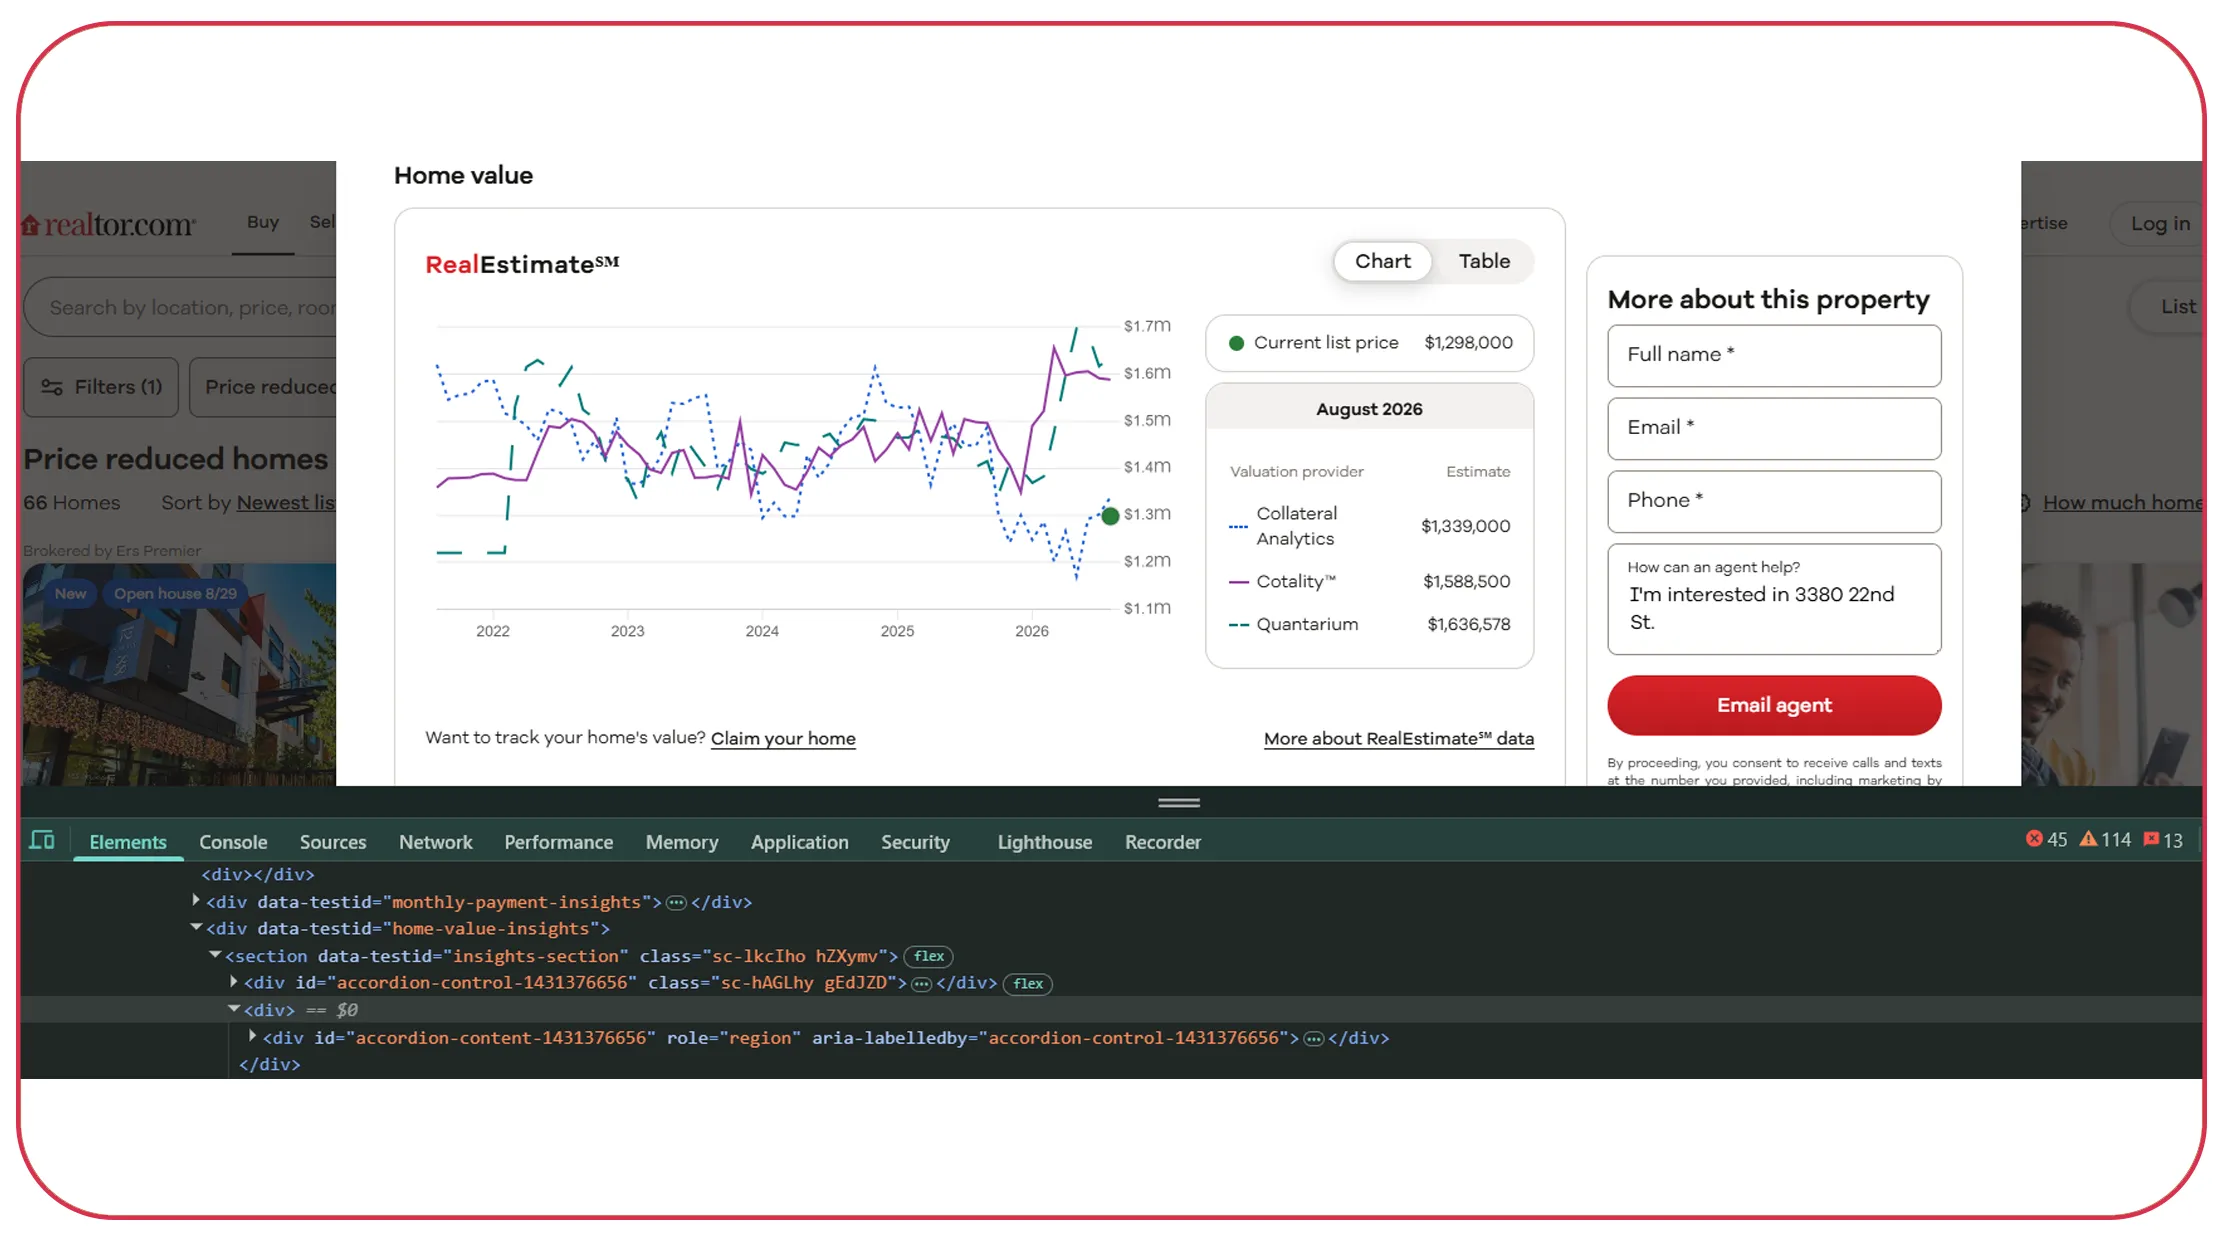
A structured Realtor.com API for property data extraction can make property intelligence easier to integrate into existing analytics environments. Instead of treating listing information as isolated research results, companies can feed normalized property records into databases, dashboards, business intelligence systems, or internal analytical workflows.
A useful extraction architecture can capture fields such as listing URL, property address, asking price, property type, bedrooms, bathrooms, square footage, location, listing status, and timestamps where available. Historical snapshots can then be compared to identify changes in price, availability, and competitive positioning.
The business case is strengthened by the market's current transition. Realtor.com's July 2026 forecast projects 4.10 million existing-home sales and 1.2% annual median price growth. It also expects rents to decline 1.2%.
| Year | Sales / Market Context | Analytics Opportunity |
|---|---|---|
| 2020 | Market disruption | Establish historical baseline |
| 2021 | Demand expansion | Model competitive pressure |
| 2022 | Financing conditions changed | Analyze affordability |
| 2023 | Low supply environment | Track inventory gaps |
| 2024 | 4.06M existing-home sales | Compare demand cycles |
| 2025 | 4.06M sales baseline for forecast | Monitor stabilization |
| 2026 | 4.10M projected sales | Measure recovery indicators |
For technology teams, the main advantage is repeatability. An extraction layer can be scheduled to collect selected markets at defined intervals, standardize records, remove duplicates, and pass the resulting information into downstream systems.
This can support dashboards showing price movement, new listings, removed listings, inventory changes, and competitive density. Analysts can then focus on interpretation instead of spending hours copying listing information.
The key is to design the pipeline around business questions first. A company tracking investment opportunities may prioritize price and location. A brokerage may prioritize competing listings and market availability. A developer may need broader neighborhood-level supply intelligence.
How can property intelligence strengthen competitive strategy?
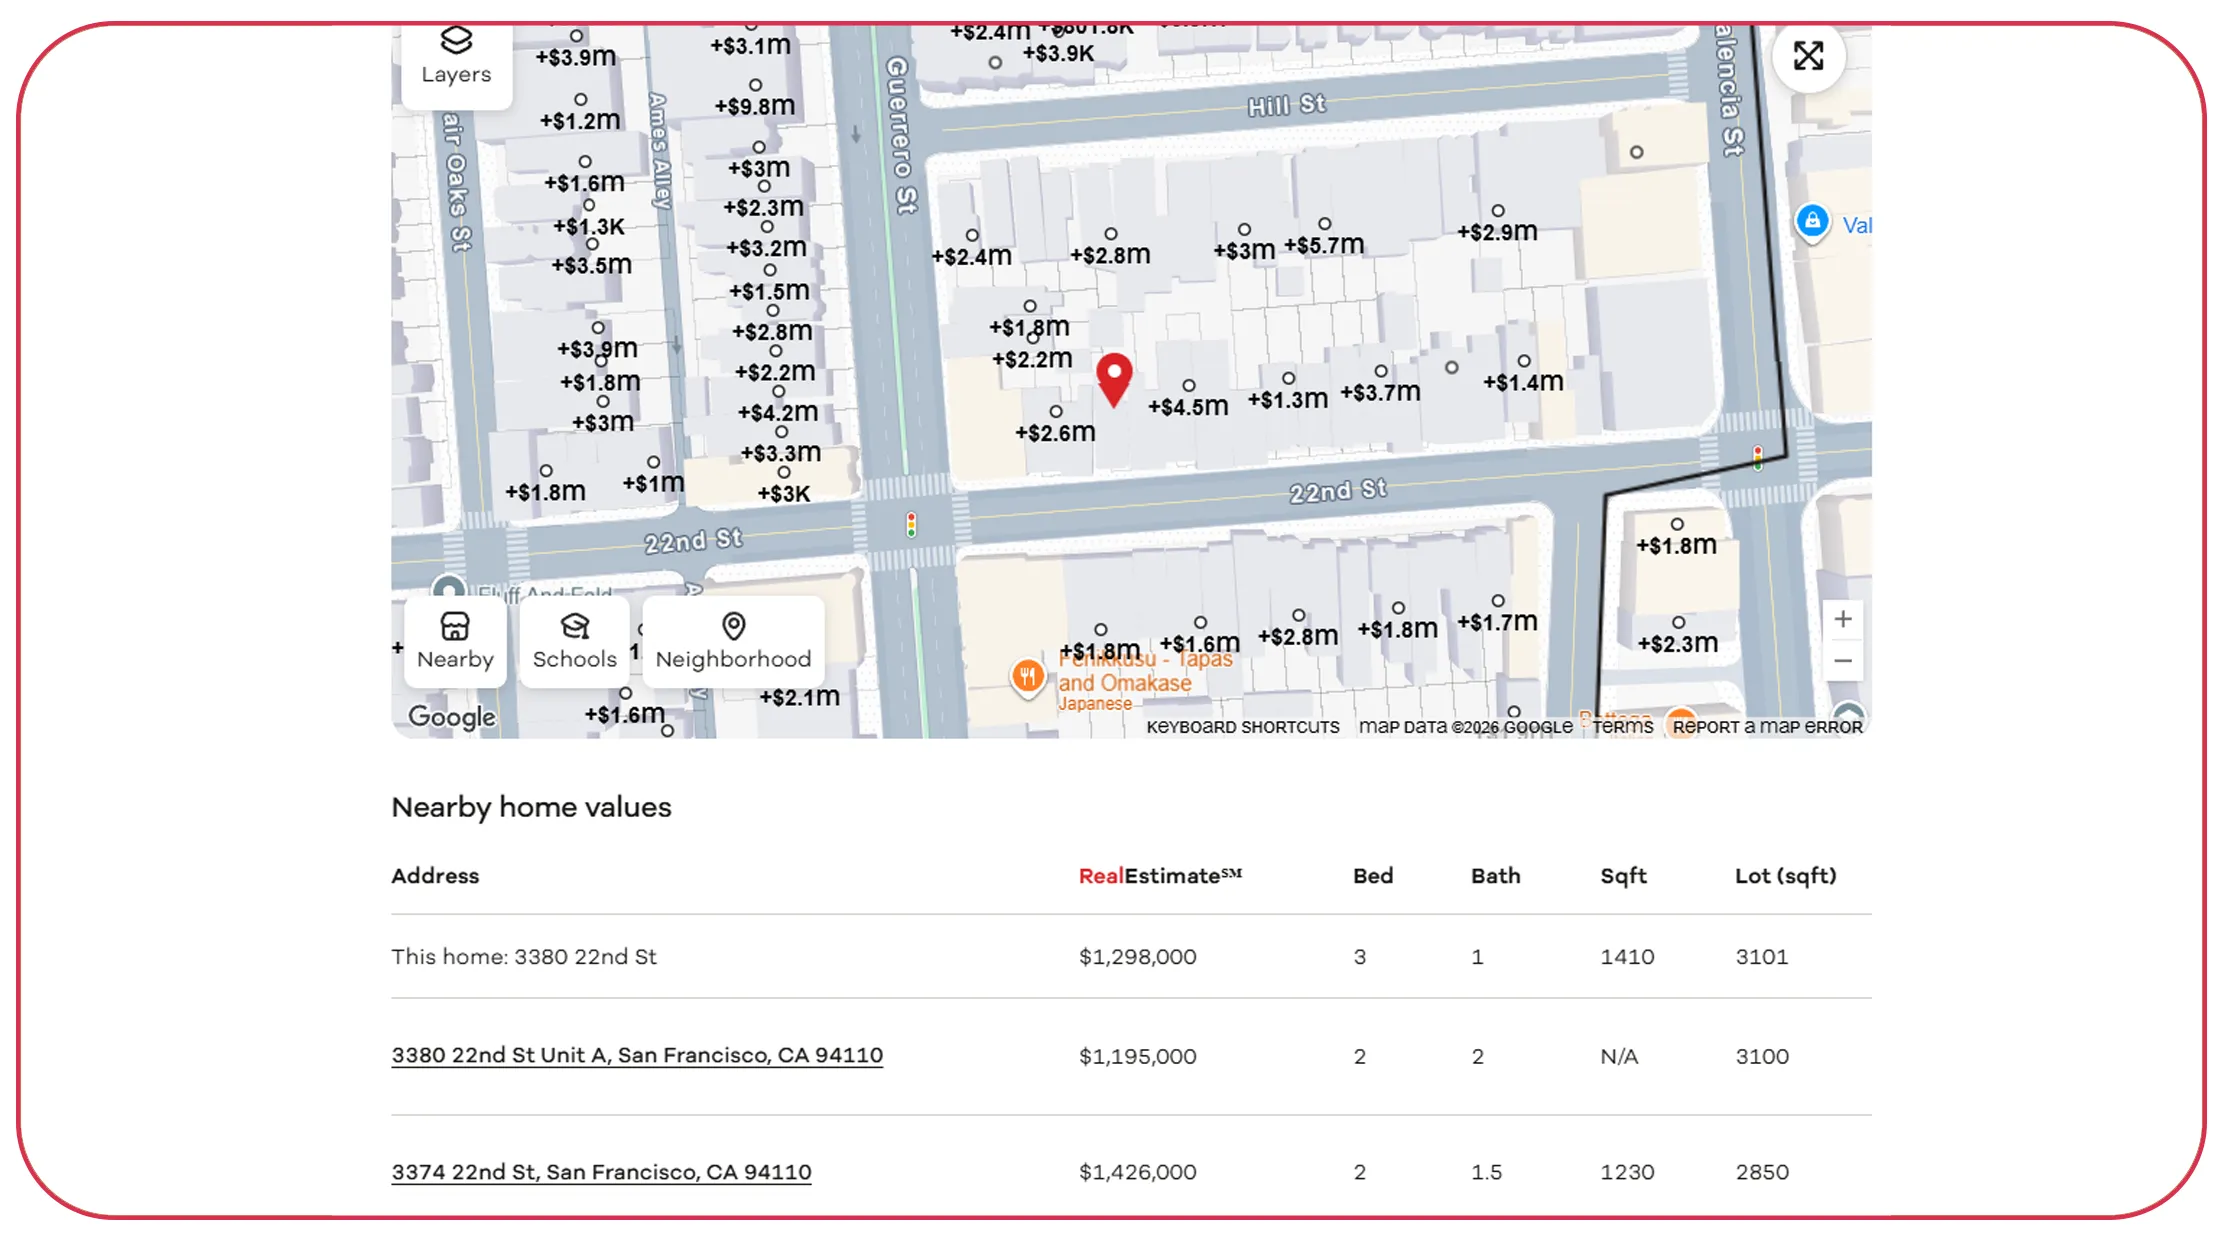
Realtor.com scraping for property market intelligence can help companies understand competitive conditions at a more granular level. Competition is rarely determined by citywide averages alone. Two neighborhoods within the same metropolitan area can have completely different inventory, price, and property-type dynamics.
A competitive intelligence workflow can compare listings across selected markets and monitor how competing properties enter, change price, remain active, or disappear from the available inventory. When these observations are stored historically, companies can identify patterns that are difficult to see through one-time searches.
Realtor.com's current research shows why segmentation matters. Its August 2026 Housing Alignment Report highlights differences between entry-level and luxury markets, noting that supply and buyer engagement are not moving identically across price tiers.
| Year | Competitive Environment | Recommended Intelligence |
|---|---|---|
| 2020 | Disrupted supply | Track inventory availability |
| 2021 | High competition for homes | Monitor price escalation |
| 2022 | Affordability pressure | Compare price tiers |
| 2023 | Constrained supply | Identify competitive gaps |
| 2024 | Low transaction volume | Track listing persistence |
| 2025 | Inventory expansion | Monitor new competitors |
| 2026 | More balanced conditions | Segment competition by price and location |
For brokerage firms, this information can support listing presentations by showing comparable inventory and pricing patterns. For investors, it can help identify markets where competition may be rising or falling. For developers, it can reveal whether new projects would enter an oversupplied or underserved segment.
The most useful output is an intelligence layer rather than a raw spreadsheet. Companies can create indicators such as median asking price, listing count, price-change frequency, inventory growth, and competitive density.
By monitoring these indicators consistently, decision-makers can identify market shifts earlier and adjust acquisition, pricing, marketing, and expansion strategies accordingly.
What makes large-scale property collection useful for decision-makers?
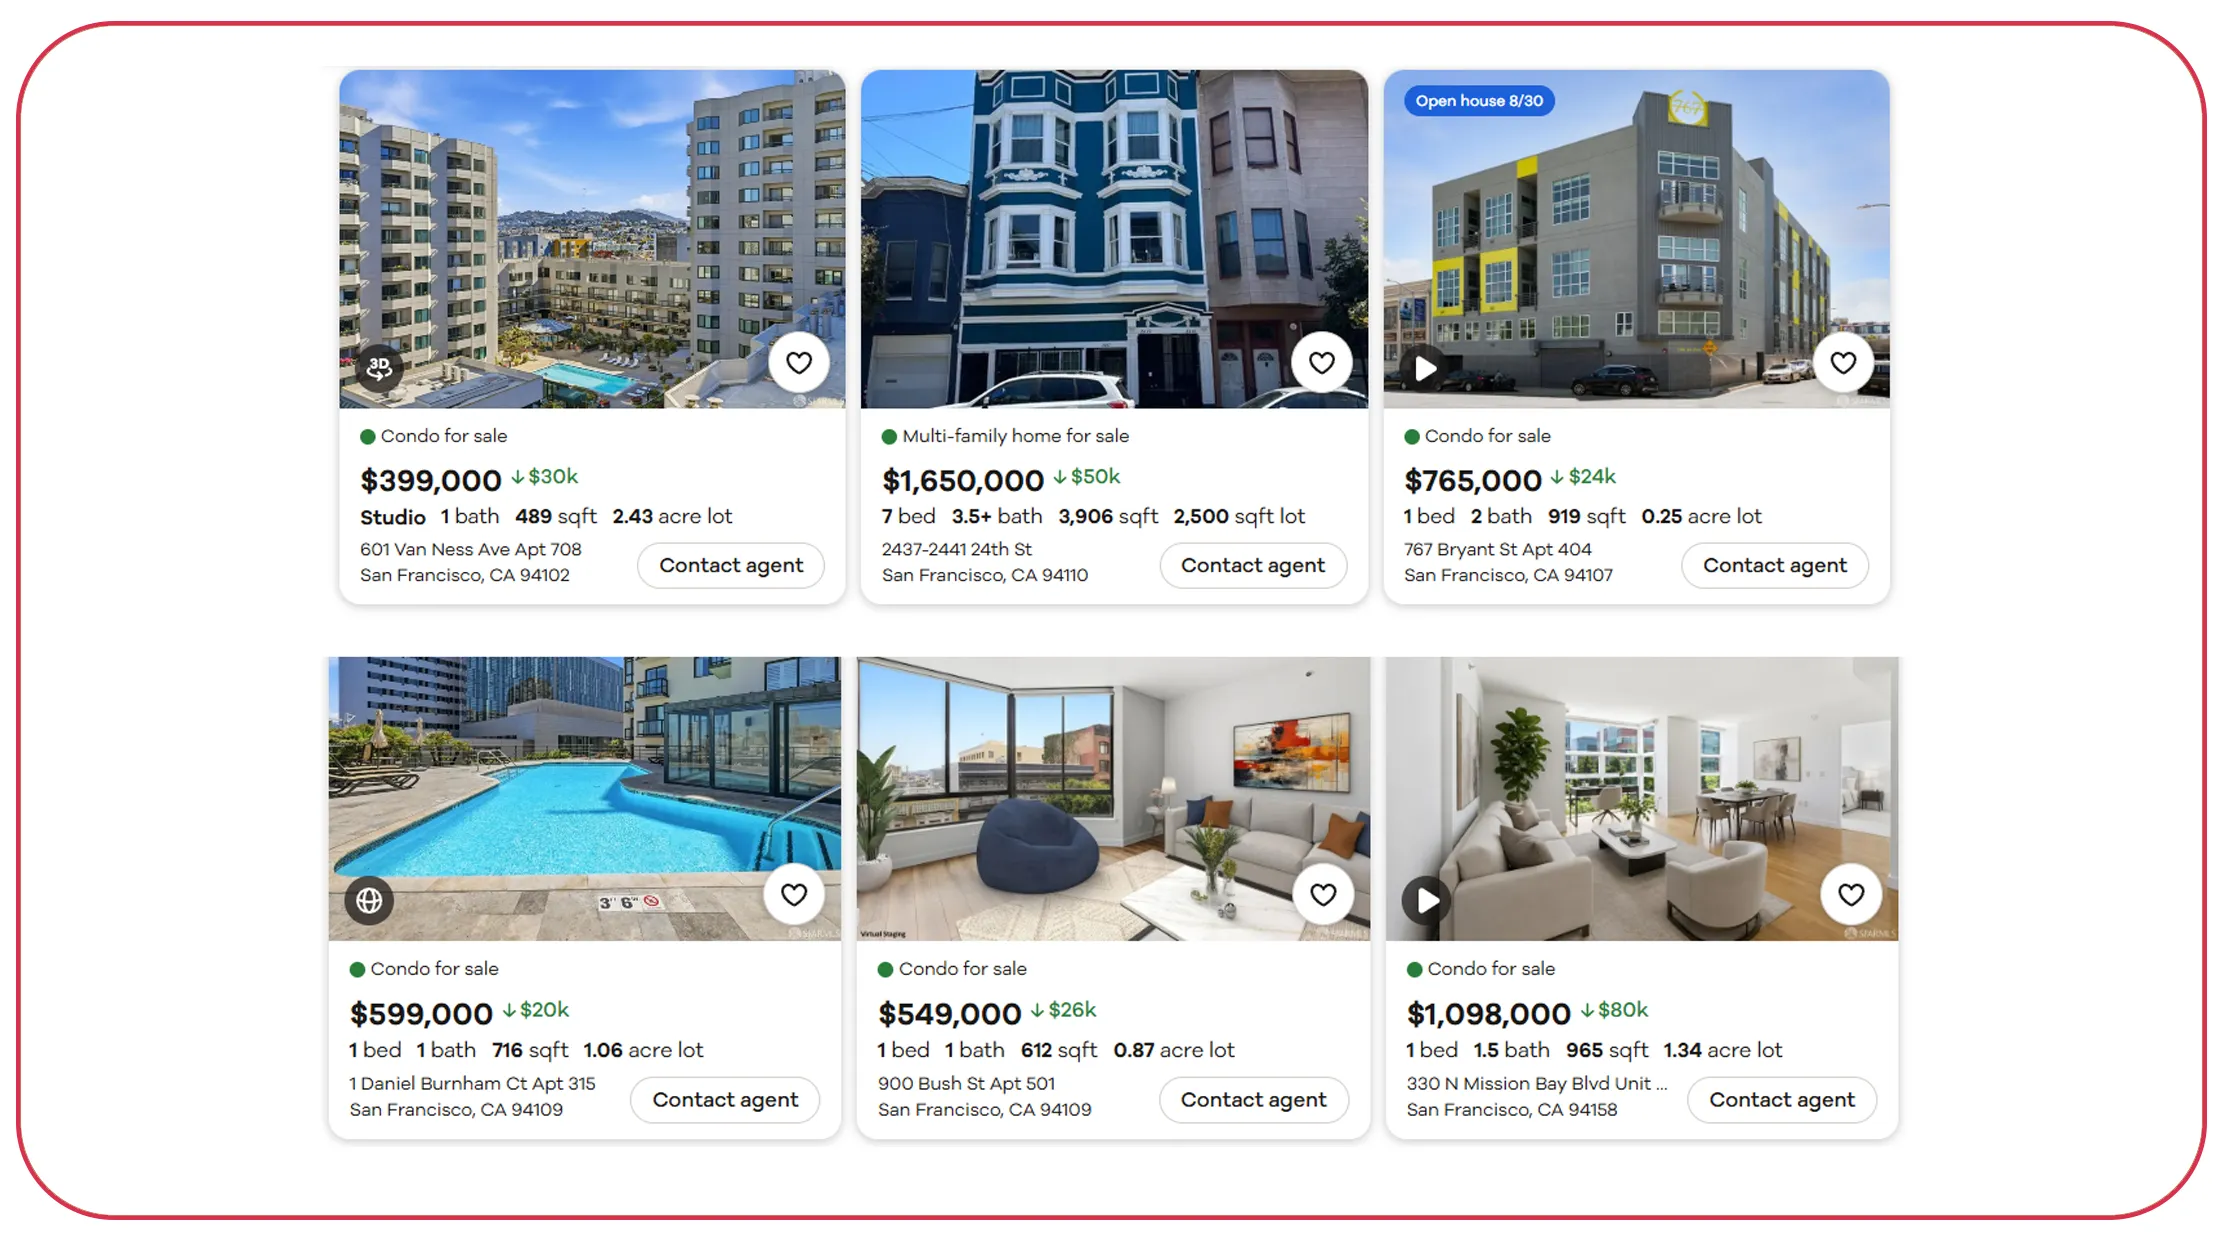
Scraping Data from Realtor.com becomes particularly valuable when companies need to analyze multiple markets rather than a handful of individual listings. Manual research may work for occasional competitive checks, but it becomes difficult to maintain consistency when hundreds or thousands of properties must be compared repeatedly.
Large-scale collection can create structured records that allow companies to segment properties by geography, price, property type, and other available attributes. The resulting dataset can support historical comparisons and recurring market reports.
The evolution of the U.S. housing market from 2020 through 2026 demonstrates the importance of historical context. Realtor.com reports that 2024 existing-home sales were 4.06 million, a 29-year low, while its 2026 forecast expects sales to improve to 4.10 million.
| Year | Key Housing Indicator | Why It Matters |
|---|---|---|
| 2020 | Pandemic-era disruption | Baseline for abnormal market conditions |
| 2021 | Strong demand | Benchmark for rapid market expansion |
| 2022 | Rising mortgage rates | Affordability sensitivity |
| 2023 | Supply remained constrained | Inventory monitoring |
| 2024 | 4.06M existing-home sales | Long-term demand comparison |
| 2025 | 15.2% inventory growth | Competitive supply expansion |
| 2026 | 3.6% forecast inventory growth | Continued normalization |
For data teams, collection should be accompanied by validation. Duplicate listings should be handled carefully, property attributes should be standardized, and timestamps should be retained where possible. Historical records should not simply overwrite earlier observations because those snapshots can become valuable for trend analysis.
For business teams, the final dataset should answer practical questions: Which markets are gaining inventory? Which price segments are becoming more competitive? Where are asking prices changing? Which property categories have the strongest availability?
This turns property collection into a reusable analytical asset rather than a one-time research exercise.
How can an API-driven workflow scale real estate intelligence?
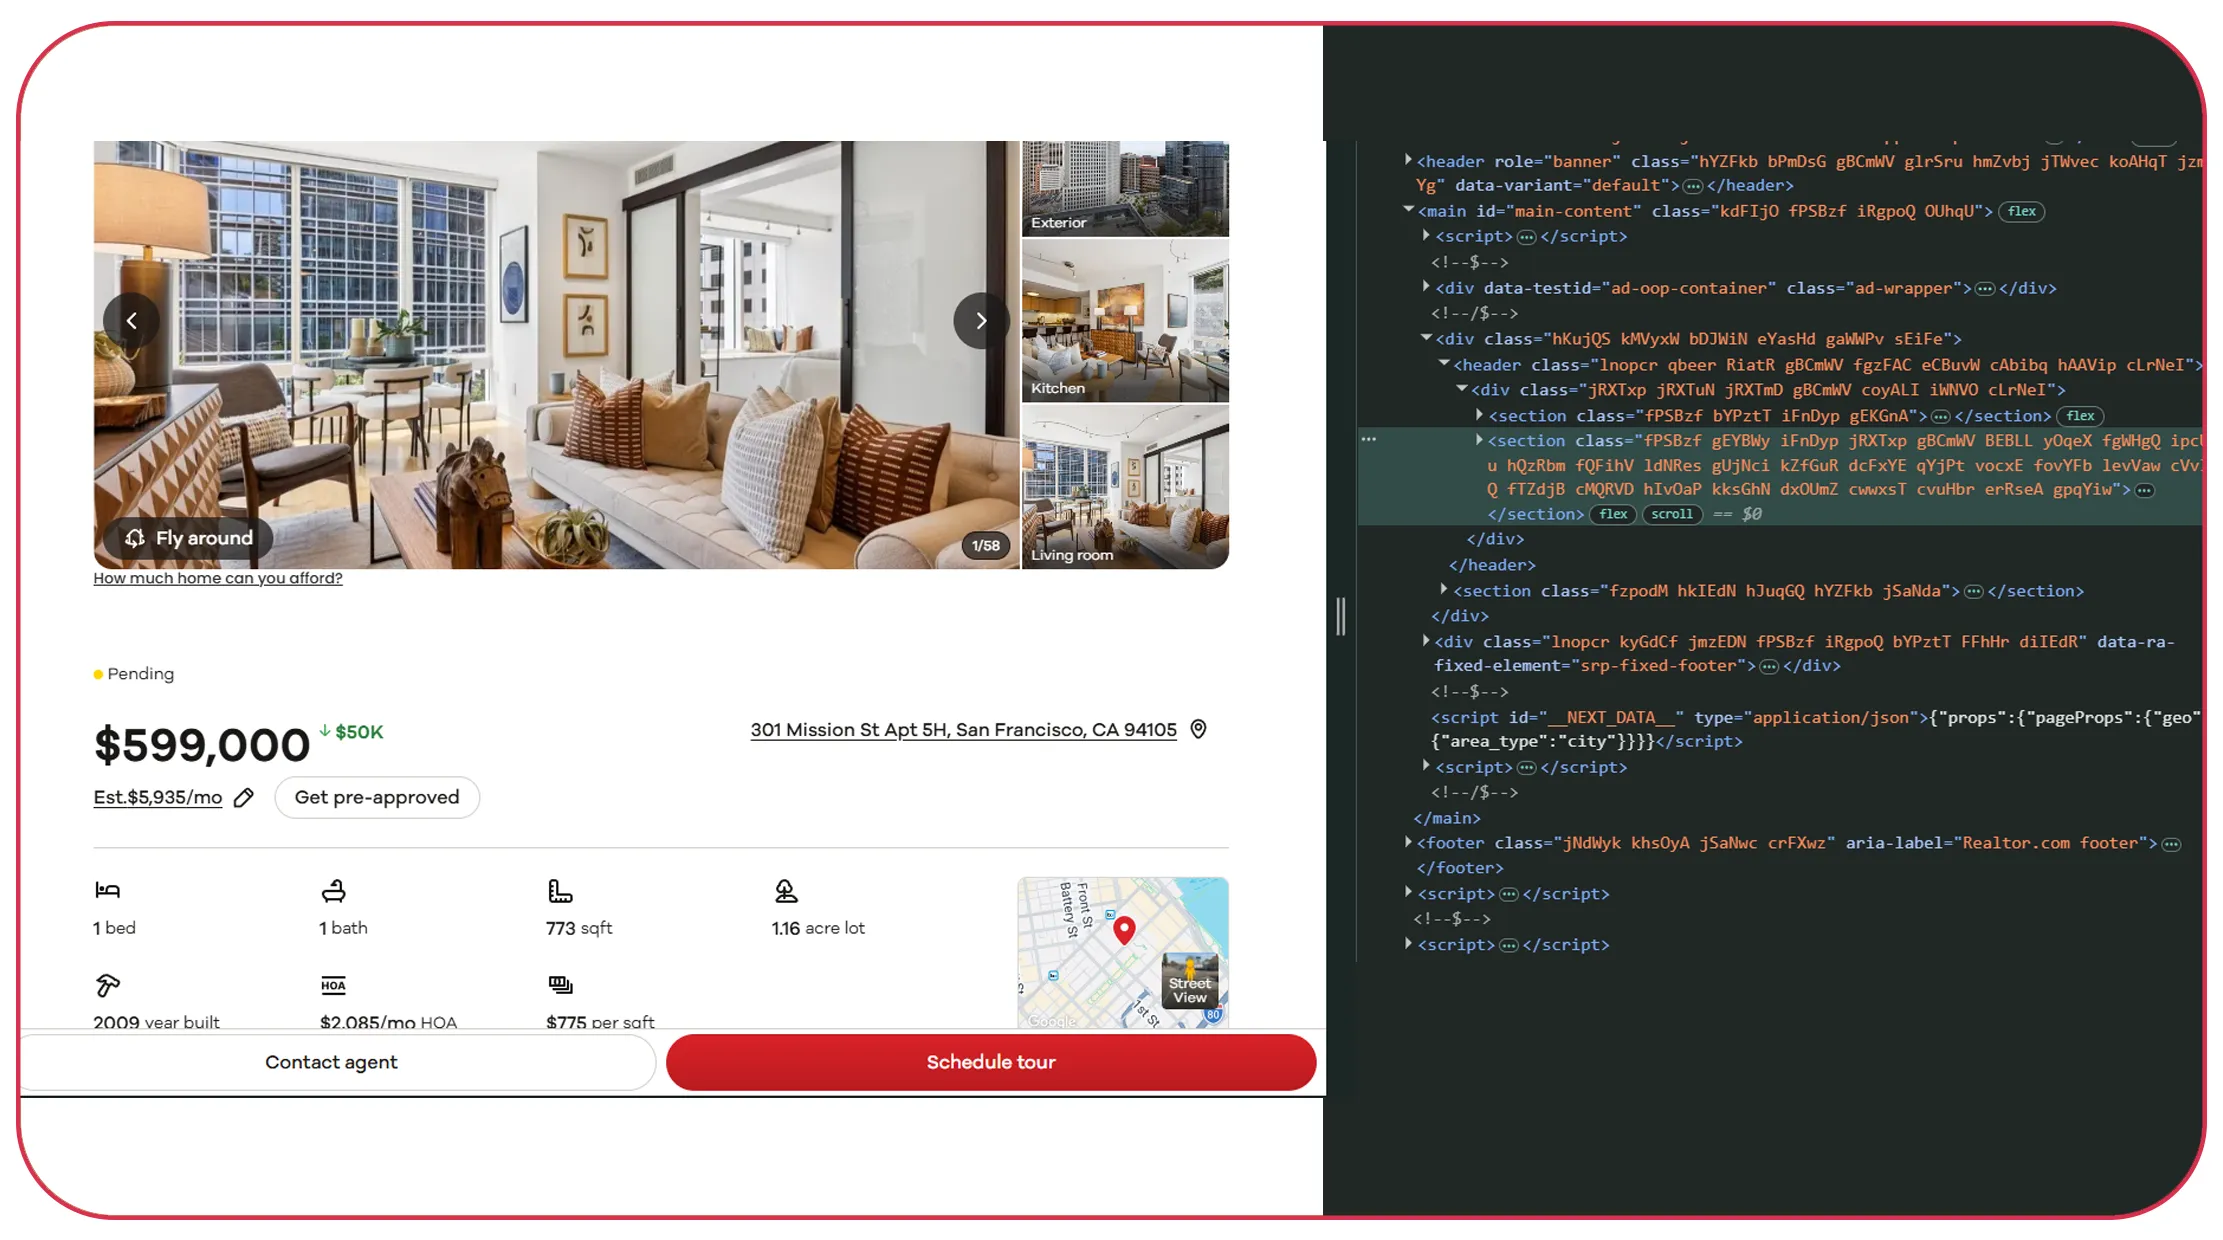
A Realtor Data Scraping API can provide a scalable foundation for companies that need recurring property intelligence across markets. Instead of building isolated manual processes, organizations can establish a repeatable pipeline for collecting, structuring, validating, and delivering property information. Realtor.com data extraction for real estate companies can then become part of a broader data strategy covering competitive research, pricing intelligence, investment analysis, and market monitoring.
A practical architecture can include source collection, parsing, field normalization, validation, deduplication, storage, and delivery into dashboards or internal systems. The exact fields and collection frequency should be determined by the business use case and the source's permitted access conditions.
| Year | Market Development | Scalable Data Requirement |
|---|---|---|
| 2020 | Market volatility | Frequent historical snapshots |
| 2021 | Rapid demand | Higher-frequency monitoring |
| 2022 | Affordability shift | Price and property segmentation |
| 2023 | Inventory constraints | Competitive availability tracking |
| 2024 | Low sales activity | Historical comparison |
| 2025 | Inventory recovery | Expanded market coverage |
| 2026 | Balanced-market transition | Continuous price and supply monitoring |
The business value comes from connecting data collection to decisions. A real estate investment company could feed property records into acquisition models. A brokerage could connect competitive listing data to pricing workflows. A PropTech platform could use structured records as an input for analytics products.
Realtor.com's current research shows that the market is becoming more balanced, but regional and segment-level differences remain significant. The July 2026 forecast expects price growth of 1.2%, inventory growth of 3.6%, and existing-home sales of 4.10 million.
That environment rewards companies that can observe changes quickly and consistently.
The recommended approach is to define the target markets and fields, establish collection intervals, maintain historical snapshots, validate records, and expose the resulting dataset through analytics or APIs. This creates a foundation for repeatable market intelligence rather than disconnected research exercises.
Why Choose Real Data API?
Real Data API can help real estate companies build structured workflows around property intelligence instead of relying on fragmented manual research. A Realtor.com Real Estate Dataset can be designed around business requirements such as property attributes, pricing, locations, availability, and competitive market indicators. Realtor.com data extraction for real estate companies can support recurring data workflows for analysts, investors, brokerages, PropTech businesses, and real estate research teams.
The focus should be on usable data quality, scalable workflows, structured delivery, and business-oriented outputs. Historical snapshots can support trend analysis, while normalized records can make data easier to integrate into analytics platforms and internal databases.
For organizations evaluating a data partner, important criteria include scalability, field coverage, data validation, delivery format, scheduling capabilities, documentation, and support for the intended analytical workflow. Data collection should also be implemented in accordance with applicable laws, contractual restrictions, and the target website's access requirements.
Conclusion
Real estate companies can solve property market intelligence challenges by turning fragmented listing information into structured, comparable, and continuously updated datasets. Realtor.com data extraction for real estate companies can support pricing analysis, competitive monitoring, inventory tracking, investment research, and market segmentation when implemented as a repeatable data workflow.
The 2026 market demonstrates why this approach matters. Realtor.com's latest forecast points to slower price growth, rising inventory, modestly improving sales, and greater buyer negotiating power. Companies therefore need more than static market averages; they need granular information that can reveal how individual markets and property segments are changing.
Talk to Real Data API to build a scalable property data extraction workflow tailored to your real estate intelligence, pricing, investment, and competitive research needs!
Latest posts

Keeta scraper for monitoring food marketplace trends - Identify Discount Changes and Emerging Customer Demand

How to build a structured Nike product dataset for Product Intelligence and Retail Analytics

Allegro scraper for competitor price monitoring – How to Track Product Prices and Stay Ahead of Competitors

Ocado API data collection services for retailers - Track Competitor Prices and Deals







.png)



