
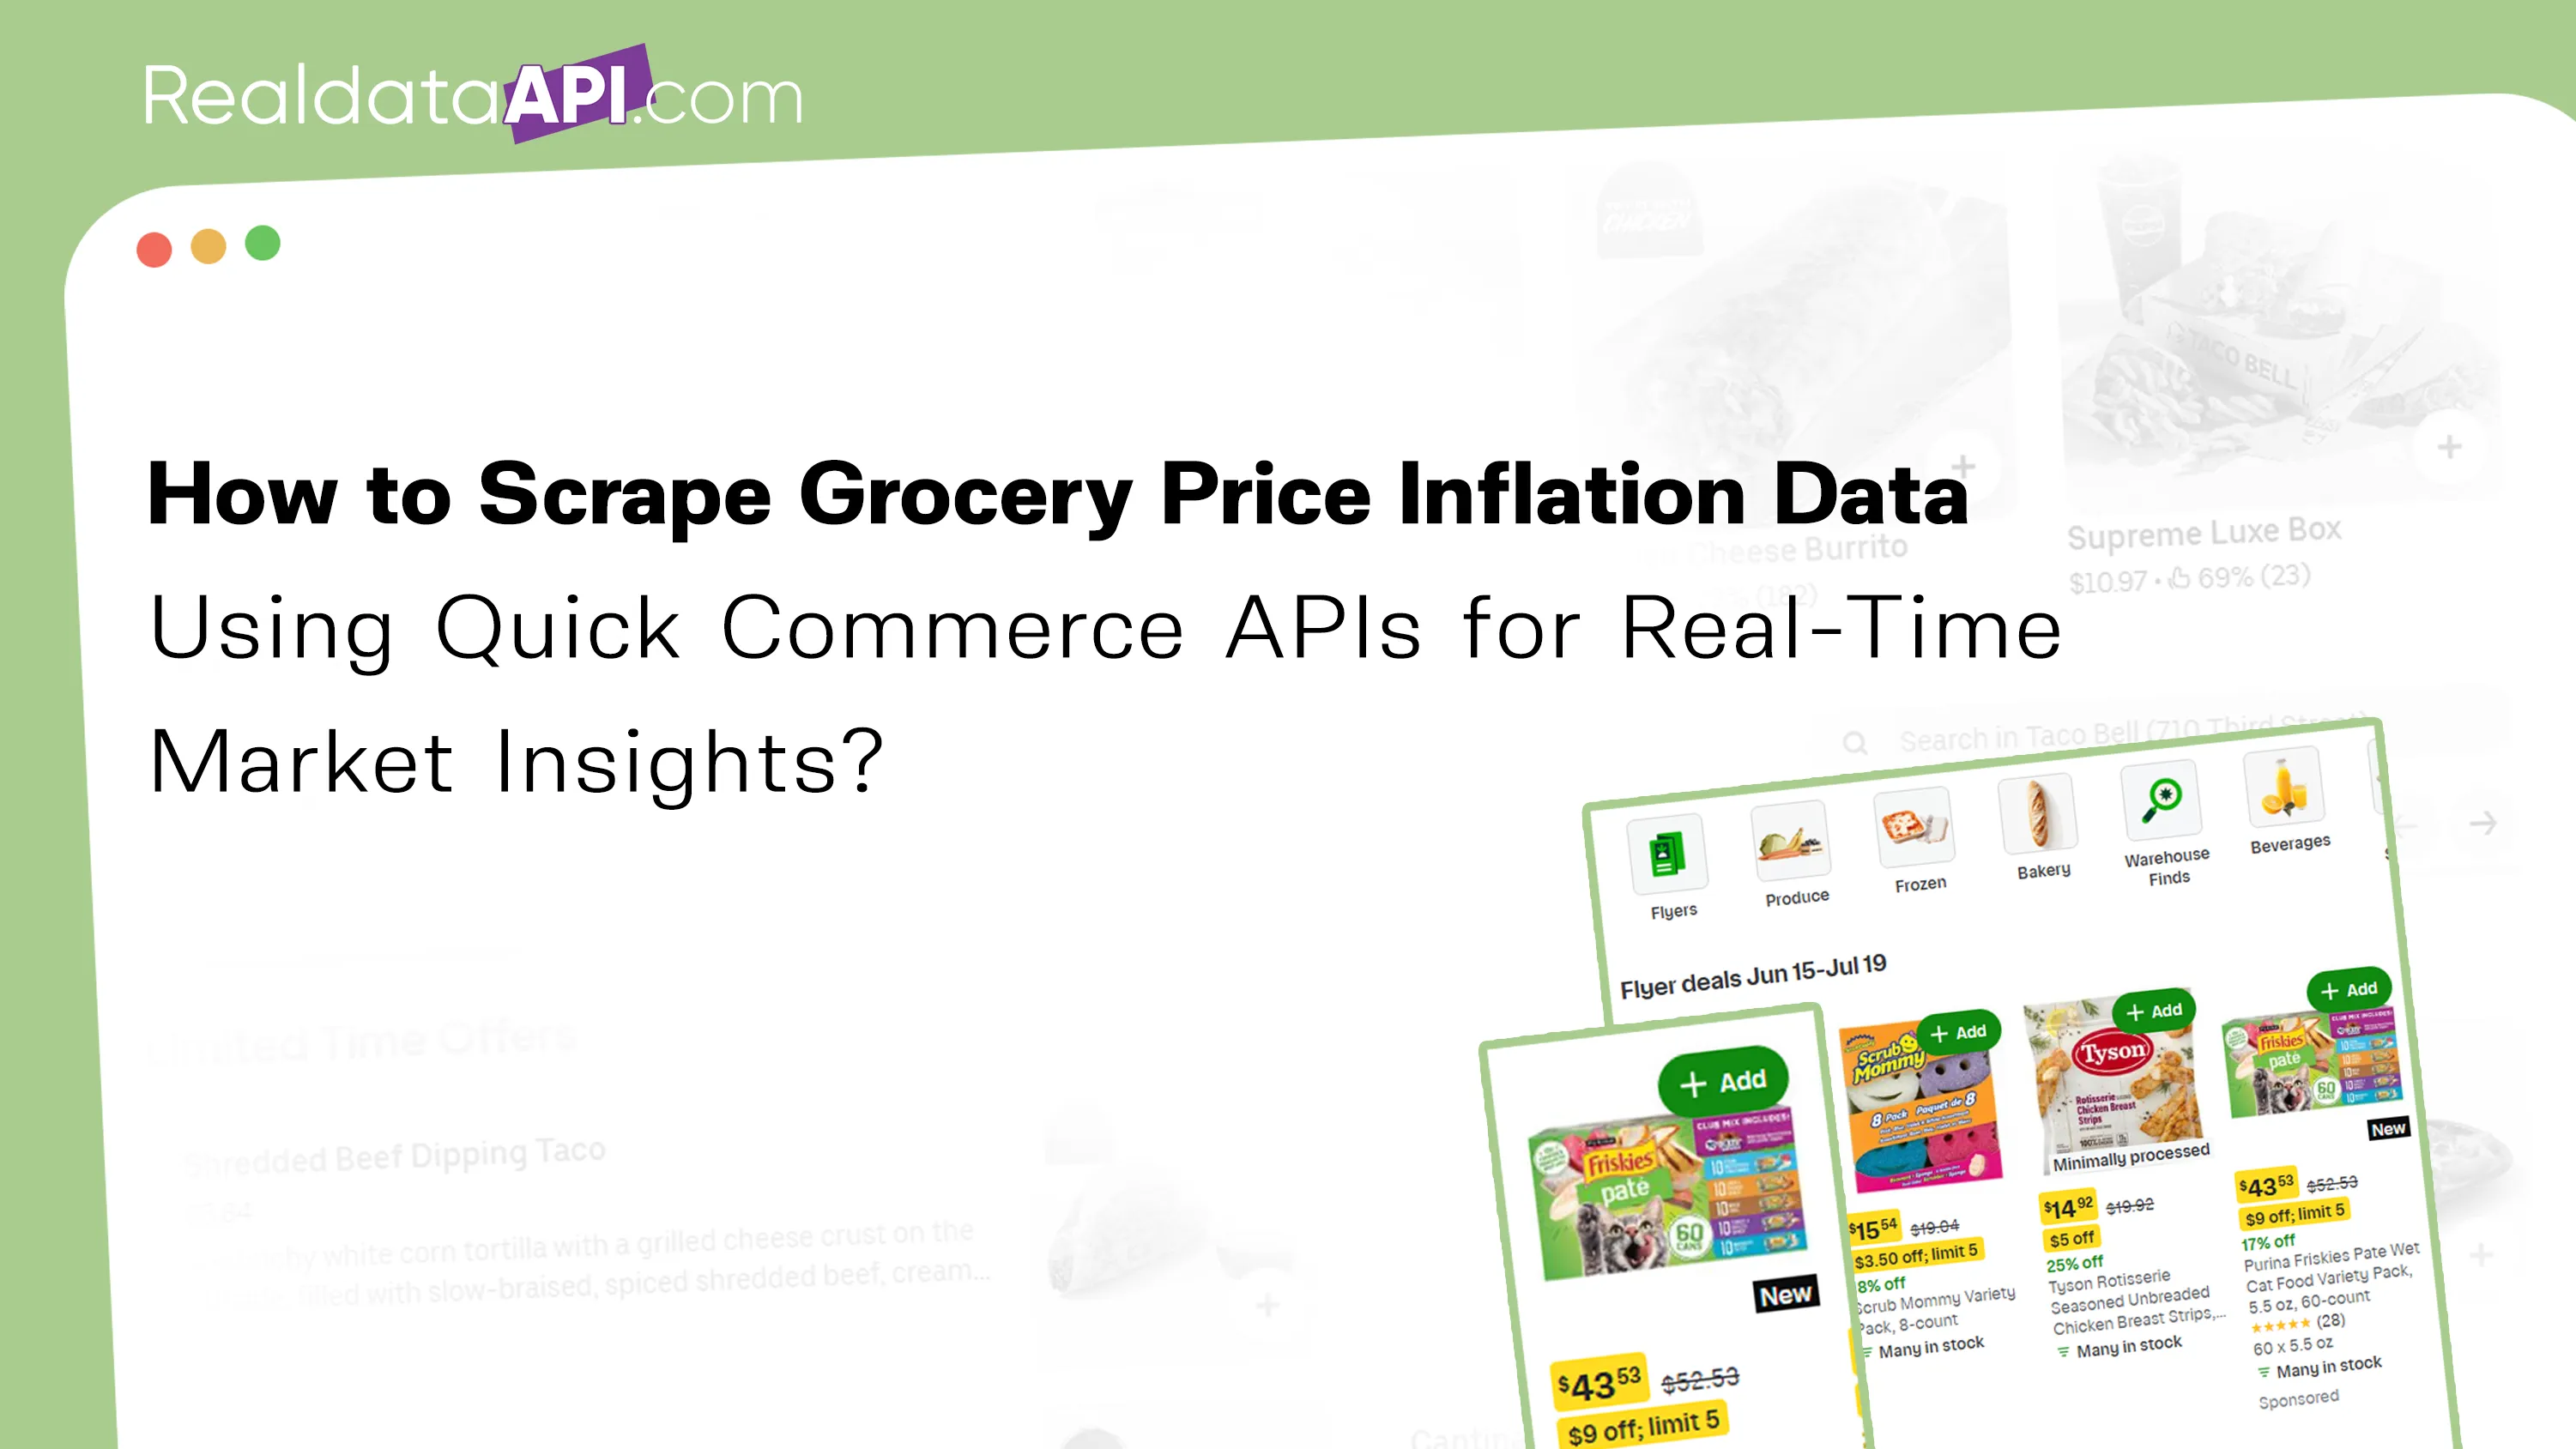
Introduction
Businesses can track grocery inflation in real time by collecting pricing data from quick commerce platforms through APIs and structured datasets. This approach helps retailers, brands, market researchers, and pricing analysts monitor inflation trends, compare regional pricing, and make data-driven decisions faster than traditional market surveys.
According to multiple retail industry reports, online grocery sales have grown significantly since 2020, while grocery inflation fluctuations have increased demand for real-time pricing intelligence. Quick commerce platforms now process millions of product price updates daily, creating valuable datasets for inflation monitoring.
Traditional inflation reports often lag by weeks or months. Businesses need faster visibility into changing grocery prices to optimize inventory, promotions, forecasting, and competitive positioning.
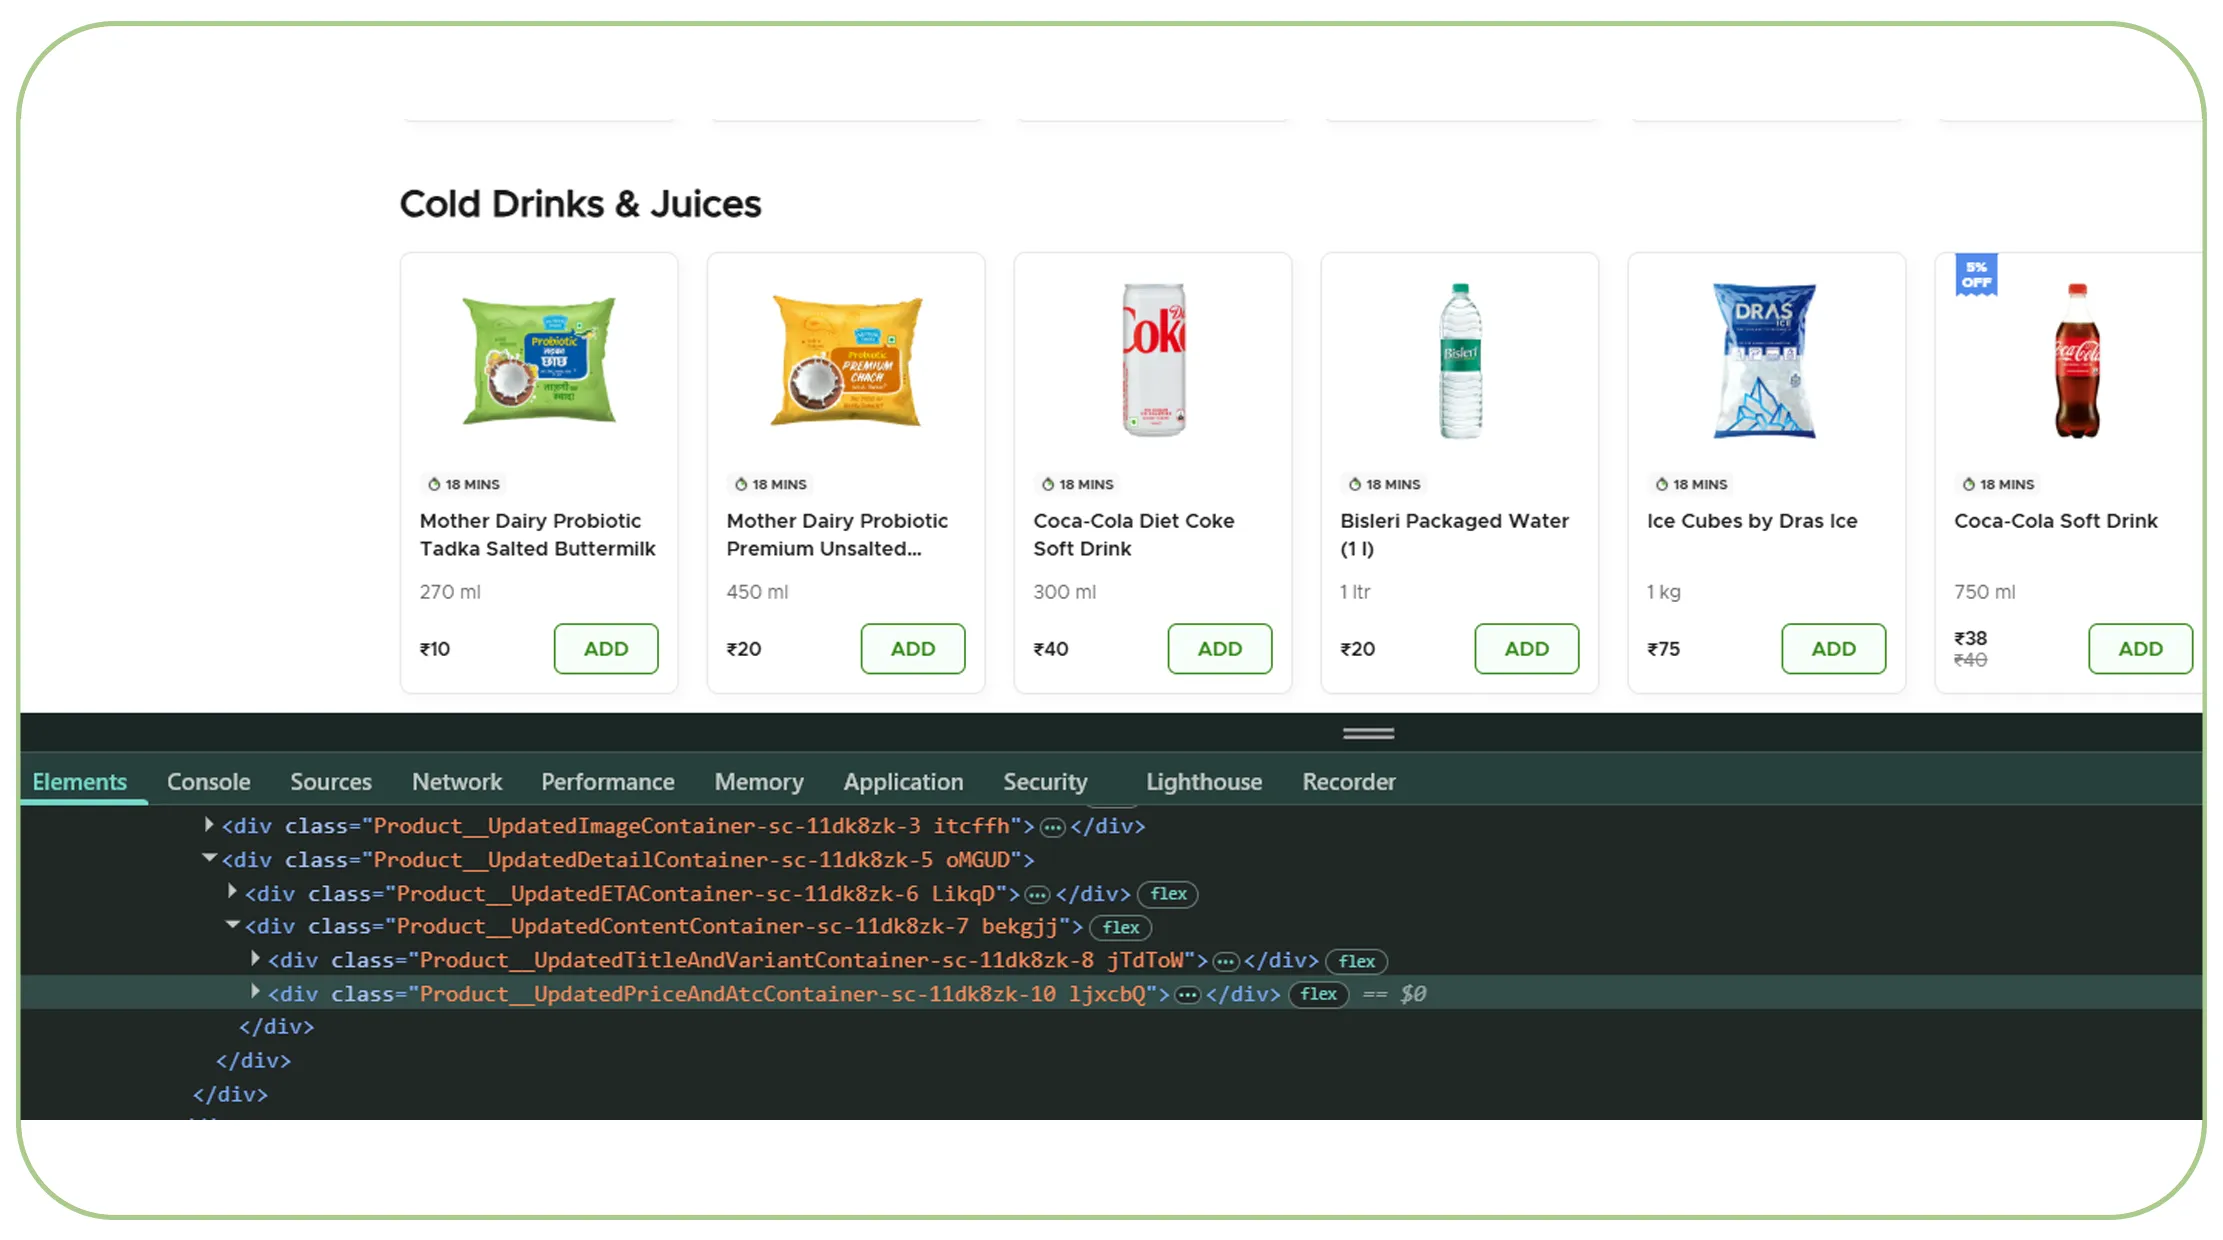
One effective way to achieve this is to Scrape grocery price inflation data Using Quick Commerce APIs and analyze pricing movements across products, regions, and retailers.
The availability of a comprehensive Grocery Dataset enables organizations to track thousands of SKUs across categories such as dairy, fruits, vegetables, beverages, snacks, and household essentials.
How Has Grocery Inflation Changed Since 2020?
The grocery industry has experienced significant pricing shifts due to supply chain disruptions, fuel costs, labor shortages, geopolitical events, and changing consumer demand.
Grocery Inflation Trends (2020–2026)
| Year | Estimated Grocery Inflation Rate (%) |
|---|---|
| 2020 | 2.8 |
| 2021 | 4.5 |
| 2022 | 11.2 |
| 2023 | 6.7 |
| 2024 | 4.3 |
| 2025 | 3.8 |
| 2026* | 3.4 |
*Projected estimates
Key Market Drivers:
- Supply chain disruptions
- Transportation costs
- Fuel price increases
- Labor shortages
- Seasonal demand shifts
- Regional inventory constraints
Real-time API-based monitoring provides earlier detection of these market changes.
How Can Delivery App Data Reveal Inflation Patterns?
The ability to analyze delivery platform pricing has transformed modern inflation tracking.
Organizations increasingly rely on Scraping grocery inflation analysis via quick delivery app data to identify changes before official economic reports are released.
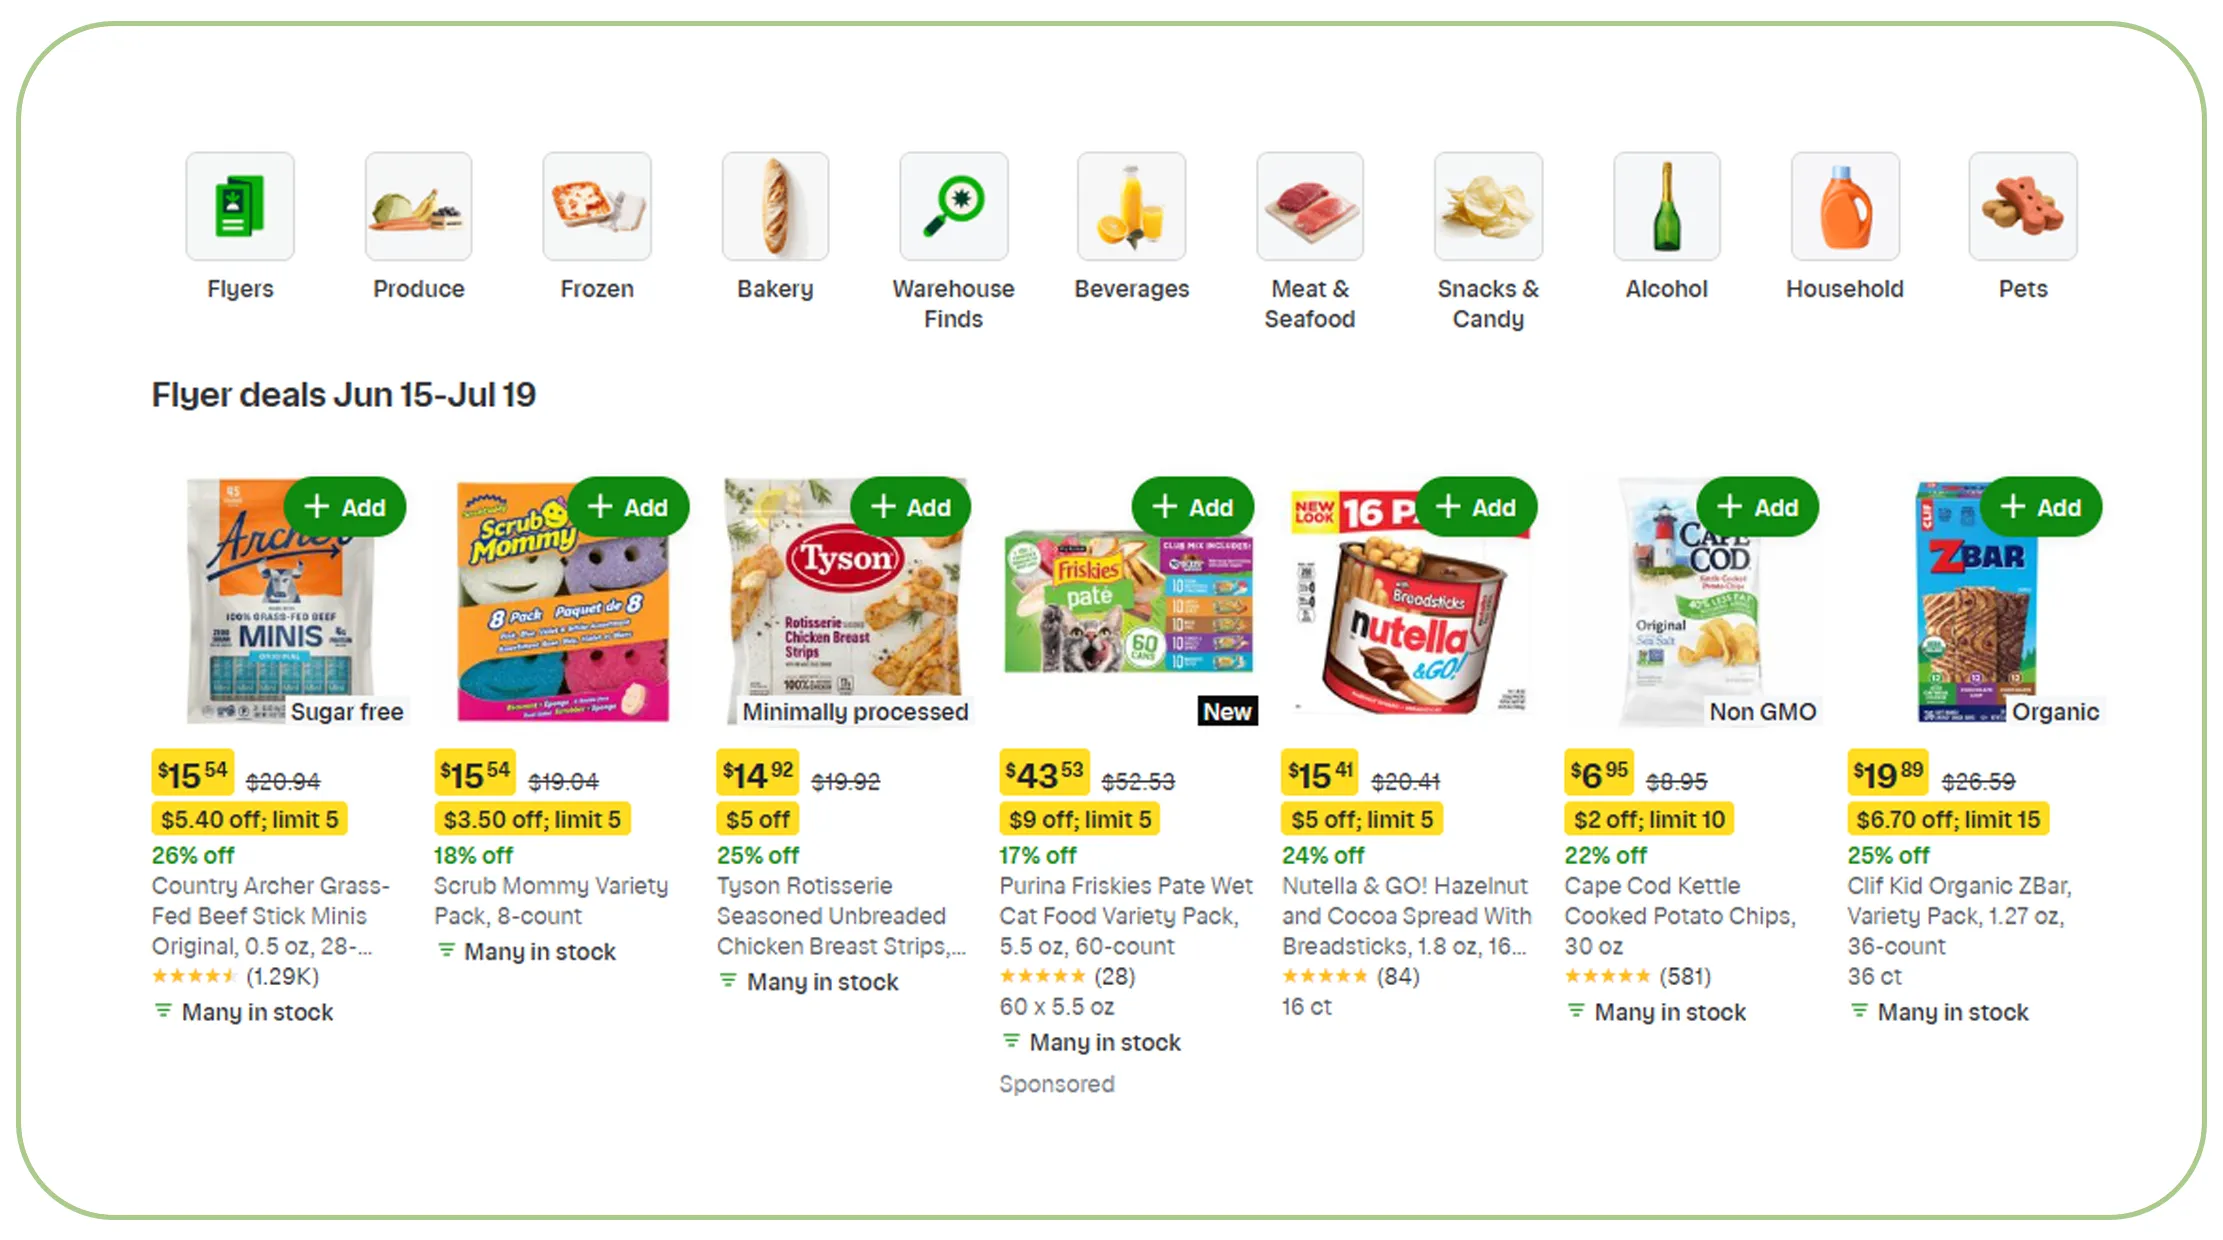
Quick commerce platforms update prices throughout the day based on inventory, demand, promotions, and logistics costs. These updates generate a large volume of market signals that can be analyzed for inflation forecasting.
Delivery App Price Growth Analysis
| Year | Average Daily SKU Updates |
|---|---|
| 2020 | 150,000 |
| 2021 | 300,000 |
| 2022 | 550,000 |
| 2023 | 750,000 |
| 2024 | 1.1 Million |
| 2025 | 1.4 Million |
| 2026 | 1.7 Million |
Benefits of Delivery-App Monitoring:
- Faster inflation detection
- Regional comparison capabilities
- Category-level trend analysis
- Promotion tracking
- Dynamic pricing visibility
Retail analysts can compare prices across thousands of products simultaneously. This creates a more accurate representation of consumer grocery spending trends than periodic surveys.
Using structured datasets also improves forecasting accuracy and enables businesses to identify inflationary pressure at the product-category level before it impacts sales performance.
What Insights Can APIs Provide About Grocery Market Inflation?
Modern pricing intelligence depends heavily on API-driven data collection.
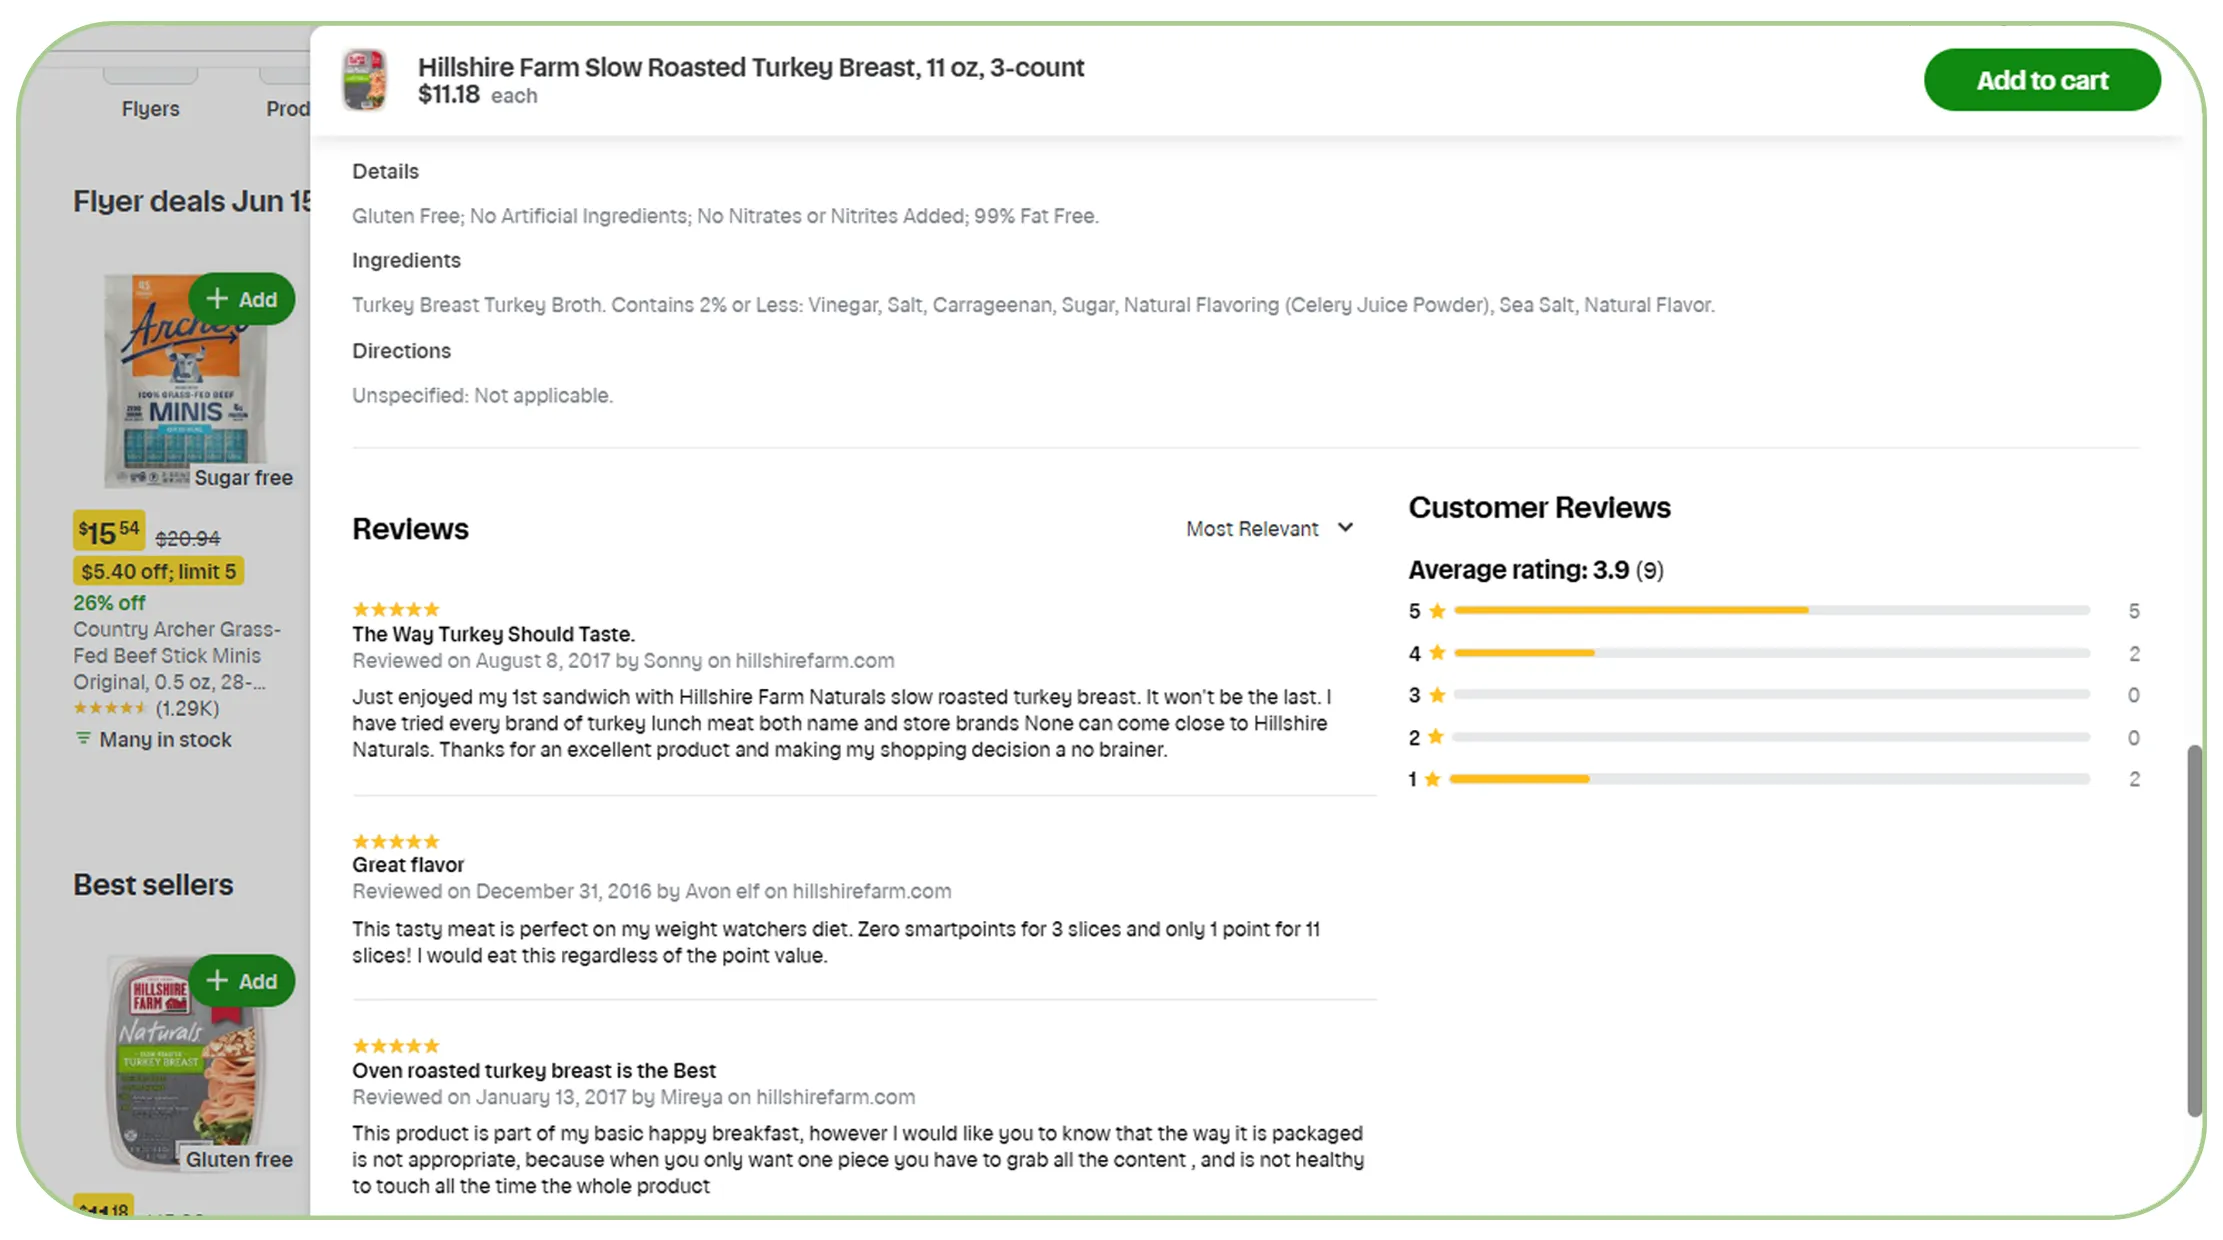
Businesses use grocery market inflation insights via Quick Commerce APIs to evaluate market conditions, benchmark competitors, and monitor pricing trends across multiple locations.
APIs provide access to:
- Product prices
- Product availability
- Promotion information
- Inventory status
- Category data
- Geographic pricing variations
Inflation Monitoring Metrics
| Metric | 2020 | 2023 | 2026 |
|---|---|---|---|
| Average Basket Value | $48 | $67 | $79 |
| SKU Coverage | 50K | 250K | 600K |
| Daily Price Changes | 12% | 21% | 28% |
These metrics demonstrate how rapidly grocery pricing ecosystems are evolving.
Organizations can identify:
- Category inflation spikes
- Regional pricing anomalies
- Competitive discount trends
- Seasonal fluctuations
Such visibility enables faster decision-making and improves strategic planning for pricing teams and market researchers.
Why Are Specialized APIs Essential for Inflation Monitoring?
Collecting and organizing grocery pricing data at scale requires reliable infrastructure.
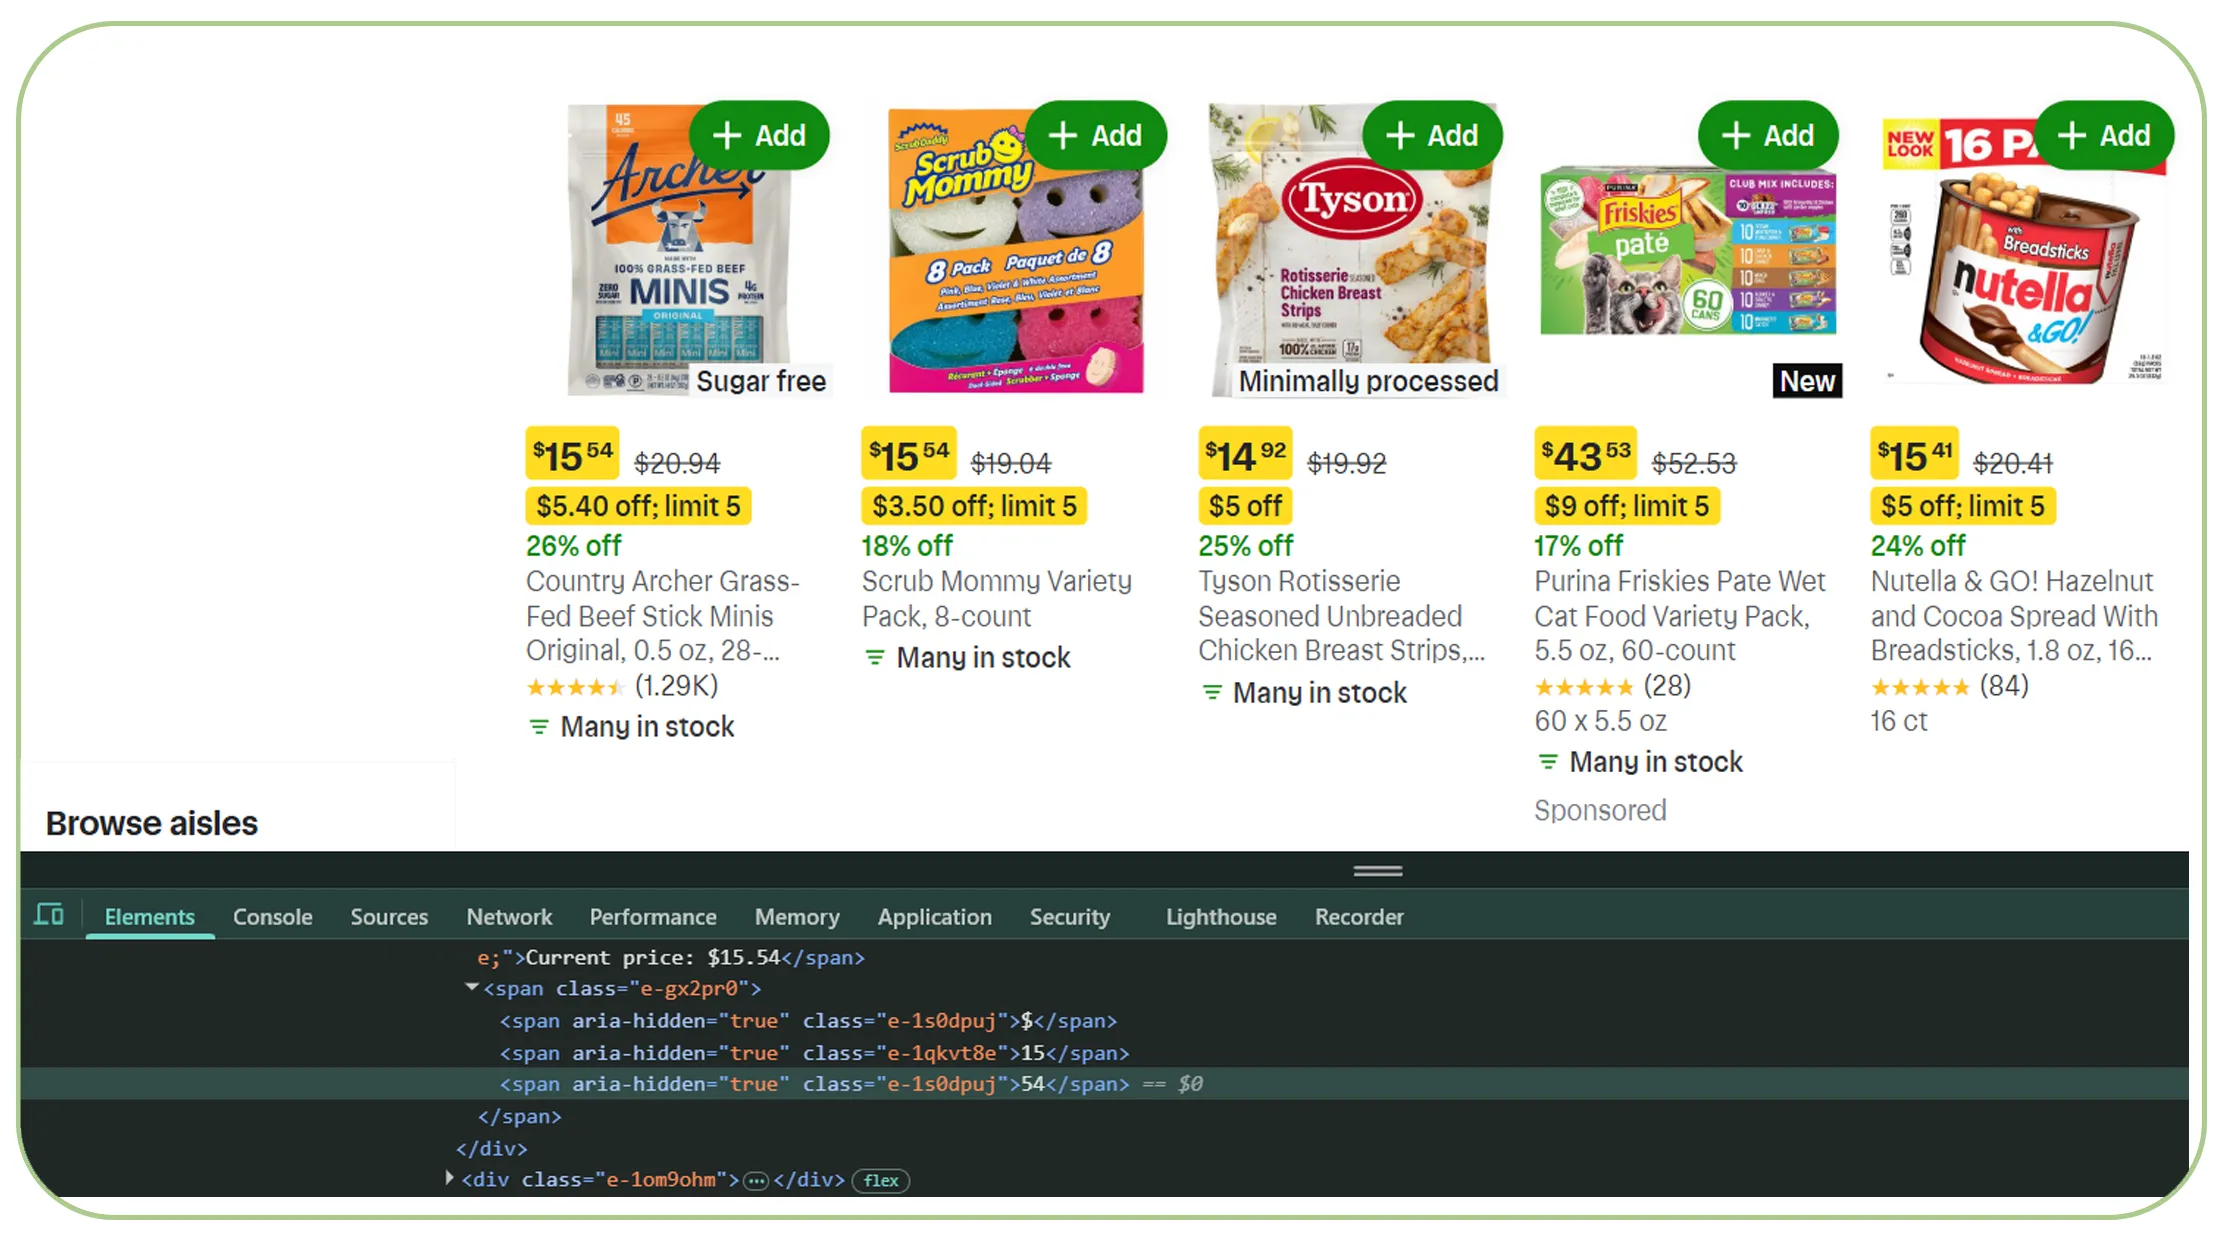
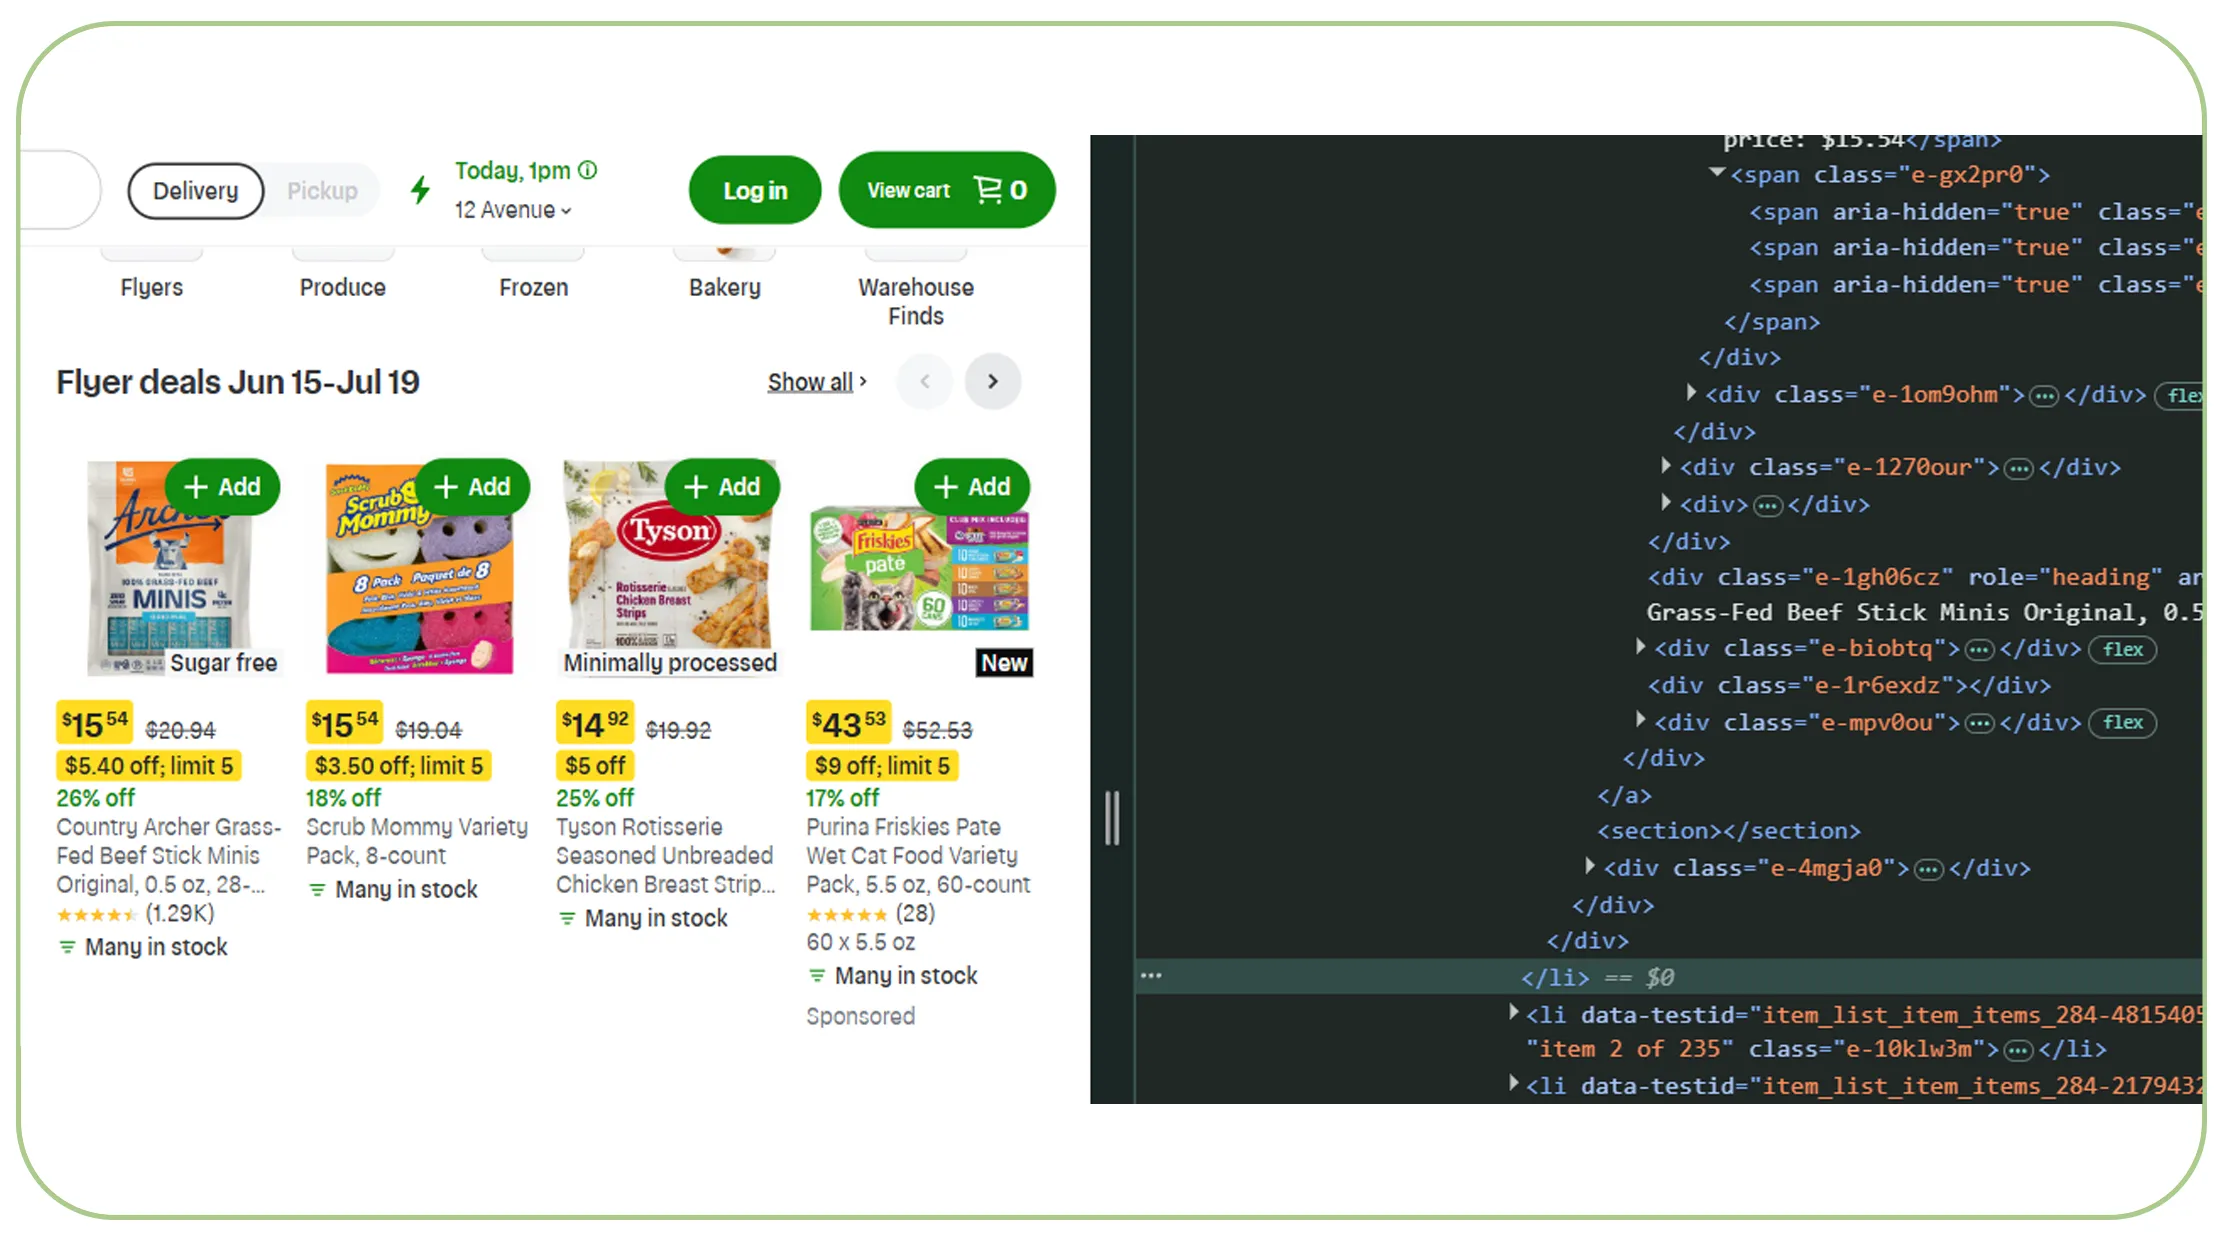
Many companies depend on quick commerce data scraping APIs for inflation analysis because manual monitoring is inefficient and difficult to scale.
Specialized APIs automate:
- Product extraction
- Price collection
- Inventory monitoring
- Historical tracking
- Market comparison
API Adoption Growth
| Year | Companies Using Pricing APIs |
|---|---|
| 2020 | 18% |
| 2021 | 26% |
| 2022 | 39% |
| 2023 | 51% |
| 2024 | 63% |
| 2025 | 71% |
| 2026 | 78% |
Major Advantages:
- Automated data collection
- Historical trend tracking
- Improved forecasting
- Better pricing intelligence
- Reduced operational costs
API-driven monitoring allows businesses to evaluate inflation continuously rather than relying on monthly reports.
This real-time visibility creates a competitive advantage for brands operating in fast-changing grocery markets.
How Does Blinkit Pricing Data Support Cost Analysis?
Blinkit has become one of the largest quick commerce platforms in India.
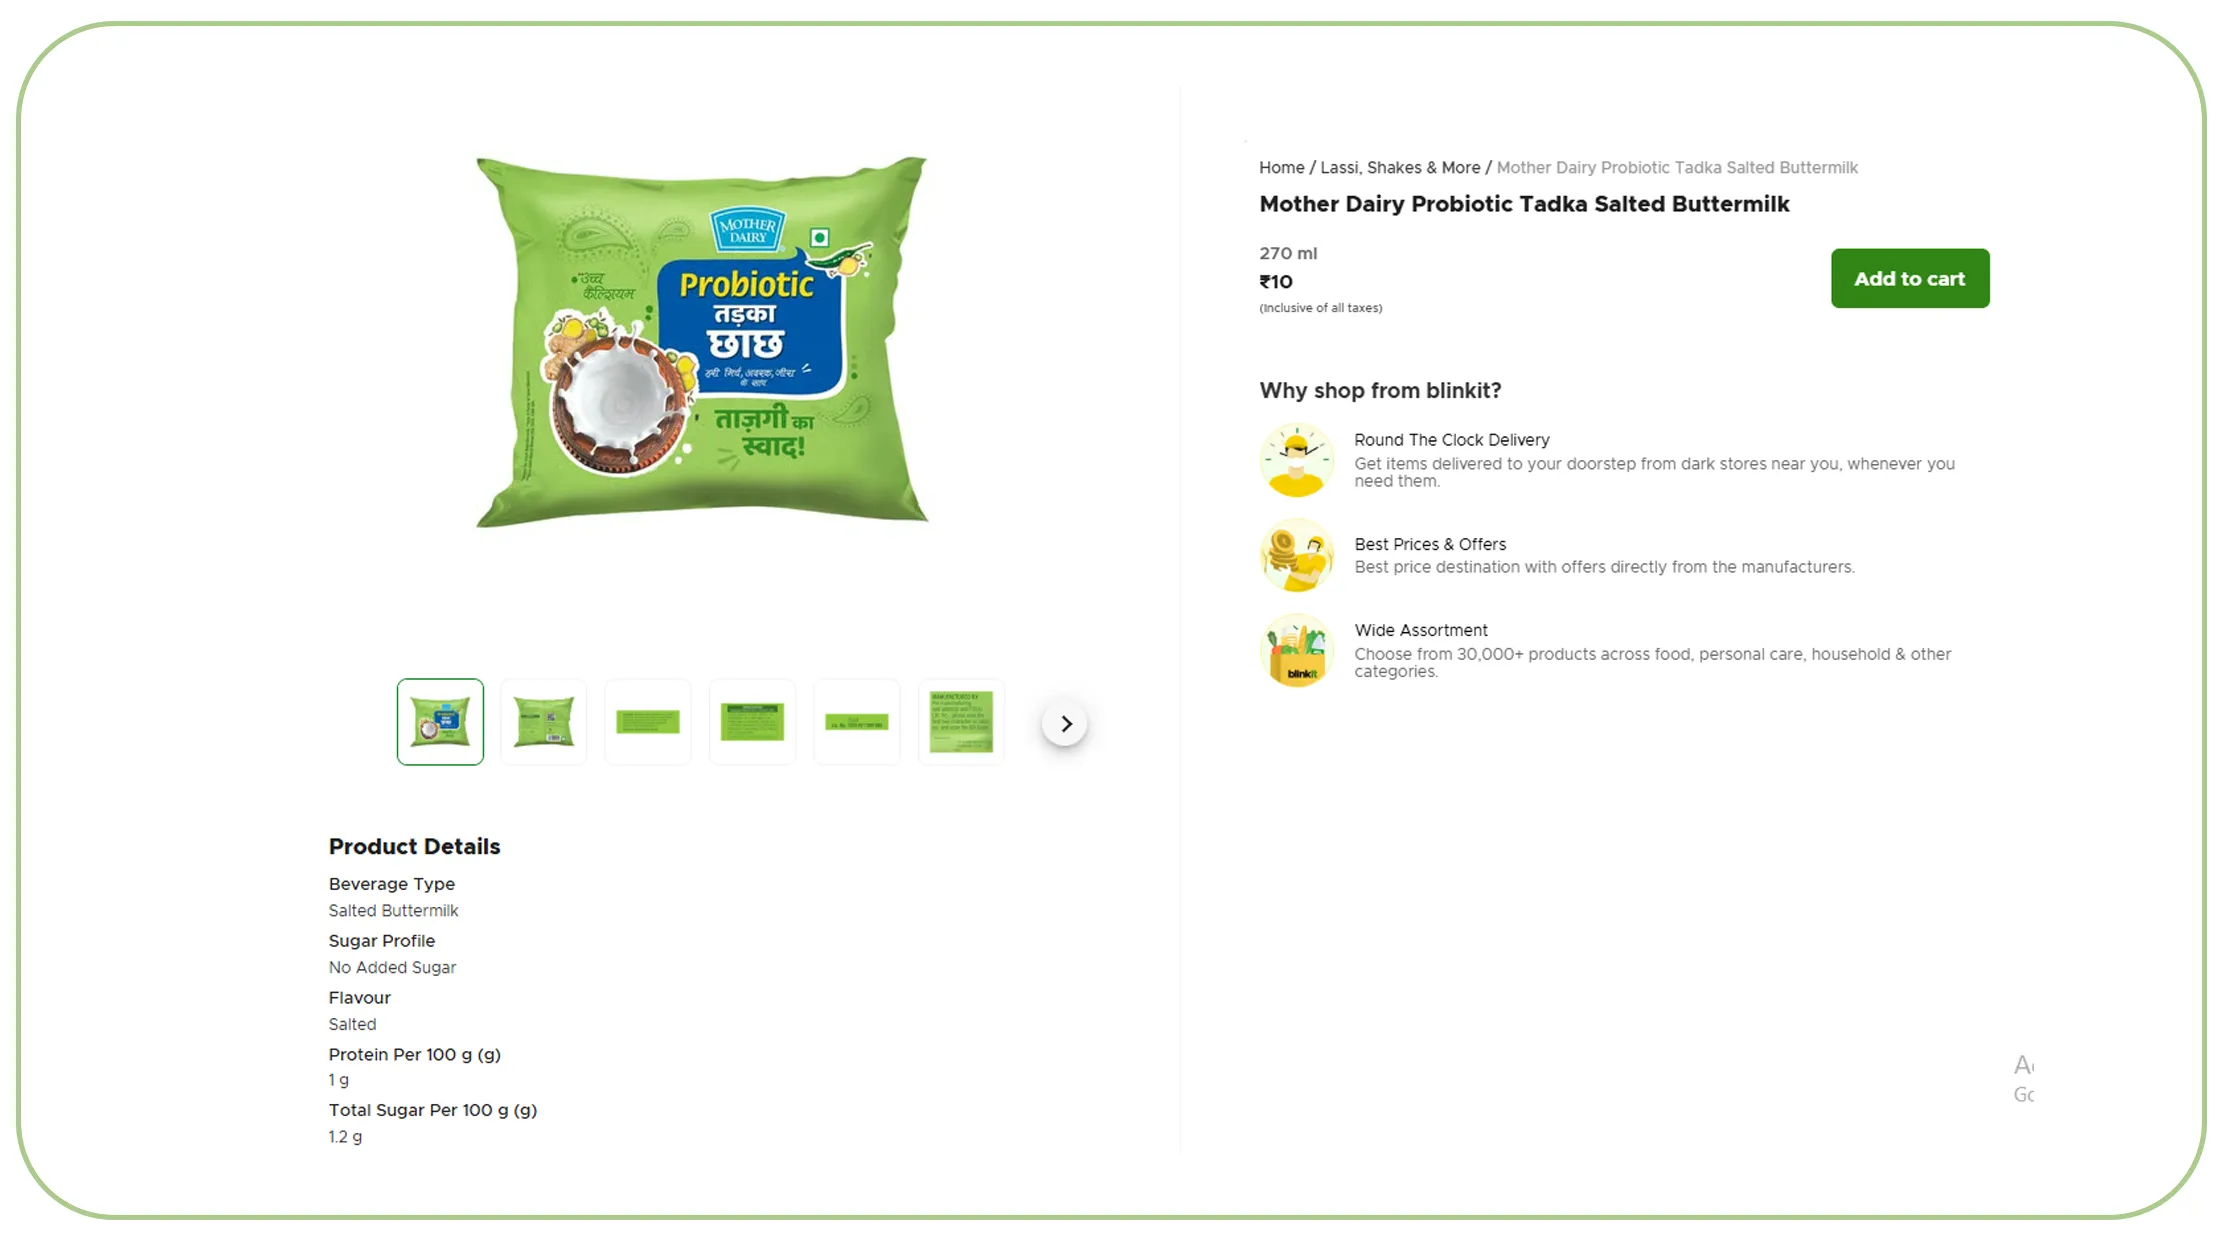
As a result, many organizations are exploring Web Scraping Blinkit Pricing Data for Inflation and Cost Analysis to understand market pricing behavior and consumer purchasing trends.
Blinkit's extensive product catalog provides valuable information across:
- Fresh produce
- Dairy products
- Beverages
- Packaged foods
- Household essentials
Example Category Inflation Trends
| Category | 2020 Index | 2023 Index | 2026 Index |
|---|---|---|---|
| Dairy | 100 | 124 | 137 |
| Vegetables | 100 | 142 | 155 |
| Snacks | 100 | 118 | 131 |
| Beverages | 100 | 116 | 127 |
Key Insights:
- Vegetable inflation often exceeds packaged goods.
- Regional supply shortages impact fresh categories first.
- Promotional activity can temporarily offset inflation.
- Dynamic inventory changes influence pricing frequency.
Tracking these patterns helps businesses understand the relationship between supply, demand, and retail pricing.
What Makes Large-Scale Data Collection More Effective?
Accurate inflation tracking depends on data consistency and coverage.
A robust Quick Commerce Data Scraping API enables organizations to gather millions of pricing records from multiple platforms while maintaining data quality and historical continuity.
Dataset Expansion Trends
| Year | Tracked Products |
|---|---|
| 2020 | 75,000 |
| 2021 | 140,000 |
| 2022 | 260,000 |
| 2023 | 420,000 |
| 2024 | 610,000 |
| 2025 | 830,000 |
| 2026 | 1.1 Million |
Features of Large-Scale Data Collection:
- Historical price storage
- Category classification
- Product matching
- Regional segmentation
- Competitor benchmarking
Businesses can analyze:
- Inflation by geography
- Brand-specific price movements
- Promotional effectiveness
- Supply chain disruptions
These insights support forecasting, procurement planning, and competitive strategy development.
How Does Dynamic Pricing Influence Grocery Inflation?
Retail pricing is no longer static.
Today, Dynamic Pricing plays a major role in determining how grocery prices fluctuate throughout the day.
Quick commerce companies adjust pricing based on:
- Inventory availability
- Demand levels
- Delivery costs
- Weather conditions
- Regional purchasing behavior
Dynamic Pricing Growth
| Year | Products with Dynamic Pricing |
|---|---|
| 2020 | 9% |
| 2021 | 15% |
| 2022 | 23% |
| 2023 | 31% |
| 2024 | 39% |
| 2025 | 47% |
| 2026 | 55% |
Impact on Inflation Analysis:
Dynamic pricing creates:
- Short-term price volatility
- Regional inflation differences
- Frequent promotional adjustments
- Real-time demand signals
Organizations that monitor these changes gain deeper visibility into market conditions and can respond faster to pricing shifts.
As dynamic pricing adoption grows, continuous monitoring becomes increasingly important for accurate inflation measurement.
Why Choose Real Data API?
Businesses need reliable, scalable, and structured data solutions to stay ahead of changing grocery markets.
Real Data API delivers enterprise-grade datasets and APIs that help organizations Scrape grocery price inflation data Using Quick Commerce APIs efficiently and at scale.
Benefits of Real Data API:
- Real-time grocery pricing data
- Extensive product coverage
- Historical inflation tracking
- Regional market intelligence
- Competitor price monitoring
- Scalable API infrastructure
- Clean and structured datasets
- Reliable data delivery
Supported Use Cases:
- Inflation monitoring
- Retail analytics
- Market research
- Competitive intelligence
- Demand forecasting
- Pricing optimization
- Consumer behavior analysis
With access to high-quality grocery datasets, businesses can generate actionable insights faster and improve strategic decision-making.
Conclusion
Real-time grocery inflation tracking has become essential for retailers, brands, analysts, and research organizations. Traditional reporting methods often lag behind market reality, while API-driven pricing intelligence provides immediate visibility into changing consumer costs.
Organizations that Scrape grocery price inflation data Using Quick Commerce APIs gain a significant advantage in forecasting inflation trends, monitoring competitors, optimizing pricing strategies, and understanding market dynamics across regions and product categories.
Ready to unlock real-time grocery pricing intelligence? Contact Real Data API today to access scalable grocery datasets and powerful quick commerce APIs for inflation analysis and market research!
Latest posts
How to Scrape Grocery Price Inflation Data Using Quick Commerce APIs for Real-Time Market Insights?
Real-Time Grocery Price Monitoring Across Blinkit BigBasket and Amazon Fresh - A Complete Guide to Competitive Pricing Intelligence

How Quick Commerce Data Scraping for Digital Shelf Intelligence Helps Brands Win Shelf Space in 2026
Scrape Zepto Data for new Product Launch for CPG brands - Track Availability, Pricing, and Consumer Trends
Real Data API stands out as one of the premier global companies specializing in web data Scraping and web extraction.


Rating 4.7
Rating 4.7
Rating 4.5
Rating 4.7
Rating 4.7


Disclaimer : RealData API functions solely as an independent data infrastructure and technology solutions provider. We build customized automation workflows designed to collect publicly accessible web data based exclusively on client instructions. RealData API neither owns proprietary datasets nor engages in the sale or redistribution of extracted information. Our operations are limited strictly to lawful public web data processing and never involve unauthorized access to restricted systems or private networks. Any company names, trademarks, logos, or brand references displayed on this website are used purely for demonstrative and illustrative purposes to showcase our technical capabilities and do not imply endorsement, partnership, or affiliation. Use of our platform and services remains subject to our Terms of Service.