Quick Summary
- A Blinkit scraper for retail market research helps brands organize publicly accessible product information to study pricing, assortment, promotions, and availability across a fast-moving grocery marketplace.
- A Blinkit API can support structured data access where an authorized interface is available, helping businesses build repeatable retail intelligence workflows.
- Historical comparisons, consistent data collection, and careful validation help teams identify product trends, benchmark competitors, and make better-informed retail decisions without relying on assumptions.
Introduction
India's quick-commerce sector has changed how consumers discover and purchase everyday essentials. For grocery brands, retailers, and market researchers, understanding online product listings, prices, promotional offers, and stock signals is increasingly important. A Blinkit API for retail market research can help organize accessible marketplace information into structured datasets that support competitor benchmarking, assortment planning, and pricing decisions. The usefulness of this data depends on collection frequency, geographic coverage, data quality, and permission to access the relevant information.
Brands can use Blinkit web scraping for grocery product data to study how products are presented online, compare listed prices, identify assortment differences, and monitor changes in promotional messaging. These insights can inform commercial decisions, although online listings do not necessarily represent actual sales, consumer preferences, or inventory across an entire city. Researchers should distinguish observable marketplace information from assumptions and validate conclusions against additional evidence wherever possible.
This article explains how businesses can organize grocery marketplace data, evaluate competitors, monitor product availability, and analyze changes over time from 2020 through 2026. It also outlines practical data-quality considerations, relevant industry context, and how Real Data API can support structured retail data workflows.
Understanding Product Presence Across Local Markets
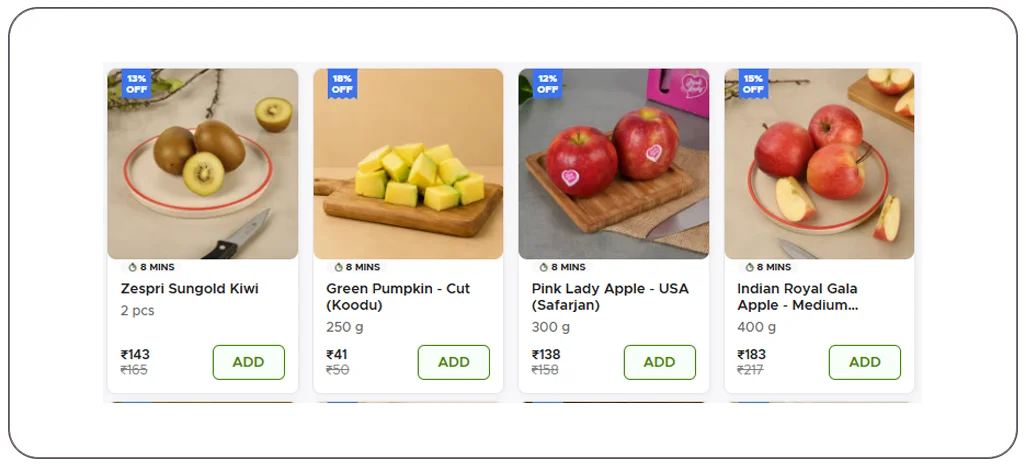
Blinkit grocery availability data collection helps researchers examine whether particular products appear in marketplace listings for a selected service location. Grocery availability can vary with local fulfilment capacity, product assortment, demand, and inventory conditions. A listing visible in one location should not automatically be treated as available in every city or neighbourhood.
For a useful research workflow, businesses can capture product names, brand labels, pack sizes, displayed prices, promotional details, listing status, category labels, and observation timestamps, where access is permitted. Recording the selected location alongside each observation helps analysts distinguish geographical differences from changes over time.
A reliable process should also separate three concepts: a product being listed, a product appearing available to order, and a completed sale. These are different signals, and marketplace listing data alone cannot establish actual sales volume or inventory quantities.
What researchers should record
- Product title, brand, category, and pack size.
- Displayed price and any visible discount.
- Listing status at the time of observation.
- Selected service location and collection timestamp.
- Missing fields, duplicate listings, and changes in product identifiers.
Researchers should preserve the original observation and record corrections separately. This makes it easier to audit changes and identify collection errors.
Industry context: 2020–2026
The available industry evidence shows how the importance of quick-commerce data has grown, although it does not provide a complete annual history of Blinkit-level product availability.
| Year | Verified market context | Research implication |
|---|---|---|
| 2020–2021 | The available sources do not establish comparable annual Blinkit availability figures. | Avoid inventing historical stock or listing counts. |
| 2022 | Bain and Flipkart later reported approximately $1.5 billion in Indian quick-commerce gross merchandise value for 2022. | Market expansion created a stronger case for structured monitoring. |
| 2023–2024 | Quick commerce became a significant part of Indian online grocery shopping. | Location-specific observations help explain assortment differences. |
| 2025–2026 | Industry reporting continued to document expansion and competition in the category. | Consistent data collection supports ongoing competitive research. |
The key is to build a defensible dataset rather than infer historical availability from current listings.
Comparing Prices and Promotional Offers
real-time Blinkit competitor price analysis can help retail teams understand how displayed prices and promotional offers differ across products, pack sizes, locations, and observation periods. The term "real-time" should be used carefully: data is only as current as the collection timestamp, and a captured price may change before a customer completes a purchase.
Price comparisons require product matching before analysis. Two listings with similar names may differ in weight, flavour, formulation, or quantity. Comparing their headline prices without accounting for these differences can produce misleading conclusions.
A practical approach is to calculate unit prices wherever pack information supports the calculation. For example, a price per kilogram or litre can make products with different pack sizes more comparable. Researchers should retain the original displayed price as well as any normalized value.
Useful comparison metrics
| Metric | How it helps |
|---|---|
| Displayed price | Establishes the observed listed price at a particular time. |
| Unit price | Improves comparisons between different pack sizes. |
| Discount amount or percentage | Shows the promotion displayed alongside a listing. |
| Price-change frequency | Measures how often observed prices change in the collected records. |
| Price difference by location | Highlights geographical variation in observed offers. |
A discount should be recorded only when the relevant original price and promotional price are explicitly displayed. Researchers should not assume that a crossed-out price represents a recent selling price or that a promotional offer applies to every customer.
For a historical comparison, analysts can group records by week or month and calculate median observed prices, price ranges, and the frequency of recorded changes. Missing observations should remain visible in the analysis rather than being treated as proof that a product was unavailable.
Important distinction: a price-monitoring dataset measures observed marketplace listings. It does not independently establish competitors' margins, supplier costs, or sales performance.
Building a Repeatable Data-Access Workflow
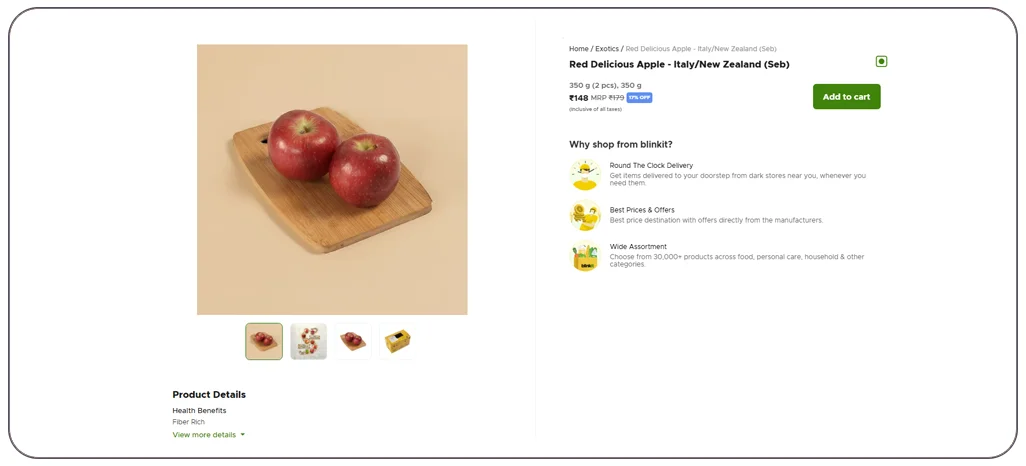
A Blinkit API for grocery price tracking may be useful when an authorized interface provides the fields and access frequency required for a research project. An API is not automatically available simply because a marketplace displays product information, so businesses should verify access permissions, documentation, authentication requirements, and applicable usage conditions before implementation.
An API-based workflow can make it easier to standardize field names, validate records, schedule permitted requests, and transfer structured data into analytics systems. Where no authorized API is available, teams should evaluate other permitted data-access arrangements rather than assume unrestricted automated access.
The underlying workflow should include four stages:
- Collection: obtain approved product records with timestamps and relevant location information.
- Validation: check missing values, inconsistent pack sizes, duplicate records, and unexpected price changes.
- Storage: retain historical observations with stable product identifiers where possible.
- Analysis: generate comparisons, trend summaries, and reports for commercial teams.
Why timestamps and validation matter
Suppose a team compares prices observed on Monday with prices captured several days later. Without timestamps, analysts may mistake differences in collection timing for a competitor's pricing strategy. Similarly, a missing listing could reflect a temporary issue, a location-specific assortment, or a collection failure.
For that reason, a robust system should preserve collection status, distinguish confirmed observations from incomplete records, and flag unusually large changes for review.
Blinkit's official terms of use should be reviewed before choosing a collection method. Businesses should follow applicable contractual restrictions, privacy requirements, and access controls, and avoid circumventing technical protections. The goal is not simply to collect more records. It is to produce reliable, traceable information that can support repeatable business decisions.
Looking to build a structured retail intelligence workflow? Explore how Real Data API can help your team plan its data requirements and evaluate suitable collection options.
Get Insights Now!Turning Product Records into Actionable Insights
A Blinkit Product Data Scraper is often discussed as a way to organize product attributes for analysis, but implementation must begin with permission to access and reuse the relevant data. Blinkit's terms of use explicitly restrict commercial use, data mining, robots, and extraction of product listings, descriptions, and prices without the required authorization.
Businesses should therefore establish an approved data-access arrangement before deploying automated collection tools.
Once access is authorized, product records can support several types of analysis. Category managers can compare listed pack sizes, brands, product variants, and displayed prices. Marketing teams can review visible promotional messages, while assortment planners can identify differences in listed product ranges across selected locations.
From records to decisions
- Product matching: standardize brand names, pack sizes, and product identifiers to avoid duplicate comparisons.
- Category analysis: measure how many distinct products are represented in each category within the collected dataset.
- Promotion monitoring: distinguish visible offers from ordinary displayed prices.
- Change detection: flag changes in product descriptions, pack sizes, or listing status for review.
- Reporting: present verified observations with timestamps and clear definitions.
These methods become more valuable when analysts preserve a consistent measurement approach. A change in the number of collected records, for instance, could reflect a different collection scope rather than a genuine expansion in product assortment.
Businesses should document data provenance, permitted usage, collection limitations, and quality checks. This makes reports easier to audit and helps decision-makers understand what the evidence actually supports.
Creating a Consistent Historical Research Resource
A Blinkit Grocery Dataset can organize authorized observations into a structured format for longitudinal research. Rather than keeping isolated screenshots or disconnected spreadsheets, researchers can preserve standardized product attributes, observation dates, location identifiers, displayed prices, and availability indicators.
A historical dataset is only useful when its limitations are clear. Current observations cannot reliably reconstruct earlier prices or availability unless historical records were collected and retained at the time. Similarly, gaps in the data should not be filled with estimated prices or invented stock figures.
Suggested dataset structure
| Field | Purpose |
|---|---|
| Observation date | Identifies when the record was captured. |
| Product identifier | Helps match the same item across observations. |
| Product and brand names | Supports product-level and brand-level analysis. |
| Pack size and unit | Enables comparable unit-price calculations. |
| Displayed price | Preserves the observed listing price. |
| Promotion details | Records discounts explicitly shown. |
| Location identifier | Supports comparisons across authorized service areas. |
| Observation status | Distinguishes successful observations from missing or incomplete records. |
Historical market reports can provide context, but they should not be mistaken for product-level platform data. Bain and Flipkart's How India Shops Online 2025 estimated India's quick-commerce gross merchandise value at approximately $6–7 billion in 2024, compared with approximately $1.5 billion in 2022. The report also estimated that quick commerce accounted for around 70–75% of Indian e-grocery gross merchandise value in 2024.
These figures describe the wider industry, not Blinkit's individual product prices or inventory. A well-documented dataset keeps those distinctions intact while helping researchers compare observed product-level changes against broader market developments.
Evaluating Changes in the Quick-Commerce Landscape
Blinkit Quick Commerce Data Scraping should be considered within a wider research framework that distinguishes marketplace observations from industry-wide performance. Quick commerce has expanded beyond its initial emphasis on groceries, and industry analysis now includes additional product categories, evolving customer behaviour, and growing competitive pressure.
Bain and Flipkart's 2025 report identified quick commerce as a major development in Indian e-retail. It reported that the segment's market value had increased from approximately $1.5 billion in 2022 to $6–7 billion in 2024. The same report projected annual growth above 40% through 2030. This is a forecast, not a verified outcome for 2026 or later.
What the 2020–2026 timeline can establish
| Period | Evidence-based interpretation |
|---|---|
| 2020–2021 | The sources cited here do not provide a comparable annual Blinkit product-level series. |
| 2022 | Bain and Flipkart estimated quick-commerce gross merchandise value at approximately $1.5 billion. |
| 2023 | Their industry analysis described rapid order growth and increasing relevance to e-grocery spending. |
| 2024 | The estimated segment value reached $6–7 billion, according to the 2025 report. |
| 2025 | The report documented expansion across categories and customer segments. |
| 2026 | A new How India Shops Online 2026 report, covered by NDTV Profit in April 2026, estimated India's overall e-retail market at $65–66 billion for 2025. This is an industry estimate, not a Blinkit-specific measurement. |
For retail teams, the practical opportunity is to compare properly authorized, timestamped product observations with credible market research. That combination can help identify changing assortment patterns, pricing differences, and category-level developments without presenting projections as actual results.
Any automated data collection should remain within the applicable access permissions and contractual restrictions. When permission is not available, researchers should rely on licensed datasets, approved interfaces, or published market reports.
Why Choose Real Data API?
Retail intelligence projects require more than a collection mechanism. They need clearly defined data requirements, consistent field structures, documented access permissions, and validation procedures that help teams trust the resulting analysis.
A Blinkit scraper for retail market research can be a useful research concept when the data collection process is authorized and the resulting dataset is fit for the intended business purpose. Before selecting a solution, businesses should assess:
- Data requirements: identify the product fields, categories, locations, and historical periods required for the analysis.
- Data quality: define checks for duplicates, missing values, incorrect units, and inconsistent product identifiers.
- Historical coverage: verify which observation dates are genuinely available instead of assuming historical data can be reconstructed.
- Usage permissions: confirm the applicable rights to access, store, analyze, and reuse marketplace information.
- Integration needs: determine how approved records will move into dashboards, reporting systems, and analytics workflows.
Real Data API can be considered when evaluating retail data requirements and structured research workflows. Businesses should confirm the availability, provenance, permitted use, and specific capabilities of any proposed data service before relying on it for commercial decisions.
The objective is to turn properly sourced information into useful evidence—not simply to accumulate product records.
Conclusion
Online grocery marketplaces provide a valuable research context for understanding how product listings, displayed prices, promotions, and assortment patterns change over time. However, useful insights depend on reliable observations, consistent comparisons, and a clear distinction between marketplace data and actual consumer purchasing behaviour.
A Blinkit scraper for retail market research can support a structured analytical approach when collection and reuse are expressly permitted. Combining verified product observations with credible industry reports helps brands assess competitive positioning, identify changes in listed offerings, and develop better-informed pricing and assortment strategies.
For businesses planning a retail intelligence initiative, the next step is to define the research questions, identify an authorized data source, establish validation rules, and select reporting metrics that align with commercial objectives.
Ready to strengthen your retail research strategy? Contact Real Data API to discuss your data requirements and explore suitable, authorized data solutions for your business.
FAQs
1. What is a Blinkit scraper for retail market research?
It refers to a data collection approach for studying marketplace listings, displayed prices, promotions, and product availability, subject to applicable permissions, platform terms, and data-use restrictions.
2. How can a Blinkit API support grocery research?
A Blinkit API may provide structured access to permitted product information where an authorized interface exists, supporting consistent data processing, validation, storage, and reporting.
3. Is Blinkit web scraping for grocery product data permitted?
Blinkit web scraping for grocery product data must comply with applicable access permissions. Blinkit's published terms restrict automated extraction and commercial reuse without the required authorization.
4. Why is Blinkit grocery availability data collection useful?
Blinkit grocery availability data collection can help researchers compare observed listing status across locations and dates, provided collection is authorized and temporary availability changes are interpreted carefully.
5. How does real-time Blinkit competitor price analysis help brands?
Real-time Blinkit competitor price analysis helps brands compare timestamped displayed prices and visible promotions, identify price differences, and evaluate competitive positioning without assuming access to actual sales or margins.
Latest posts

How to Use a Meesho ecommerce scraper 2026 to Analyze Product Listings, Pricing, and Market Opportunities
How a Blinkit scraper for retail market research Helps Brands Track Competitor Pricing and Product Trends
Why Businesses Need a Flipkart India daily ecommerce dataset for market research for Smarter Retail Decisions
Grocery Data Scraping for Competitive Benchmarking - Key Strategies for Retail Success in 2027






.png)



