.gif)
.png)
Introduction
For a modern brand, the shelf is online, and it differs by platform and city. Digital shelf analytics means monitoring how your products appear on marketplaces: price, availability, content, rankings and seller behaviour.
Key metrics
- Price and discount: is the selling price below MAP/MRP guidelines?
- Availability: in-stock rate by platform and location
- Search rank: where your product appears for key search terms
- Content quality: title, images, bullet points and A+ content
- Ratings and reviews: average rating and review trends
- Share of shelf: your SKUs vs competitors on category pages
Platforms to cover
A complete view in India spans quick commerce (Blinkit, Instamart, Zepto), general marketplaces (Amazon, Flipkart), beauty (Nykaa) and fashion (Myntra). Each requires its own extraction logic.
Using e-commerce data scraping, brands can monitor product listings, prices, and availability across multiple platforms instead of checking each marketplace manually.
Seller-level information
Electronics and appliance brands often need to know who is selling their product. Seller-level data shows which sellers list a SKU, at what price and with what fulfilment. This helps catch unauthorised sellers and price undercutting on Amazon, Flipkart, Croma, Vijay Sales and Reliance Digital. The brand usually supplies the SKU or model list, and the pipeline tracks each across platforms.
How brands act on the data
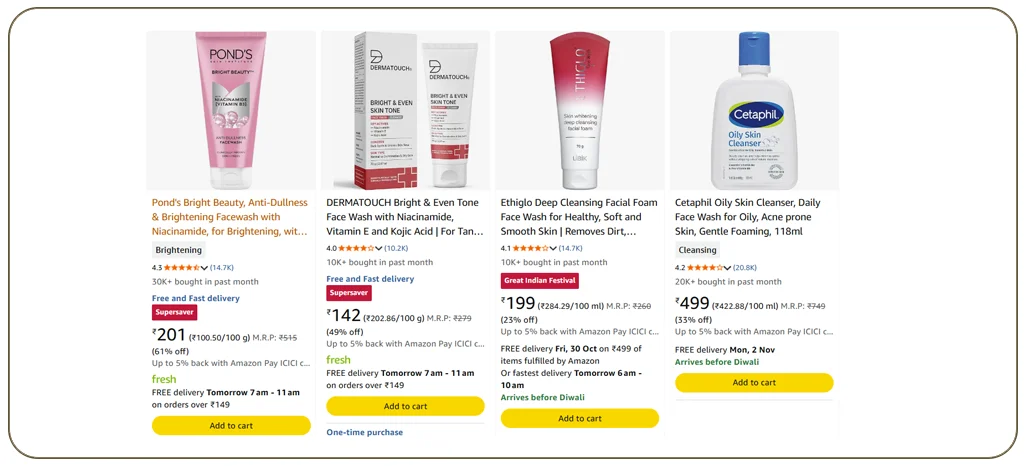
- Alert channel teams when prices fall below agreed levels
- Fix poor content or missing images
- Reallocate ad spend towards products with low search visibility
The building blocks of a digital shelf analytics programme
- Product catalogue: your list of SKUs with model numbers, EANs and key attributes.
- Platform coverage: the marketplaces and quick-commerce apps where you sell.
- Location coverage: the cities or pincodes where availability and price matter.
- Collection schedule: daily for price and stock, weekly for content and reviews.
- Reporting layer: dashboards and alerts that turn raw data into actions.
Share of shelf and share of search
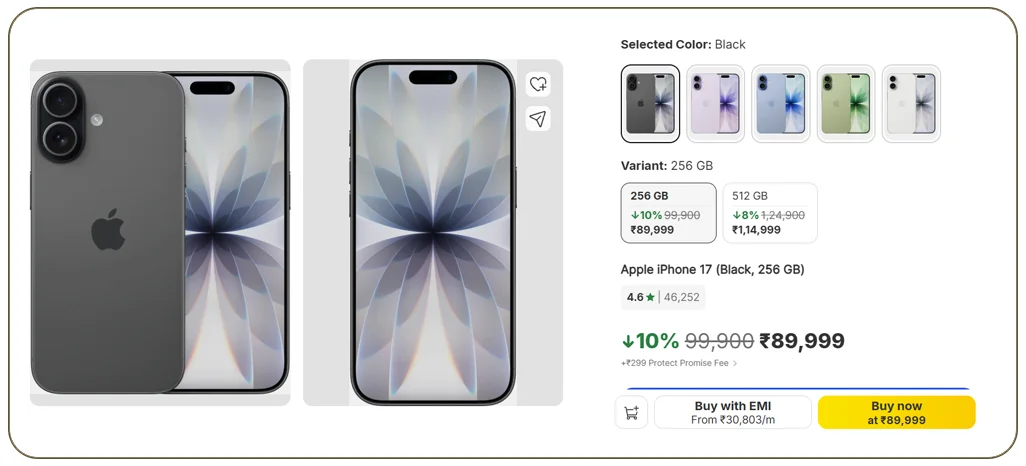
Share of shelf measures how much of a category page your products occupy. Share of search measures how often you appear in the top results for important keywords. Both can be tracked by platform and by city, and both help you decide where to invest in ads, content or distribution.
Content quality scoring
Search rank is influenced by listing quality. A simple content score can check whether the title follows your naming standard, whether the product has enough images, whether bullet points and descriptions are present, and whether the rating is above a threshold you set. Low-scoring listings become a clear to-do list for the e-commerce team.
Example: an electronics brand monitoring sellers
An appliance brand sells through its own store, Amazon, Flipkart, Croma, Vijay Sales and Reliance Digital. By tracking each model across these platforms, it notices that one unauthorised seller is listing a model well below the agreed price on a marketplace. The channel team can raise the issue the same day, instead of discovering it in a monthly report.
Why choose Real Data API for digital shelf analytics
Real Data API collects data across marketplaces and quick-commerce apps and delivers it in a single, consistent structure that plugs into your dashboard. You provide the SKU list, and the rest, from matching to scheduling, is handled for you.
The collected information can support pricing comparisons, availability monitoring, seller analysis, and product performance reporting. With structured data delivered through an e-commerce scraping API or other suitable formats, brands can integrate marketplace insights into their existing analytics workflows.
FAQs
1. Do I need to provide product lists?
Yes, SKU or model lists make matching accurate.
2. How are products matched across sites?
By model number, EAN/GTIN or a combination of attributes.
3. How often should digital shelf data be collected?
Price and availability are usually collected daily or several times a day, while content and review data can be collected weekly.
4. Can I monitor competitor products too?
Yes. Competitor SKUs can be added to the same tracking list for side-by-side comparison.
5. Can the data feed my existing dashboard?
Yes. Data can be delivered as an API, files or direct database loads that work with common BI tools.
6. Does it work for beauty and fashion brands?
Yes. Platforms such as Nykaa and Myntra can be included alongside Amazon, Flipkart and quick-commerce apps.
Conclusion
Digital shelf analytics in India is no longer optional for brands that sell across Amazon, Flipkart, Blinkit, Nykaa and Myntra. Consistent, location-wise data on price, availability, content and sellers helps brands protect margins, fix visibility gaps and respond faster to competitors.
Want a digital shelf dashboard? Real Data API can feed your BI tool with daily data.
Latest posts

How Mobile app scraping for app-based e-commerce data Enables Smarter E-commerce Analytics, Competitor Analysis, and Market Research
Digital Shelf Analytics for Indian Brands: Tracking Blinkit, Amazon, Flipkart, Nykaa & Myntra
UAE Grocery Price Scraping – Lulu, Carrefour, Spinneys, Waitrose & Instashop
Fashion Catalogue Scraping Across Countries: H&M Saudi, Zalando Germany & D2C Brands



.png)


