Quick Summary
- extracting Bilibili API data for social media analytics helps brands understand video performance, audience engagement, creator activity, and content trends using structured platform information.
- A Bilibili Social Media Dataset can bring together video metrics, creator details, engagement signals, categories, and timestamps for deeper content and competitive analysis.
- Automated collection helps marketing teams reduce manual research, identify high-performing content, compare trends, and make evidence-based social media decisions.
Introduction
Brands can improve social media decisions by systematically analyzing video performance, engagement, creators, and audience trends. extracting Bilibili API data for social media analytics provides a structured approach to transforming platform information into insights that marketing, content, research, and strategy teams can use.
Bilibili is a major video-sharing and content platform with a strong presence in China and a distinctive community-driven ecosystem. Its content spans gaming, animation, entertainment, technology, education, lifestyle, music, and other categories. For brands targeting digitally engaged audiences, understanding which content attracts attention can provide useful signals for content planning and market research.
A Bilibili Social Media Dataset can organize information such as video titles, creators, categories, publication dates, views, likes, comments, shares, and other available engagement indicators. When these records are collected consistently, analysts can compare performance across content types and time periods.
The key advantage is scale. A marketing team manually reviewing hundreds of videos may struggle to maintain consistent records. An automated workflow can collect structured information according to defined parameters and support recurring analysis.
This enables businesses to answer practical questions: Which topics generate the strongest engagement? Which creators are gaining visibility? Which content formats perform best? How quickly does engagement change after publication? Which categories show sustained audience interest?
How Can Brands Identify High-Performing Bilibili Content?
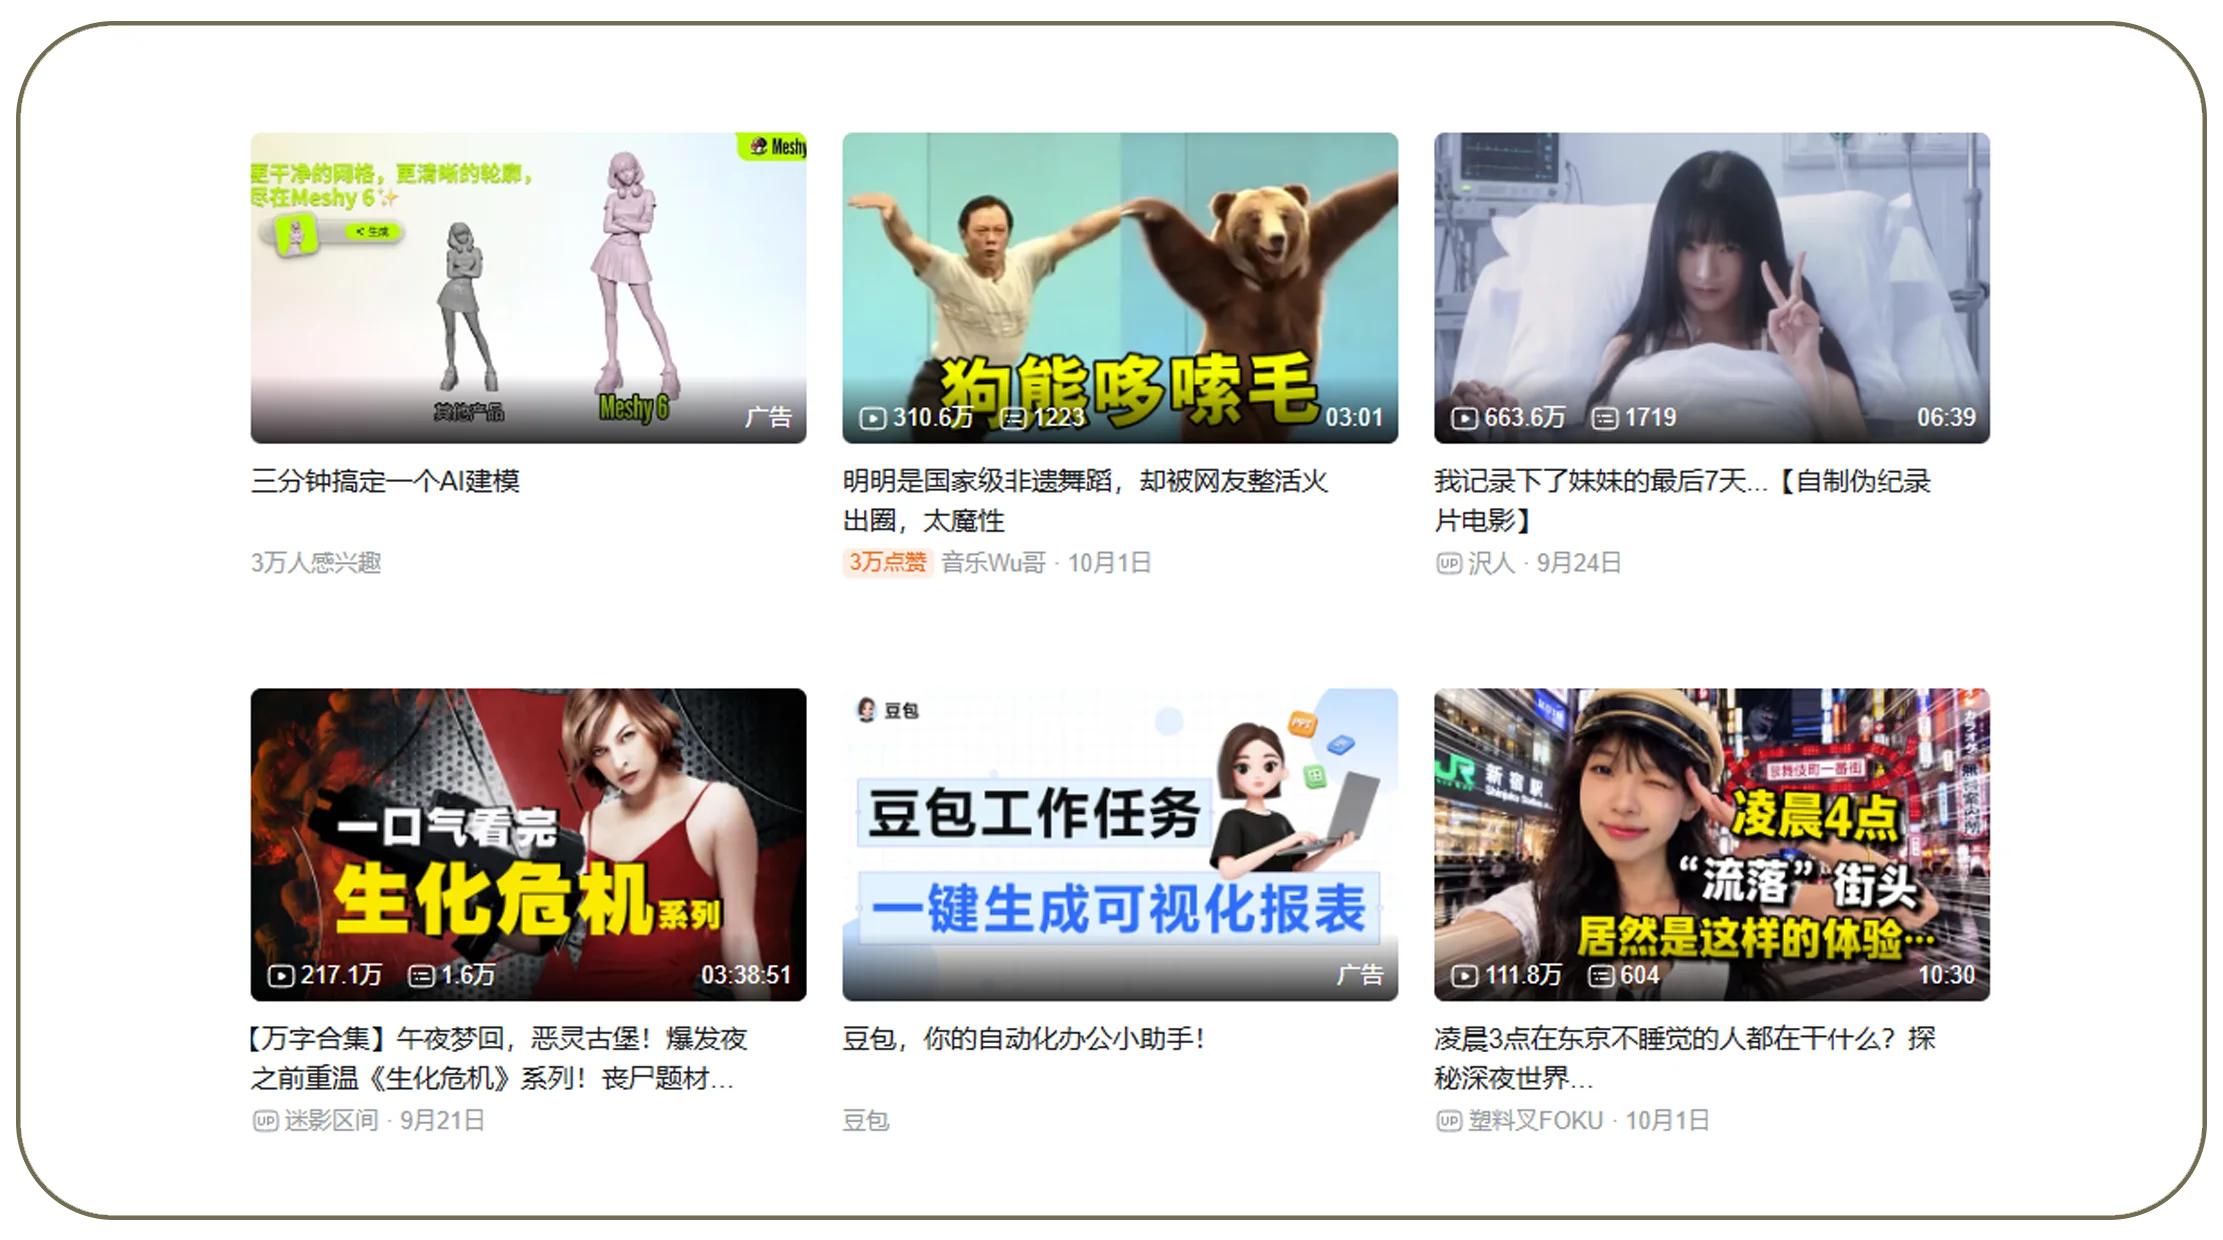
Brands need reliable content signals before deciding which topics, formats, and creators deserve additional attention. scrape Bilibili content data workflows can help organize publicly accessible information into comparable records for content research and performance analysis.
For example, a brand studying technology content could compare hundreds of videos by category, creator, publication date, views, comments, and engagement ratios. This makes it easier to identify recurring patterns rather than basing decisions on a few manually reviewed videos.
Useful content fields
| Data Field | Analytics Application |
|---|---|
| Video title | Topic analysis |
| Creator | Influencer research |
| Category | Content segmentation |
| Publication date | Trend analysis |
| Views | Reach measurement |
| Likes | Positive engagement |
| Comments | Audience discussion |
| Shares | Content amplification |
| Duration | Format comparison |
| URL/ID | Record identification |
2020–2026 evolution
2020: Video consumption accelerated as digital audiences increasingly relied on online entertainment and creator content.
2021: Brands expanded their focus from traditional social metrics toward creator-led content and audience communities.
2022: Short-form and long-form video strategies increasingly required performance comparisons across content categories.
2023: Social analytics became more focused on identifying audience preferences and emerging creators.
2024: Brands increasingly combined engagement metrics with content classification and competitive research.
2025: Automated data collection became more valuable for organizations analyzing large content libraries.
2026: Social intelligence workflows increasingly connect historical content datasets with advanced analytics and AI-assisted research.
The timeline above summarizes broad industry developments rather than claiming a single-source measurement.
Content analysis metrics
| Metric | What It Can Indicate |
|---|---|
| Views | Audience reach |
| Likes | Positive response |
| Comments | Discussion intensity |
| Shares | Potential amplification |
| Engagement rate | Relative performance |
| Publishing frequency | Creator activity |
| Topic frequency | Content trends |
A useful analysis should avoid treating views as the only measure of success. A video with fewer views but substantially stronger comment activity may reveal deeper audience interest. Similarly, a rapidly growing creator can represent an emerging opportunity even before reaching the largest audiences.
What Makes a Scalable Data Collection Strategy Effective?
Large-scale social media research requires consistency. If data is collected manually, teams may record different fields, miss changes, or struggle to maintain historical records.
Businesses can use Bilibili social media data collection services to establish recurring workflows around their specific research objectives. A well-designed process can define target content, collect relevant fields, validate records, and deliver structured datasets for analysis.
Typical collection workflow
- Define the research objective – Identify whether the goal is competitor analysis, creator discovery, content research, or audience intelligence.
- Select relevant sources – Determine categories, creators, videos, keywords, or other permitted targets.
- Specify data fields – Establish the exact information required.
- Automate collection – Schedule recurring retrieval where appropriate.
- Normalize records – Standardize dates, categories, identifiers, and other fields.
- Validate information – Detect missing, duplicate, or inconsistent records.
- Store historical snapshots – Preserve changes over time.
- Deliver analytics-ready data – Connect outputs with dashboards or analytical systems.
Illustrative collection scale
| Research Scope | Example Dataset Size |
|---|---|
| 100 creators | 10,000 video records* |
| 500 creators | 50,000 video records* |
| 1,000 creators | 100,000 video records* |
| 5,000 creators | 500,000 video records* |
Illustrative planning examples, not measured Bilibili platform statistics. Actual dataset size depends on creator activity, selected categories, collection scope, and project requirements.
2020–2026 progression
Between 2020 and 2022, social research increasingly moved toward broader video and creator datasets. From 2023 onward, organizations placed greater emphasis on historical records and structured analytics. By 2025–2026, businesses increasingly expected social data workflows to integrate with dashboards, research environments, and AI-enabled analysis.
The strongest collection strategy starts with the business question rather than the technology. If a brand wants to identify emerging creators, creator-level fields may be more important than collecting every available video attribute. If the objective is content benchmarking, video-level performance metrics become more important.
How Can Engagement Metrics Reveal Audience Preferences?

Engagement provides context behind content visibility. Bilibili engagement data extraction can help brands examine how viewers respond to different videos, creators, categories, and publishing strategies.
A useful engagement analysis compares multiple signals instead of relying on a single metric.
Example engagement framework
| Signal | Possible Interpretation |
|---|---|
| Views | Content exposure |
| Likes | Viewer approval |
| Comments | Audience discussion |
| Shares | Distribution potential |
| Favorites | Long-term interest |
| Engagement rate | Relative audience response |
A simplified engagement rate can be calculated as:
Engagement Rate = (Likes + Comments + Shares) ÷ Views × 100
This formula is an analytical example. Different organizations may use different definitions depending on available fields and reporting objectives.
2020–2026 development
2020: Views were commonly used as a primary indicator of digital content reach.
2021: Brands increasingly considered likes, comments, and creator activity alongside views.
2022: Engagement comparisons became more important for evaluating content quality and audience response.
2023: Businesses increasingly segmented engagement by content category and creator.
2024: Historical engagement analysis supported more detailed content benchmarking.
2025: Automated datasets enabled teams to compare larger numbers of videos consistently.
2026: Advanced analytics increasingly combines engagement signals with content themes, creator characteristics, and historical trends.
What can brands learn?
Engagement analysis can reveal:
- Which categories generate strong audience interaction.
- Which creators consistently attract discussion.
- Which publishing periods correlate with stronger responses.
- Which topics generate unusually high engagement.
- Whether content performance changes over time.
- Which formats deserve additional testing.
For marketing teams, the practical value comes from turning these observations into experiments. A brand might identify a high-performing topic, test a related format, compare results, and update its content strategy based on evidence.
Turn social engagement signals into structured intelligence and use them to build a more measurable, data-driven content strategy!
Get Insights Now!How Can Video-Level Analysis Improve Content Strategy?
Video content contains more information than basic engagement numbers. Bilibili video data scraping can support research into titles, categories, creators, publication dates, video attributes, and performance signals.
For content teams, this creates an opportunity to analyze what successful videos have in common. Analysts can categorize titles by themes, identify frequently used topics, compare publishing patterns, and measure performance across content segments.
Example video intelligence model
| Analysis Area | Example Question |
|---|---|
| Topic | Which subjects attract attention? |
| Creator | Which creators lead a category? |
| Timing | When is content published? |
| Format | Which formats perform well? |
| Engagement | Which videos generate discussion? |
| Trend | Which topics are growing? |
| Competition | How are competing brands positioned? |
2020–2026 progression
2020: Video analytics primarily focused on reach and basic engagement.
2021: Creator and content-category analysis became increasingly important.
2022: Brands expanded research into content formats and audience preferences.
2023: Competitive video analysis became more structured as creator ecosystems expanded.
2024: Businesses increasingly combined video metadata with engagement information.
2025: Large historical datasets supported deeper content benchmarking.
2026: Video intelligence increasingly supports automated topic discovery, trend analysis, and AI-assisted content research.
Practical content workflow
A brand can create a video intelligence pipeline by:
- Defining target categories.
- Identifying relevant creators.
- Collecting selected video fields.
- Recording engagement observations.
- Categorizing content themes.
- Comparing historical performance.
- Identifying outliers.
- Testing insights in future campaigns.
This approach can help content teams move from intuition-led planning to evidence-based experimentation.
For example, if a category consistently produces strong comment activity but moderate views, the opportunity may be community depth rather than mass reach. Conversely, high views combined with weak interaction could indicate broad exposure but limited audience involvement.
How Do Structured Datasets Support Social Media Intelligence?
A large collection of individual records becomes more useful when it is organized into a consistent analytical structure. Social Media Datasets can combine content, creator, engagement, category, and temporal information to support broader research.
A structured dataset can also make it easier to connect social signals with internal marketing data. Teams may compare social content performance with campaign calendars, product launches, regional activity, or other business events.
Example dataset structure
| Dataset Layer | Example Fields |
|---|---|
| Creator | Creator ID, name, category |
| Video | Video ID, title, URL |
| Content | Topic, category, format |
| Engagement | Views, likes, comments |
| Time | Publication date, collection date |
| Performance | Engagement rate, growth |
| Classification | Brand, competitor, topic |
2020–2026 development
2020: Social datasets were often collected for individual campaigns or research projects.
2021: Brands increasingly wanted creator and content information together.
2022: Multi-dimensional datasets became more useful for audience and competitive analysis.
2023: Historical social datasets supported trend identification and benchmarking.
2024: Businesses increasingly connected social data with broader marketing intelligence.
2025: Structured datasets became more important for scalable analytics and automated reporting.
2026: Social datasets increasingly serve as inputs for AI, machine learning, trend discovery, and content intelligence systems.
Key data-quality principles
Consistency: Use standardized field names and formats.
Traceability: Retain source identifiers and timestamps.
Historical continuity: Preserve snapshots so changes can be measured.
Deduplication: Prevent repeated records from distorting metrics.
Validation: Check missing, malformed, or unexpected values.
Classification: Apply consistent categories and topic labels.
The dataset should be designed around future analysis. If a business expects to compare creators over six months, timestamps and stable creator identifiers are essential from the beginning.
How Can Automated Social Data Collection Scale Across Research Projects?
Organizations often begin with one social media research question and later expand into creator monitoring, competitor intelligence, content discovery, and trend analysis.
Social Media Data Scraping can provide the foundation for recurring collection workflows when businesses need structured information at scale.
A scalable architecture separates data acquisition from data processing. Raw information can first be collected, then parsed and normalized before being stored in an analytical environment.
Example architecture
| Layer | Function |
|---|---|
| Source layer | Identify permitted data sources |
| Collection layer | Retrieve relevant information |
| Parsing layer | Convert content into fields |
| Validation layer | Check data quality |
| Storage layer | Maintain historical records |
| Analytics layer | Calculate trends and metrics |
| Visualization layer | Present insights |
| Alert layer | Highlight meaningful changes |
2020–2026 progression
2020: Social analytics was frequently campaign-specific.
2021: Creator monitoring expanded across digital marketing programs.
2022: Businesses increasingly needed repeatable social intelligence workflows.
2023: Historical datasets became useful for competitive and content benchmarking.
2024: Automated pipelines supported larger creator and video monitoring programs.
2025: Integration with analytics platforms became increasingly important.
2026: Scalable social data pipelines increasingly support AI-driven research, content intelligence, and automated insight generation.
The most effective approach is selective rather than indiscriminate. Businesses should identify the creators, categories, videos, and metrics that directly support their goals.
A media company may prioritize topic trends. A consumer brand may focus on creator performance. A marketing agency may require competitor benchmarking. A research organization may need historical records across multiple categories.
Why Choose Real Data API?
A reliable data infrastructure should make collection scalable while keeping the resulting information structured and usable. Web Scraping API technology can provide an automated foundation for retrieving web-based information and feeding it into downstream workflows.
For social media analytics projects, the technology should be evaluated according to practical requirements:
- Required data fields
- Collection frequency
- Dataset size
- Historical retention
- Data validation
- Product or creator matching
- Output formats
- Analytics integration
- Monitoring requirements
- Scalability
Real Data API can help businesses design data workflows around specific analytical objectives rather than collecting unnecessary information.
A successful project should define the required fields first, establish quality rules second, and determine delivery and analytics requirements before implementation.
For organizations evaluating extracting Bilibili API data for social media analytics, this structured approach can make the resulting data easier to analyze, compare, and operationalize.
Conclusion
Brands can make better content and marketing decisions when they have structured visibility into video performance, creators, engagement, categories, and audience trends. extracting Bilibili API data for social media analytics provides a practical foundation for turning platform information into measurable intelligence.
The value increases when data is collected consistently and preserved historically. Instead of viewing individual videos in isolation, businesses can identify patterns across creators, topics, categories, publishing periods, and engagement levels.
For content teams, these insights can support topic selection and content experimentation. For marketing managers, they can inform creator partnerships and campaign planning. For researchers, they can provide a structured view of changing social media behavior.
The most effective strategy is to begin with a specific business question, collect only the information needed to answer it, validate the dataset, preserve historical observations, and connect the results with analytics workflows.
Ready to transform Bilibili data into actionable content and audience intelligence? Contact Real Data API to discuss a scalable social media data workflow tailored to your research and marketing goals!
FAQs
1. What is the value of extracting Bilibili data for brands?
extracting Bilibili API data for social media analytics helps brands evaluate content performance, identify audience trends, compare creators, and discover topics that can inform future marketing strategies.
2. What information can a Bilibili dataset contain?
A Bilibili Social Media Dataset can organize available video titles, creators, categories, publication dates, views, likes, comments, shares, identifiers, and other relevant content fields.
3. How can brands monitor videos at scale?
Brands can scrape Bilibili content data through automated workflows that organize selected video information, preserve timestamps, validate records, and prepare datasets for recurring content and competitive analysis.
4. Why are engagement metrics useful for marketing?
Bilibili engagement data extraction enables teams to compare views, likes, comments, shares, and other available signals to identify audience response patterns across creators and content categories.
5. Can Real Data API support recurring collection?
Yes. Real Data API can help organizations establish scalable workflows using Bilibili social media data collection services for structured datasets, recurring monitoring, analytics, and business-specific social intelligence requirements.
Latest posts
How ecommerce scraping API for real-time product data Helps Businesses Track Prices, Inventory, and Competitor Changes
How Web Scraping APIs for Business Data Improve Pricing and Product Insights
How Extracting Bilibili API Data for Social Media Analytics Helps Brands Track Content, Engagement, and Audience Trends

How Prom.ua scraper Helps Businesses Collect Marketplace Data for Competitive Pricing and Product Intelligence






.png)



