Quick Summary
- Swiggy API for real-time food delivery data helps restaurants, food brands, analysts, and retailers monitor changing menus, prices, offers, availability, and competitive activity from a large digital food marketplace.
- Swiggy Food Data Scraping can convert publicly accessible food-delivery information into structured records for pricing analysis, restaurant intelligence, menu monitoring, and market research.
- Swiggy's reported scale demonstrates why timely food-market intelligence matters: FY2025 recorded 628.9 million food-delivery orders, while FY2026 food-delivery GOV reached ₹9,005 crore in Q4.
Introduction
Swiggy API for real-time food delivery data matters because food-delivery markets change continuously. Restaurants can alter menus, prices, discounts, availability, delivery options, and promotional offers throughout the day. For restaurant groups, food brands, aggregators, market researchers, and competitive intelligence teams, relying on occasional manual checks can make it difficult to understand what customers see at a particular moment.
Swiggy's scale makes this particularly relevant. Its FY2025 reporting showed 628.9 million food-delivery orders, 14.7 million average monthly transacting users, and 238.1 thousand average monthly transacting restaurant partners.
The core business problem is therefore not simply collecting restaurant information. It is maintaining a structured and sufficiently fresh view of a fast-moving marketplace. A restaurant may introduce a new dish, change its price, apply a limited-time discount, become unavailable, or alter its delivery conditions. Each change can influence competitive positioning and customer choice.
For a pricing manager, the question may be whether competitors are discounting a popular meal. For a restaurant chain, it may be whether its menu assortment is competitive in different cities. For a food brand, it may involve identifying which cuisines, dishes, price points, or promotional formats are gaining visibility.
A reliable data workflow can turn these observations into structured intelligence. Instead of manually visiting restaurant listings, teams can collect relevant fields, normalize them, retain historical observations, and analyze changes over time.
This article explains how such data can support restaurant intelligence, pricing research, availability monitoring, menu analysis, and competitive strategy.
How Can Businesses Build Better Restaurant Intelligence?
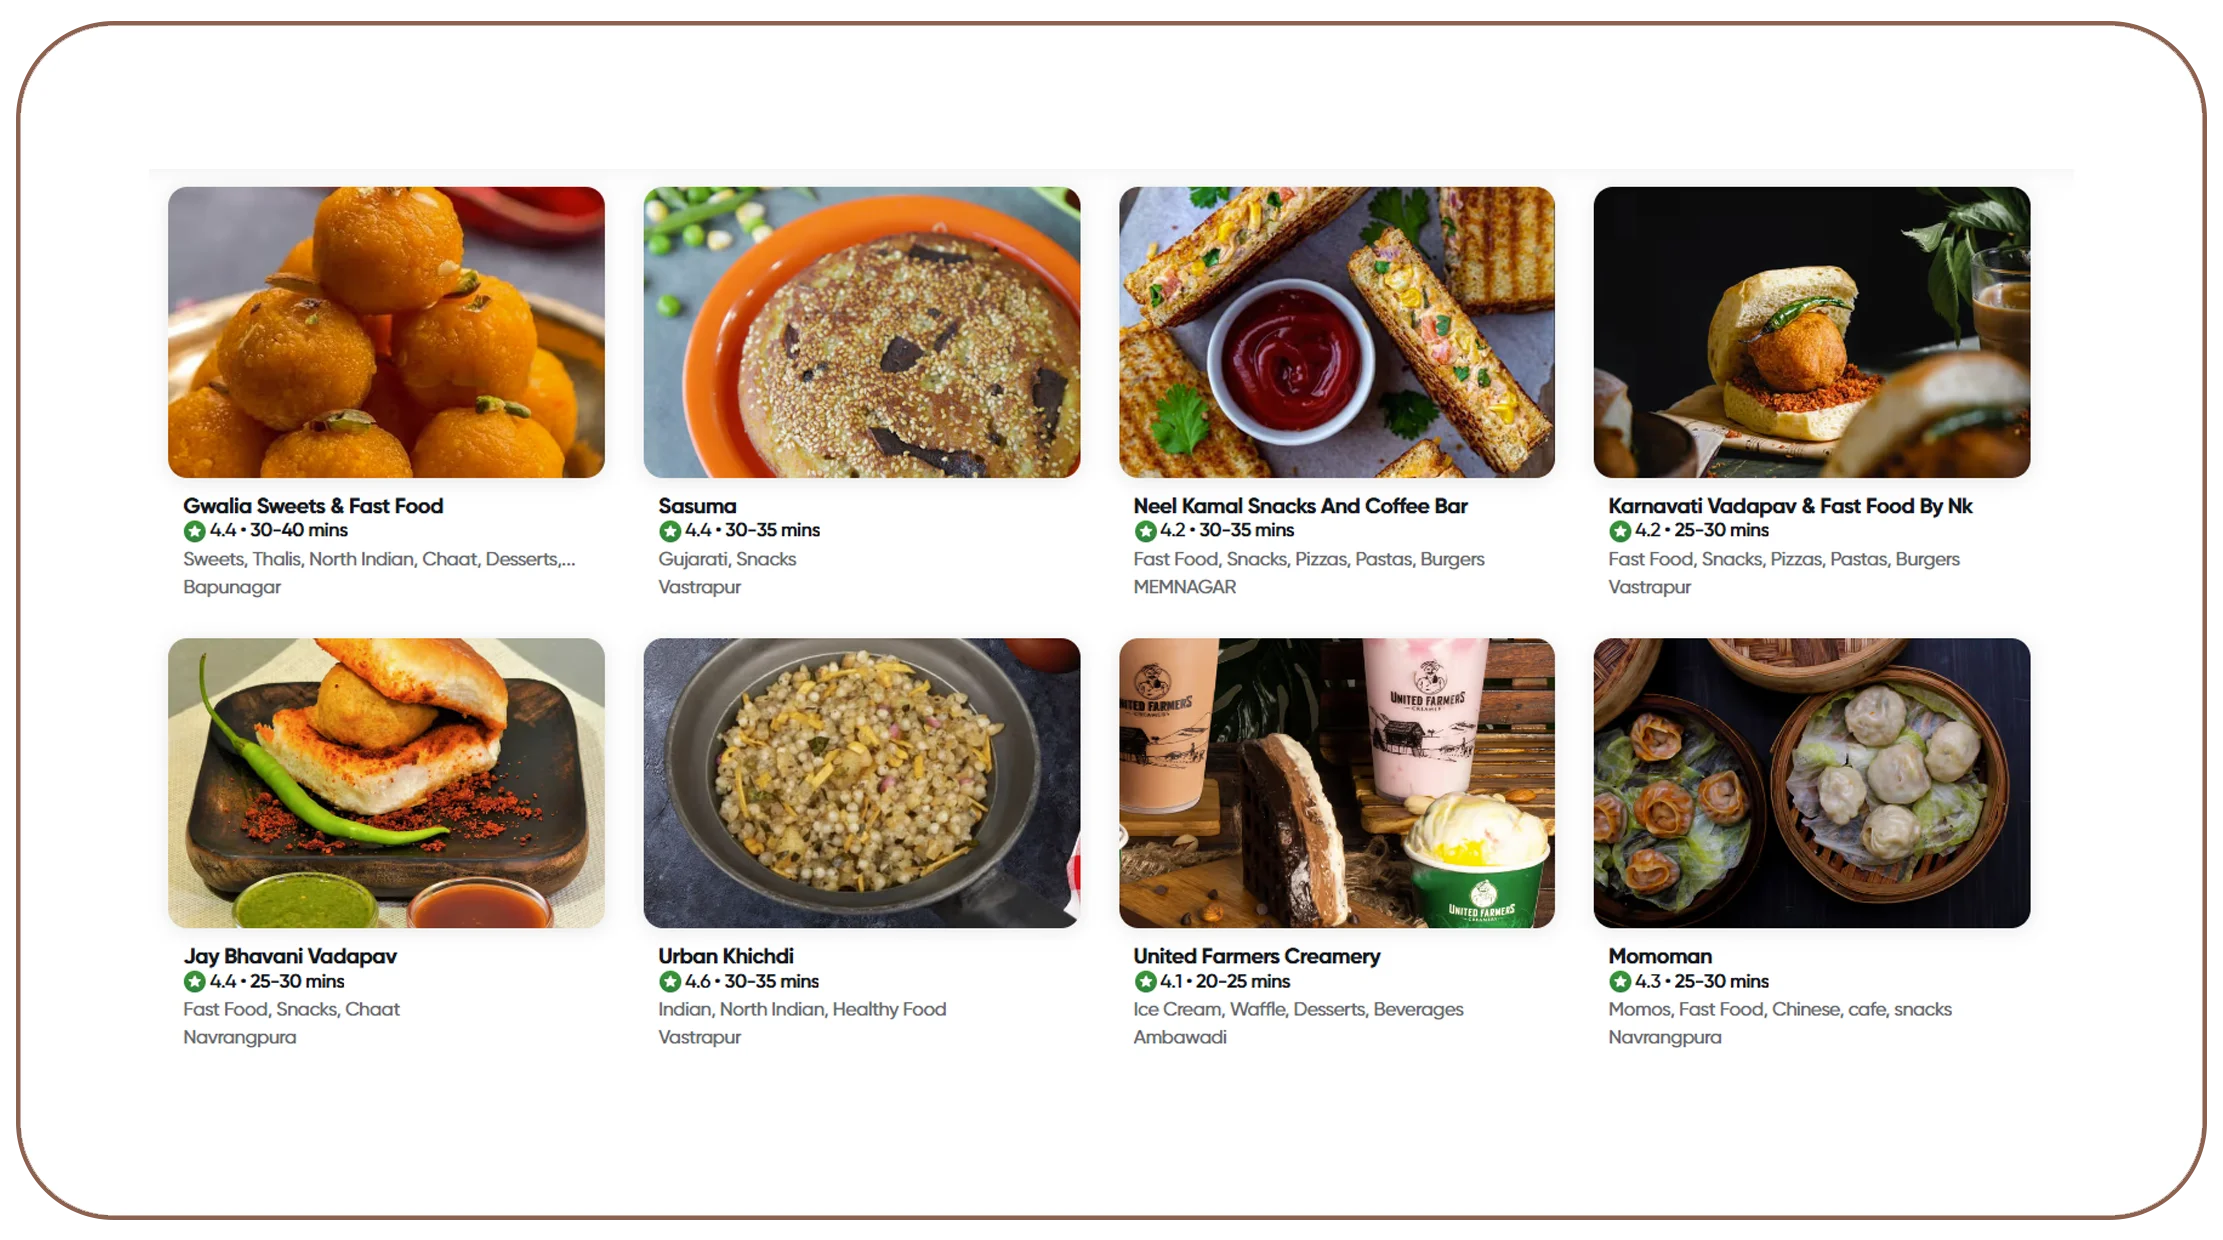
A Swiggy data extraction API for restaurants can help businesses organize restaurant-level information into structured records for analysis. Depending on the permitted data available from the source, useful attributes may include restaurant name, cuisine, location, menu items, prices, ratings, offers, delivery estimates, availability indicators, and other listing information.
The value increases when these attributes are captured consistently. A single restaurant record provides a snapshot, but repeated observations can reveal how the restaurant's digital presence changes.
For example, a restaurant intelligence team could monitor 500 restaurants across selected cities and compare:
- Number of listed menu items
- Average menu price
- Popular categories
- Discount patterns
- Rating changes
- Availability signals
- Delivery-time information
- New and removed dishes
Example restaurant intelligence structure
| Data attribute | Potential business use |
|---|---|
| Restaurant name | Entity identification |
| Location | Geographic comparison |
| Cuisine | Category analysis |
| Menu item | Assortment monitoring |
| Listed price | Pricing analysis |
| Discount | Promotion tracking |
| Rating | Reputation analysis |
| Availability | Operational monitoring |
| Delivery estimate | Service comparison |
Swiggy's reported restaurant-partner base illustrates the potential scale of this type of analysis. Average monthly transacting restaurant partners increased from 129,000 in FY2022 to 238,100 in FY2025. During the same period, total food-delivery orders increased from 454.1 million to 628.9 million.
What changed from 2020 to 2026?
From 2020 onward, online food ordering became increasingly important to restaurants and consumers. Between FY2022 and FY2025, Swiggy's reported food-delivery orders rose from 454.1 million to 628.9 million, while average monthly transacting restaurant partners increased from 129,000 to 238,100. By FY2026, Swiggy reported 18.3 million food-delivery monthly transacting users in Q4 and food-delivery GOV of ₹9,005 crore for the quarter. This progression shows why restaurant intelligence increasingly needs structured and frequently refreshed data rather than occasional market snapshots.
For businesses, the actionable lesson is to monitor the restaurant attributes that directly influence their decisions rather than attempting to collect every possible field.
How Can Pricing Teams Measure Food-Market Changes?
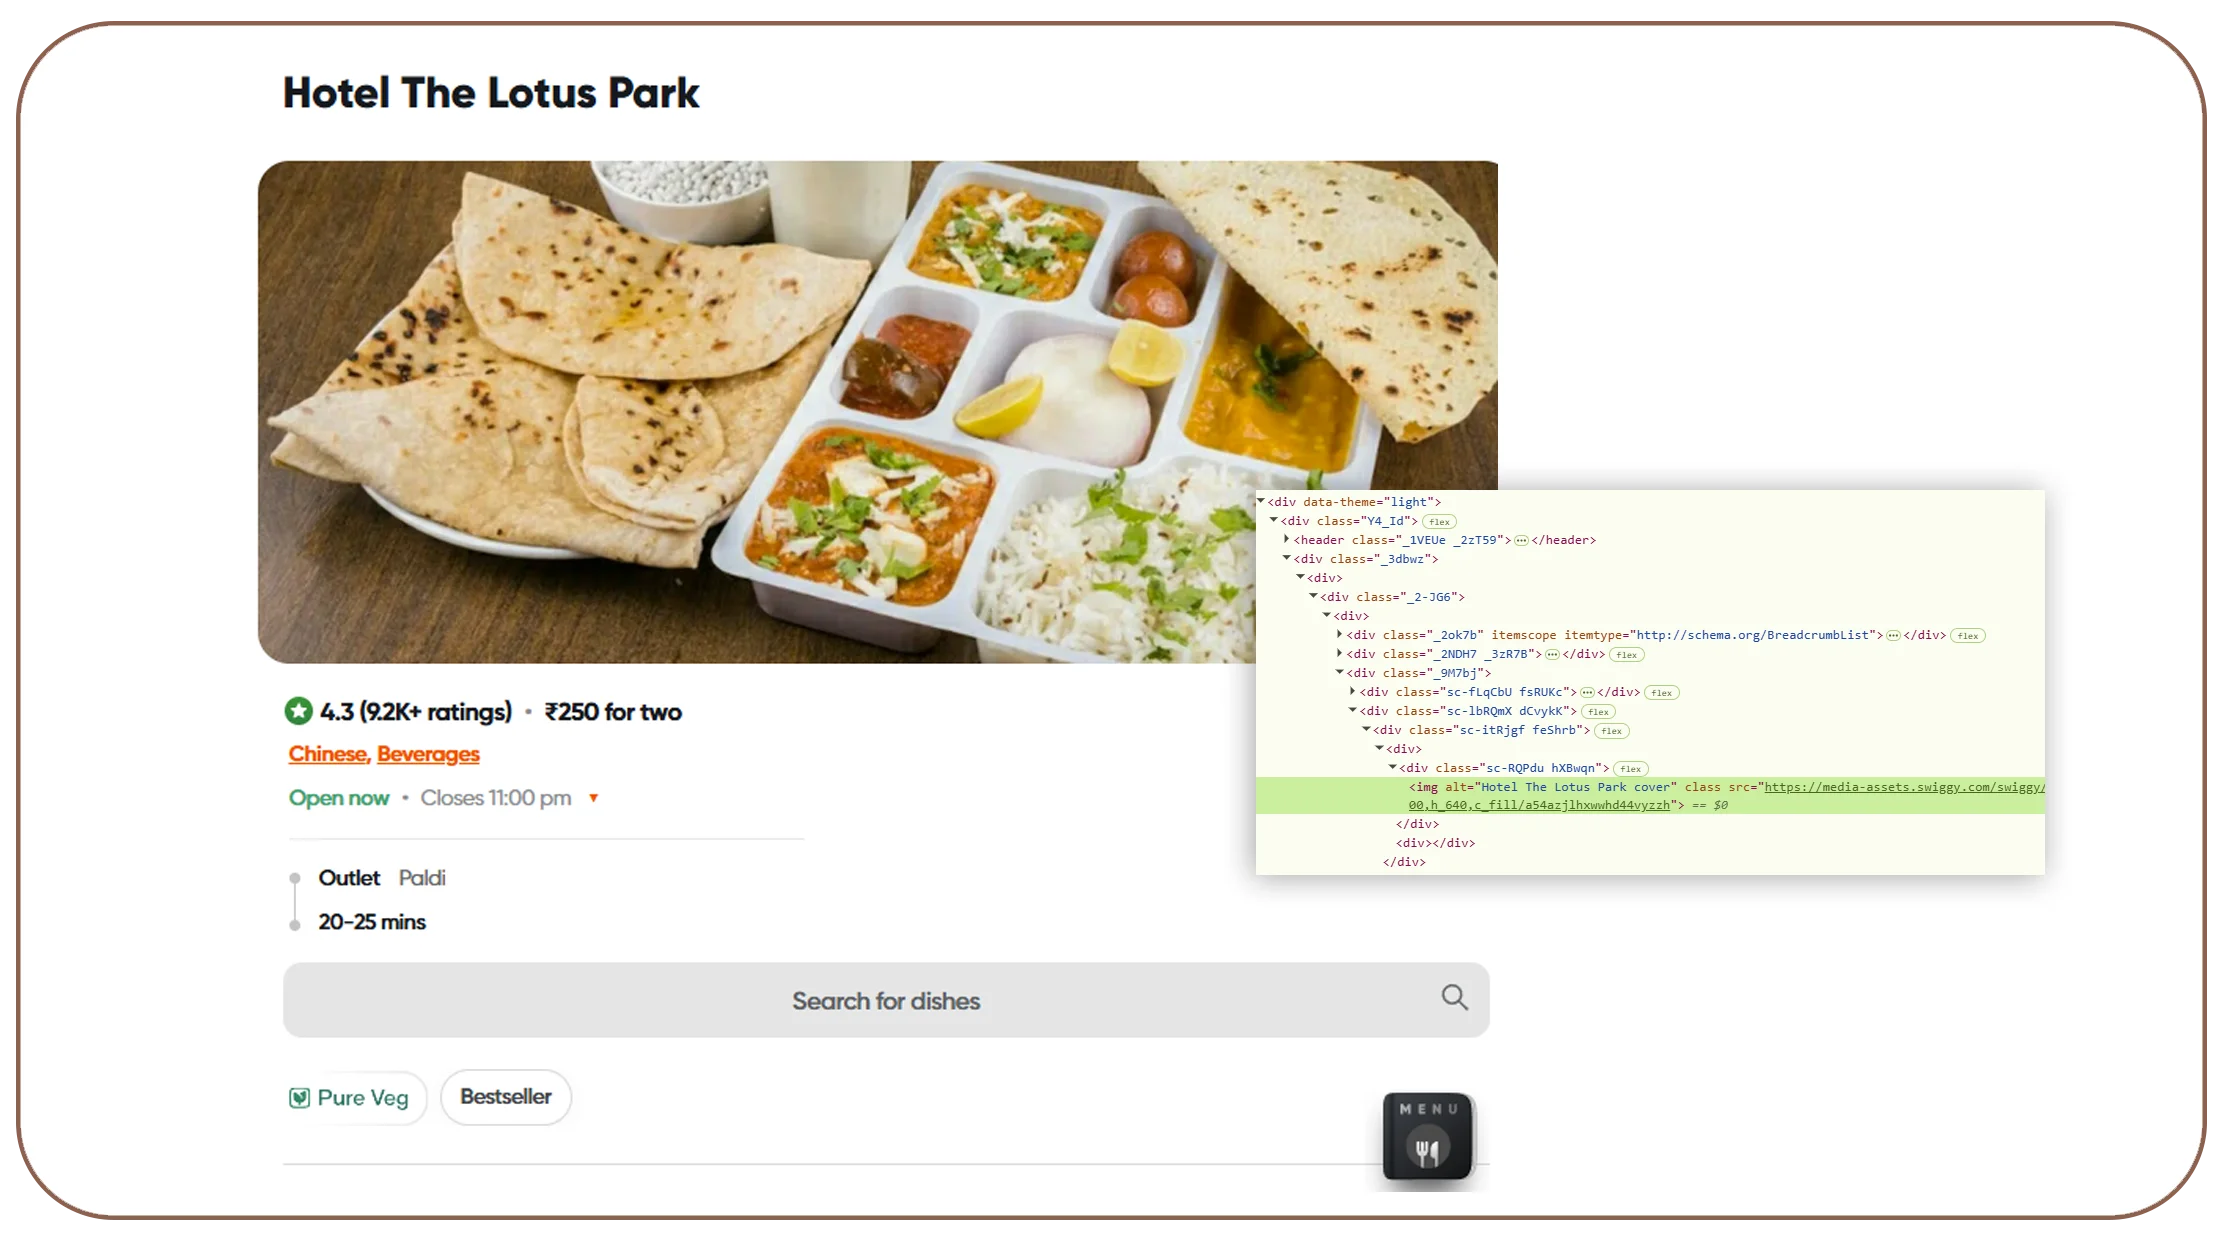
A Swiggy Food Data Scraping can support structured analysis of listed food prices, discounts, restaurant positioning, and changes across comparable dishes or categories.
Food pricing is more complicated than comparing two numbers. The same dish can appear at different prices because of portion size, restaurant positioning, location, promotions, packaging charges, or temporary discounts. Therefore, pricing intelligence should preserve enough contextual information to make comparisons meaningful.
A useful dataset can include:
| Pricing field | Why it matters |
|---|---|
| Dish name | Enables product matching |
| Restaurant | Identifies pricing source |
| Listed price | Establishes baseline |
| Discounted price | Measures promotional position |
| Discount percentage | Compares offer intensity |
| Restaurant location | Supports geographic comparison |
| Timestamp | Preserves market context |
| Category | Enables category-level analysis |
Real-life Swiggy pricing and demand signals
Swiggy's own 2024 data provides a useful illustration of how food-market behavior can be quantified. The company reported 83 million biryani orders during 2024 and 215 million dinner orders, with dinner orders nearly 29% higher than lunch orders.
Its 2025 year-end data showed 93 million biryani orders, 44.2 million burger orders, and 40.1 million pizza orders. Swiggy also reported that dinner orders were nearly 32% higher than lunch orders in 2025.
These figures demonstrate why food businesses need more than simple restaurant lists. Category-level demand signals can provide context for pricing, assortment, promotional planning, and competitive research.
What changed from 2020 to 2026?
The period from 2020 to 2026 reflects a shift from basic online ordering toward increasingly data-driven food commerce. As digital ordering expanded, pricing teams gained more observable information about menu prices and promotions. Swiggy's FY2022–FY2025 figures show food-delivery GOV increasing from ₹18,479 crore to ₹28,783 crore, while average order value increased from ₹407 to ₹458. By FY2026, Swiggy reported food-delivery GOV growth of 22.6% year over year in Q4, reaching ₹9,005 crore.
The practical takeaway is that pricing teams should maintain historical observations instead of evaluating prices as isolated snapshots.
How Does Historical Food Delivery Data Improve Market Research?
A Swiggy food delivery dataset can provide a structured foundation for analyzing restaurant assortment, food categories, pricing, offers, ratings, and availability over time.
The biggest advantage of historical data is context. Suppose a restaurant lists a pizza at ₹399 today. That number alone does not reveal whether the restaurant recently increased its price, whether a discount ended, or whether competitors moved in the same direction.
Historical records make these questions answerable.
Potential market research questions
| Question | Useful data |
|---|---|
| Which cuisines are expanding? | Cuisine and restaurant records |
| Which dishes are becoming popular? | Menu and category data |
| Where are prices rising? | Historical price records |
| Which restaurants discount frequently? | Offer observations |
| Which cities show stronger activity? | Geographic records |
| Which menu categories are crowded? | Assortment data |
Swiggy's published consumer data gives a real-world example of how food-ordering information can reveal category trends. In 2025, the company reported 16 million Mexican cuisine orders, more than 12 million Tibetan cuisine orders, and 4.7 million Korean cuisine orders. It also reported ninefold growth in Pahari cuisine orders over the previous year.
These observations can be valuable for food brands and restaurant groups evaluating menu expansion, localization, and category opportunities.
Build a structured food-market monitoring workflow to identify changing prices, categories, restaurant activity, and customer-facing trends faster!
Get Insights Now!What changed from 2020 to 2026?
From 2020 onward, food-delivery data became increasingly useful for understanding consumer behavior beyond individual transactions. By 2024, Swiggy's published data could reveal detailed patterns such as dish-level ordering volumes and meal-time preferences. In 2025, the platform reported growth in global cuisines, regional cuisine, high-protein food, and snack categories. In 2026, Swiggy reported that its food-delivery business reached 18.3 million monthly transacting users in Q4 FY2026. The progression illustrates how increasingly granular digital food data can support market research.
How Can Menu Monitoring Reveal Competitive Opportunities?
A Swiggy menu data extraction API can help businesses organize restaurant menus into comparable records. Menu information can reveal much more than what dishes a restaurant sells.
Businesses can analyze the number of items, cuisine mix, price ranges, meal categories, add-ons, combos, vegetarian and non-vegetarian options, desserts, beverages, and other visible attributes.
For restaurant groups, menu monitoring can answer questions such as:
- Which competitors have introduced new dishes?
- What price points dominate a category?
- Which cuisines are expanding in a city?
- Which menu categories are heavily represented?
- How frequently do competitors change their menus?
- Which promotional formats are being used?
Menu intelligence example
| Menu signal | Strategic interpretation |
|---|---|
| New dish | Potential category opportunity |
| Removed dish | Possible assortment rationalization |
| Price increase | Potential margin or cost response |
| New combo | Promotional strategy |
| New cuisine | Market expansion |
| More premium items | Positioning shift |
| More low-price items | Affordability strategy |
Swiggy's Bolt expansion provides a useful real-world example of how menu breadth can become strategically important. In May 2025, Swiggy stated that Bolt was operating in more than 500 cities, working with over 45,000 restaurant brands, and covering more than 4.7 million dishes across 26 cuisines.
What changed from 2020 to 2026?
During the early 2020s, digital menus became a primary customer touchpoint for restaurants. As online restaurant coverage expanded, menu information became useful for competitive benchmarking and assortment research. Swiggy's 2025 Bolt figures demonstrate the scale at which restaurant and menu information can be presented digitally: more than 45,000 restaurant brands and over 4.7 million dishes were cited for the service. By 2026, Swiggy reported collaboration with more than 2.7 lakh restaurants across 720+ cities.
For restaurant operators, the opportunity is to turn menu observations into structured competitive signals rather than manually browsing listings.
What Should Businesses Look for in an API-Based Data Workflow?
A Swiggy API can be considered as part of a broader data architecture when organizations need repeatable, structured information for analytics and monitoring.
However, an effective workflow requires more than an extraction endpoint. Businesses should evaluate data freshness, field coverage, validation, scalability, historical storage, error handling, and integration.
Core components of a reliable workflow
| Component | Business purpose |
|---|---|
| Source monitoring | Tracks selected online information |
| Extraction | Collects required fields |
| Validation | Checks data quality |
| Normalization | Standardizes formats |
| Entity matching | Connects comparable restaurants/items |
| Historical storage | Enables trend analysis |
| Alerts | Highlights important changes |
| Analytics | Converts records into insights |
The importance of scale can be seen in Swiggy's own reported operating footprint. Its FY2025 annual report recorded 17.7 million average monthly transacting users, 238,000 average monthly transacting restaurant partners, 515,000 average monthly transacting delivery partners, and 718 cities covered.
What changed from 2020 to 2026?
Between 2020 and 2026, food-delivery technology moved from simple digital ordering toward broader data-rich consumer platforms. Swiggy's reported food-delivery orders increased from 454.1 million in FY2022 to 628.9 million in FY2025. In FY2026, Swiggy reported 25.2 million platform monthly transacting users across its businesses and described food delivery as reaching a 15-quarter high in GOV growth. This scale increases the value of automated workflows capable of organizing restaurant, menu, pricing, and availability observations.
The right architecture should ultimately be designed around the business question. A pricing team needs different fields and refresh intervals from a market-research team studying cuisine expansion.
How Can Historical Food Intelligence Support Better Decisions?
A Swiggy Food Dataset can help businesses build historical views of restaurant listings, menus, prices, offers, availability, and other observable food-market attributes.
The strategic advantage comes from comparison. Businesses can compare cities, restaurants, cuisines, menu categories, price bands, promotional intensity, and availability patterns.
For example, a restaurant chain entering a new city could examine competitor menu structures and price ranges before deciding how to position its own offerings. A food manufacturer could monitor how restaurants use particular ingredients or food categories. A market research firm could analyze restaurant density and cuisine diversity across locations.
Example decision framework
| Business objective | Data signal | Potential decision |
|---|---|---|
| Enter a new market | Restaurant density | Select target location |
| Improve pricing | Competitor price history | Adjust price position |
| Expand menu | Category coverage | Identify gaps |
| Track promotions | Offer history | Optimize campaigns |
| Monitor availability | Stock/listing signals | Investigate operational issues |
| Study demand | Category/order trends | Prioritize products |
Swiggy's 2025 consumer data demonstrates the richness of food-market signals. The company reported 93 million biryani orders, 44.2 million burger orders, 40.1 million pizza orders, and 26.2 million veg dosa orders during the year.
What changed from 2020 to 2026?
From 2020 to 2022, businesses primarily needed visibility into rapidly changing online food operations. Between 2023 and 2024, richer digital signals made category, menu, and pricing comparisons more practical. In 2025, Swiggy published detailed consumer trends covering dishes, cuisines, meal periods, and ordering behavior. By 2026, Swiggy reported a food-delivery business with 18.3 million monthly transacting users in Q4 and ₹9,005 crore in quarterly food-delivery GOV. These figures demonstrate why historical and structured food-market data can support increasingly sophisticated business analysis.
The most useful dataset is therefore not necessarily the largest one. It is the dataset that preserves the right attributes, timestamps, relationships, and historical context needed to answer a specific business question.
Why Choose Real Data API?
Real Data API can help businesses build structured data workflows around food, restaurant, pricing, and marketplace intelligence. The focus should be on converting changing online information into datasets that can be analyzed, compared, and integrated into existing business processes.
A Food Scraping API can support use cases such as restaurant monitoring, menu intelligence, food-price research, competitor benchmarking, and market analysis.
A practical data solution should address five core requirements:
- Relevant coverage – Capture the fields that directly support the business objective.
- Consistent structure – Normalize information so records can be compared across sources.
- Data quality – Validate records and identify missing or unexpected information.
- Historical continuity – Preserve observations to identify trends and changes.
- Business integration – Deliver structured information into databases, dashboards, analytics tools, or internal applications.
For a food-delivery intelligence project, teams should define the target geography, restaurant universe, menu attributes, price fields, availability indicators, refresh frequency, and historical retention requirements before building the workflow.
This prevents a common data-project problem: collecting a large amount of information without a clear commercial use case.
The second consideration is freshness. If the goal is competitor price monitoring, weekly information may be insufficient. If the goal is long-term cuisine research, daily observations may be unnecessary. Refresh frequency should therefore reflect the speed of the business change being measured.
The third consideration is historical context. Current data can answer what is visible now, while historical data can reveal how the market arrived there.
Real Data API can therefore be evaluated not simply as a collection mechanism but as part of a broader data-intelligence workflow.
Conclusion
Swiggy API for real-time food delivery data can help businesses address a fundamental challenge in digital food commerce: keeping pace with continuously changing menus, prices, offers, availability, and competitive activity.
The strongest approach is to collect only the information required for a defined business objective, structure it consistently, validate it, retain historical observations, and connect it with analytics. This enables restaurant groups, food brands, market researchers, pricing teams, and competitive intelligence professionals to move from occasional manual checks toward repeatable data-driven decision-making.
Swiggy's own published figures illustrate the scale of the opportunity. FY2025 recorded 628.9 million food-delivery orders, while Q4 FY2026 reached ₹9,005 crore in food-delivery GOV and 18.3 million monthly transacting users.
As online food commerce continues to expand, structured market intelligence can help businesses identify pricing movements, menu opportunities, category shifts, restaurant competition, and availability changes faster.
Ready to transform changing food-delivery information into actionable restaurant and market intelligence? Connect with Real Data API to discuss a scalable data workflow built around your specific business requirements!
FAQs
1. What can businesses track with Swiggy API for real-time food delivery data?
Businesses can monitor restaurant listings, menus, prices, offers, availability, ratings, delivery information, and other accessible attributes to support competitive and market intelligence.
2. Why is Swiggy Food Data Scraping valuable for restaurants?
It can help restaurant teams compare menus, pricing, offers, and competitive positioning while identifying changes across relevant restaurant categories and locations.
3. How does Swiggy data extraction API for restaurants support market research?
It can organize restaurant-level information into structured records, enabling researchers to compare locations, cuisines, menu breadth, pricing, availability, and other market signals.
4. What insights can Swiggy food pricing data API provide?
Pricing information can support comparisons of listed prices, discounts, price ranges, promotional activity, and historical movements across selected restaurants, dishes, categories, and locations.
5. How can Real Data API help with a Swiggy food delivery dataset?
Real Data API can help businesses structure relevant restaurant and food-market information for monitoring, historical analysis, competitive research, pricing intelligence, and downstream analytics workflows.
Latest posts
How ecommerce scraping API for real-time product data Helps Businesses Track Prices, Inventory, and Competitor Changes
How Web Scraping APIs for Business Data Improve Pricing and Product Insights
How Extracting Bilibili API Data for Social Media Analytics Helps Brands Track Content, Engagement, and Audience Trends

How Prom.ua scraper Helps Businesses Collect Marketplace Data for Competitive Pricing and Product Intelligence






.png)



