TL;DR
- Fandango API data extraction for movie market intelligence helps businesses organize ticket, theater, showtime, movie, and pricing signals to understand demand and competitive movements.
- Fandango Web Scraping Services can support structured monitoring of movie availability, ticket prices, formats, theaters, and location-level changes for more informed entertainment-market decisions.
Introduction
The theatrical movie business has become increasingly data-driven as audiences move between cinemas, streaming platforms, premium formats, and alternative entertainment options. For studios, exhibitors, distributors, market researchers, and entertainment analysts, understanding what audiences are watching is no longer enough. Businesses also need to understand where movies are available, how ticket prices change, which formats attract audiences, and how competing releases influence demand.
Fandango API data extraction for movie market intelligence can help transform publicly available movie and ticket information into structured datasets for analysis. Depending on the available data source and permitted access methods, organizations can organize information around titles, theaters, showtimes, ticket prices, formats, locations, ratings, and availability.
Fandango Web Scraping Services can further help businesses collect and standardize movie-market signals at scale. This can make it easier to compare locations, identify pricing patterns, monitor release activity, and build historical datasets for forecasting.
The need for such intelligence is growing as the global theatrical market continues its recovery. Gower Street estimated global box office at approximately $33.55 billion in 2025 and projects 2026 global box office at around $34.7 billion after revising its earlier forecast.
Turning Movie Listings Into Actionable Demand Signals
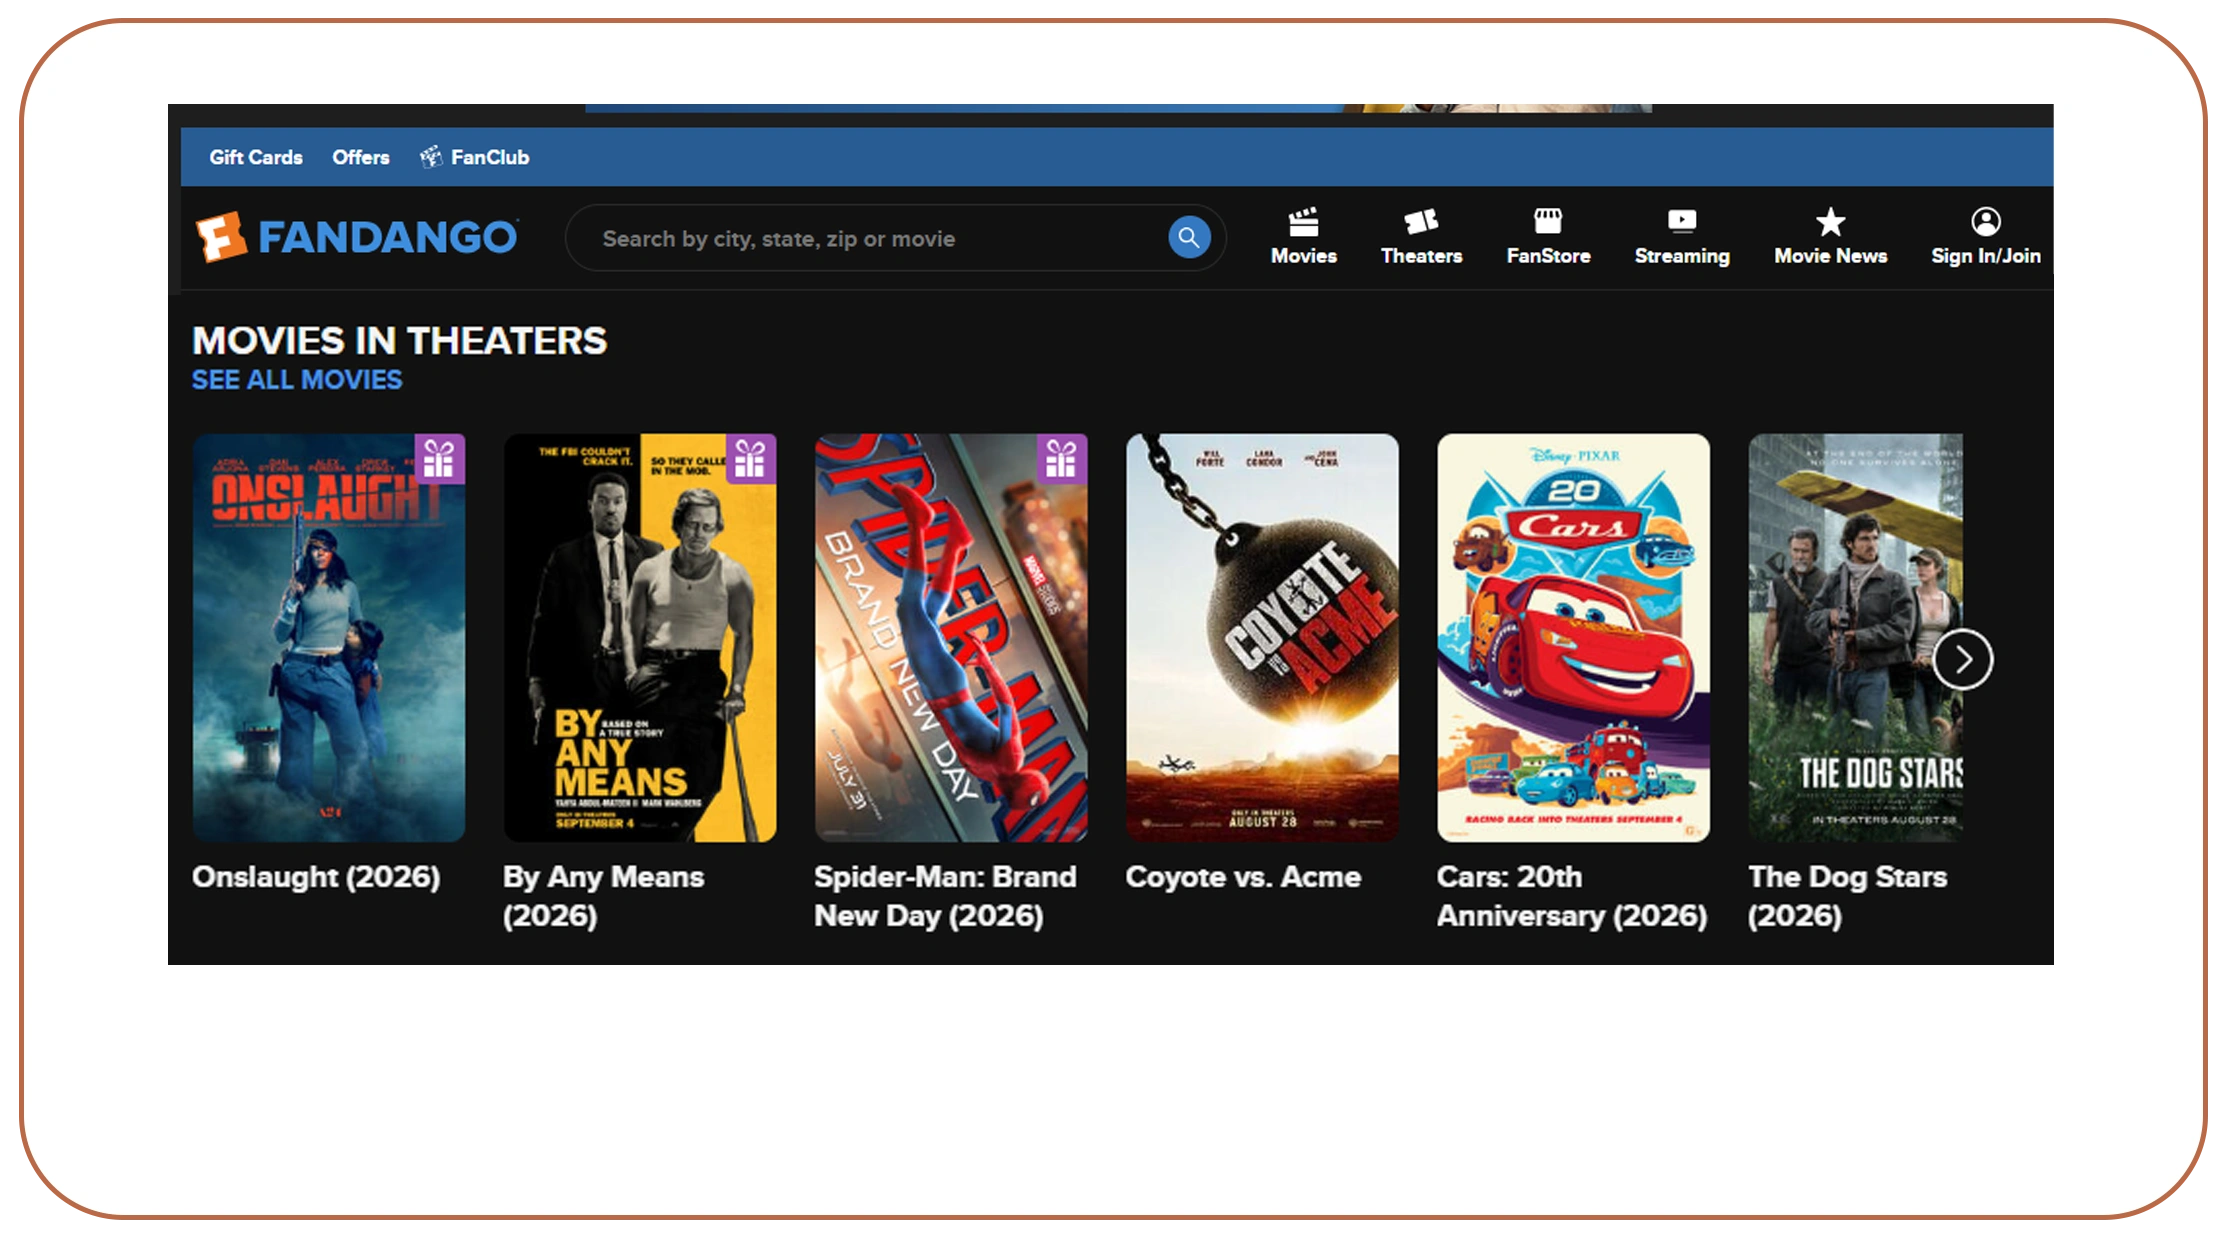
The first challenge for movie-market analysts is converting fragmented theater and ticket information into a consistent dataset. Fandango web scraping for movie data can help organize movie titles, genres, release dates, theaters, showtimes, formats, locations, and ticket information into structured records.
This becomes particularly useful when analysts want to compare demand across locations or periods. A movie showing repeatedly across multiple theaters and time slots can indicate stronger market presence, while limited availability may suggest a smaller distribution footprint or weaker demand.
The pandemic made this type of analysis more important. Global box office activity collapsed in 2020, began recovering in 2021, and accelerated significantly in 2022. Gower Street estimated 2022 global box office at $25.9 billion, while 2024 reached approximately $30 billion and 2025 ended at about $33.55 billion.
| Year | Global box-office indicator | Market intelligence implication |
|---|---|---|
| 2020 | Pandemic disruption | Establishes recovery baseline |
| 2021 | Recovery year | Reveals changing attendance patterns |
| 2022 | ~$25.9B | Strong theatrical recovery |
| 2023 | ~$33.9B | Major blockbuster-driven growth |
| 2024 | ~$30B | Uneven recovery across markets |
| 2025 | ~$33.55B | Second-highest post-2019 year |
| 2026 | ~$34.7B estimate | Continued recovery and competition |
For analysts, the value is not simply collecting movie records. Historical data can reveal changes in release timing, theater coverage, premium-format adoption, pricing, and audience preferences.
A structured movie dataset can therefore become a foundation for demand forecasting, competitive benchmarking, content planning, and location-level market research.
Benchmarking Theater and Release Competition
Movie competition is highly dependent on timing, geography, audience overlap, and available screens. Fandango data scraping for cinema competitive analysis can help businesses compare competing titles based on showtimes, theater presence, formats, ticket prices, and availability.
For example, a distributor preparing for a major release could monitor competing movies across selected metropolitan markets. If several high-profile films are scheduled in the same period, analysts can compare their theater coverage and available screening slots to understand potential competitive pressure.
The post-pandemic recovery demonstrates why this matters. Global box office reached approximately $25.9 billion in 2022, rose to around $33.9 billion in 2023, fell to approximately $30 billion in 2024, and recovered to roughly $33.55 billion in 2025.
| Year | Market trend | Competitive-analysis opportunity |
|---|---|---|
| 2020 | Severe disruption | Establish historical baseline |
| 2021 | Gradual reopening | Track reopening patterns |
| 2022 | Recovery accelerates | Compare returning franchises |
| 2023 | Strong theatrical year | Analyze blockbuster competition |
| 2024 | Mixed performance | Identify resilient genres |
| 2025 | Recovery strengthens | Benchmark major releases |
| 2026 | Growth expected | Monitor crowded release calendar |
Fandango's own research also highlights how audiences increasingly value premium theatrical experiences. Its 2025 study found that 77% of surveyed moviegoers expressed interest in premium formats such as IMAX and Dolby Cinema.
This makes format-level competitive analysis especially valuable. Two movies may compete for the same audience but have very different premium-screen exposure. Tracking those differences can help businesses understand why one title may achieve stronger theater visibility.
Historical competitive datasets can also support release-date planning, regional benchmarking, pricing studies, and theater-level opportunity analysis.
Building a Reliable Entertainment Data Pipeline
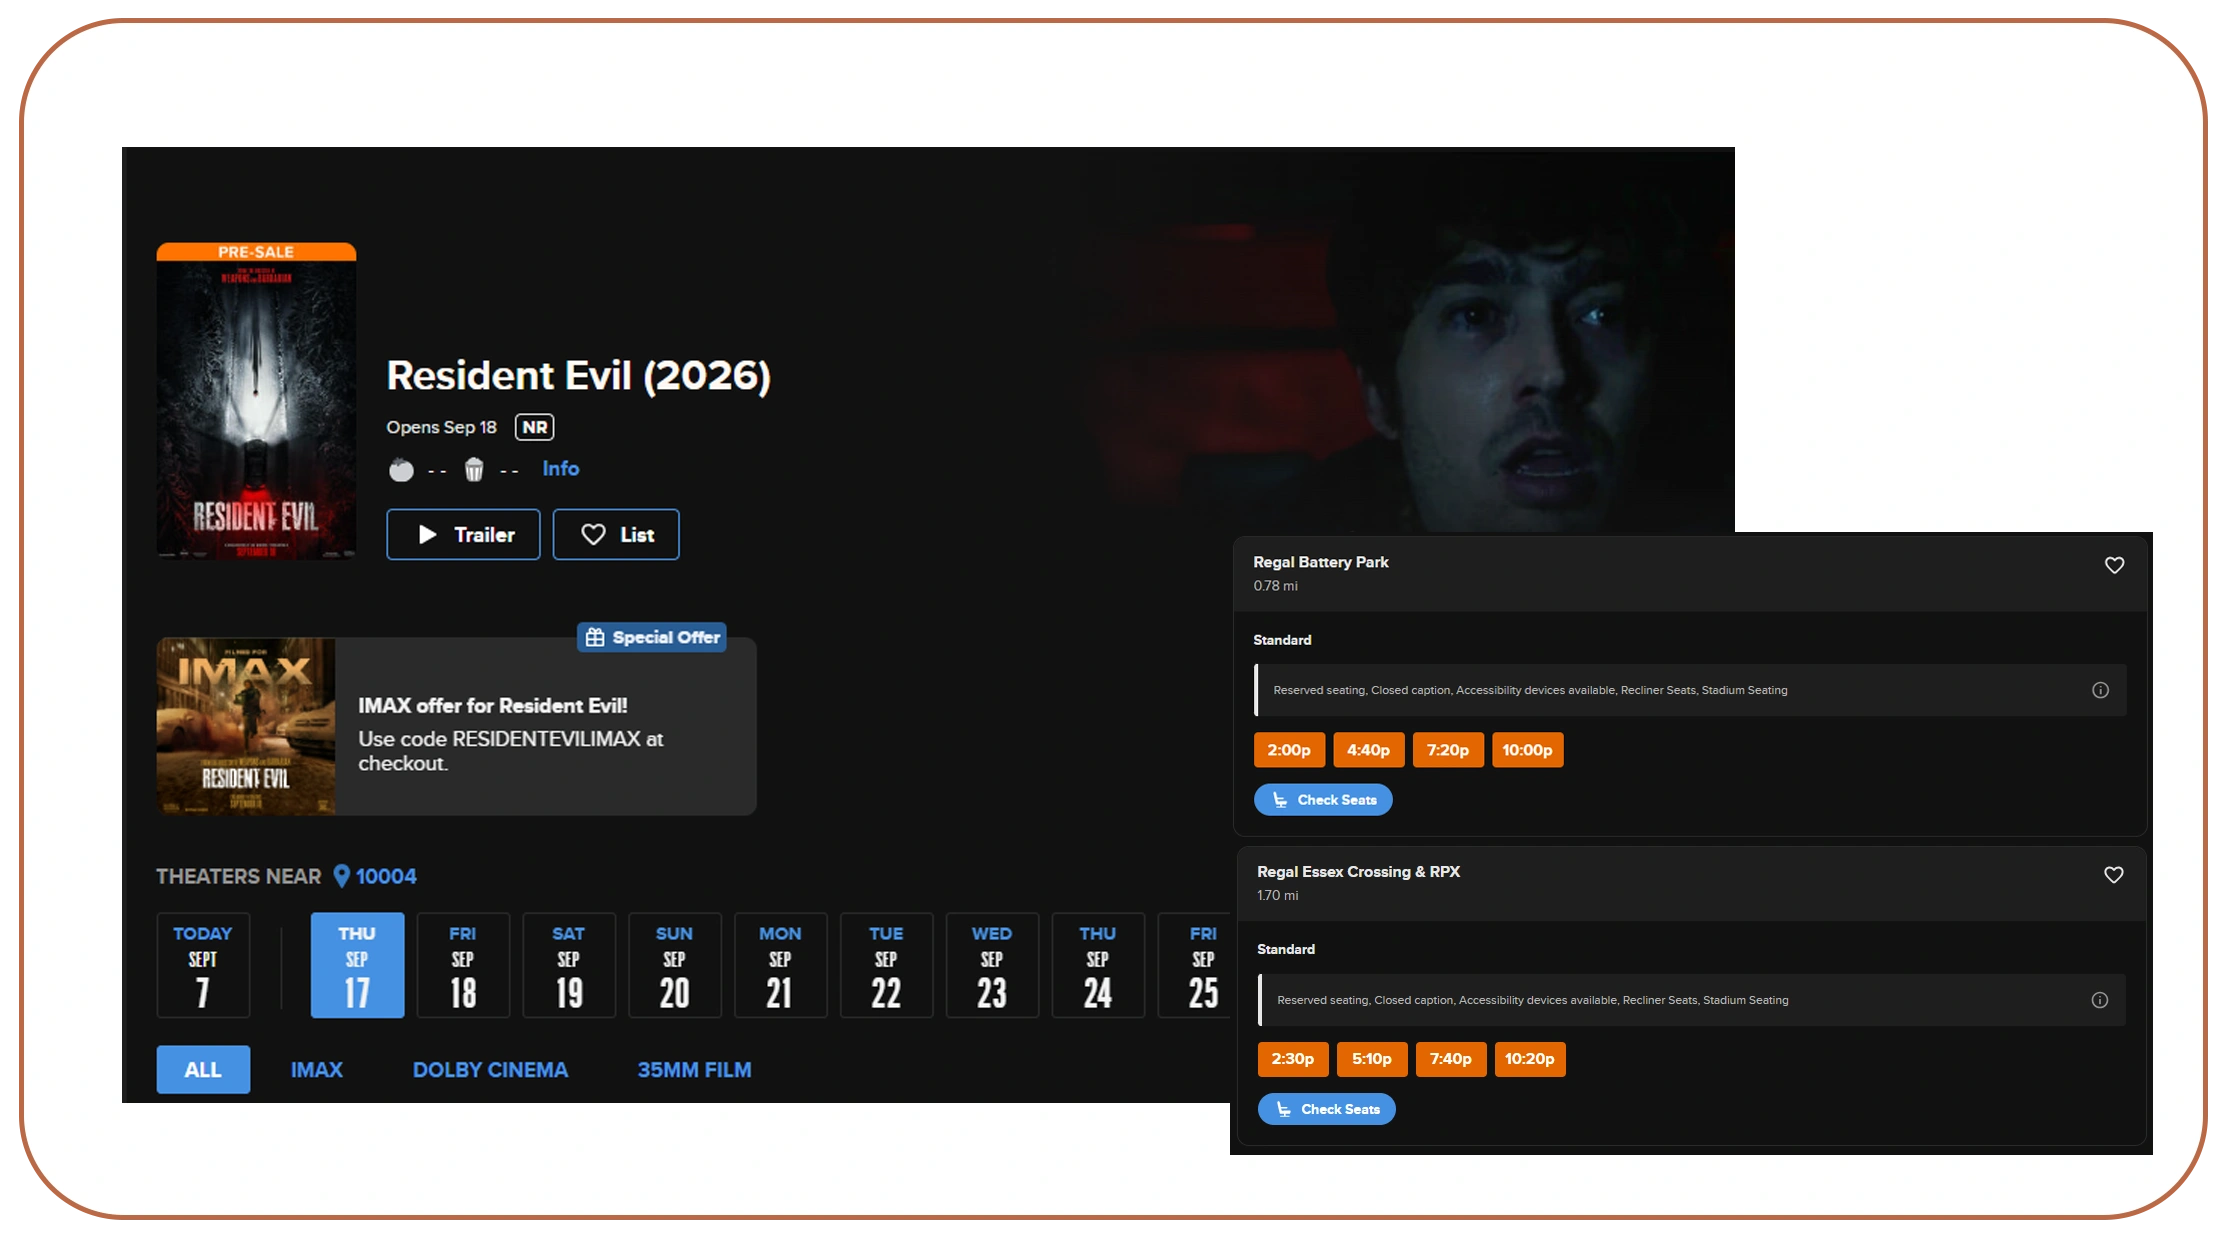
Large-scale movie analysis requires more than collecting isolated records. entertainment data collection services using Fandango can help organizations establish repeatable workflows for gathering, cleaning, transforming, and storing movie-market information.
A useful pipeline can combine movie metadata with theater locations, showtimes, ticket prices, screening formats, availability, and historical observations. Once standardized, these records can be analyzed by movie, city, theater, date, format, or time period.
The industry's recovery provides a strong reason to maintain longitudinal datasets. Global box office increased from the severe pandemic conditions of 2020 through the recovery years, reaching $33.55 billion in 2025. Gower Street's revised 2026 forecast stands at $34.7 billion.
| Year | Data environment | Recommended analytical focus |
|---|---|---|
| 2020 | Disrupted market | Baseline and anomaly detection |
| 2021 | Reopening | Regional recovery |
| 2022 | Rapid recovery | Demand normalization |
| 2023 | High theatrical activity | Movie and theater benchmarking |
| 2024 | Market volatility | Pricing and genre comparisons |
| 2025 | Strong recovery | Audience and format analysis |
| 2026 | Expanding slate | Forecasting and competitive monitoring |
A data pipeline can also help businesses detect changes that are difficult to identify manually. For instance, an analyst can monitor whether a theater adds additional showtimes for a title, whether a premium format becomes available, or whether ticket prices change before a weekend.
This supports use cases ranging from studio research and distributor planning to theater benchmarking and investment analysis.
The quality of the resulting intelligence depends heavily on consistent collection, accurate timestamps, normalization, deduplication, and historical storage. Rather than treating movie information as a static dataset, businesses can treat it as a continuously changing market signal.
Want to turn movie-market signals into structured business intelligence? Explore Real Data API solutions for scalable entertainment data workflows.
Get Insights Now!Understanding Ticket Pricing and Market Positioning
Ticket pricing is one of the most important variables in theatrical-market analysis. extract Fandango ticket pricing data for market analysis enables analysts to examine price differences across movies, theaters, locations, dates, formats, and screening times.
Pricing data can reveal more than the cost of admission. When combined with showtimes and movie information, it can help identify premium-format price premiums, weekend pricing behavior, geographic differences, and competitive positioning.
The industry's recovery has also made pricing analysis more important. Gower Street's 2026 reporting specifically highlights admissions, ticket-price fluctuations, and exchange rates as factors influencing cinema business results.
| Year | Market context | Pricing-analysis focus |
|---|---|---|
| 2020 | Cinema disruption | Identify abnormal pricing periods |
| 2021 | Reopening | Compare reopening strategies |
| 2022 | Recovery | Track price normalization |
| 2023 | Strong demand | Measure premium pricing |
| 2024 | Uneven market | Compare regional differences |
| 2025 | Recovery continues | Analyze blockbuster pricing |
| 2026 | Growth expected | Monitor dynamic market positioning |
A pricing dataset can segment tickets by standard, IMAX, Dolby, 3D, or other available formats. It can also distinguish weekday and weekend pricing and compare early-day screenings with peak evening periods.
Fandango's 2025 research found that 77% of surveyed moviegoers were interested in premium formats, demonstrating the importance of understanding how audiences respond to enhanced cinema experiences.
For studios, pricing intelligence can support competitive research. For exhibitors, it can help benchmark pricing across nearby locations. For analysts, historical pricing records can be combined with movie performance indicators to identify relationships between ticket cost, format, availability, and audience demand.
The key is to analyze pricing as part of a broader market context rather than treating the ticket price as an isolated metric.
Connecting Theatrical Signals With Streaming Intelligence
The modern entertainment market extends beyond theaters. An OTT Dataset can complement theatrical information by providing a broader view of movie availability, platform presence, release windows, genres, and audience-facing content trends.
Combining streaming and theatrical datasets can help analysts understand how entertainment consumption is changing. A movie's theatrical performance can be compared with its subsequent availability across digital platforms, creating opportunities for window analysis and content lifecycle research.
The 2020-2026 period illustrates why this comparison matters. The pandemic accelerated digital entertainment consumption while simultaneously disrupting theatrical distribution. Theatrical markets subsequently recovered, with global box office reaching approximately $33.55 billion in 2025 and 2026 currently forecast around $34.7 billion.
| Year | Theatrical-market context | Cross-platform research opportunity |
|---|---|---|
| 2020 | Cinema disruption | Compare theater and streaming shifts |
| 2021 | Hybrid consumption | Track release-window changes |
| 2022 | Theater recovery | Compare returning audiences |
| 2023 | Strong cinema performance | Analyze franchise demand |
| 2024 | Market normalization | Study content lifecycle |
| 2025 | Strong recovery | Compare theatrical and digital interest |
| 2026 | Continued growth | Build cross-platform forecasts |
Fandango API data extraction for movie market intelligence can become particularly valuable when connected with other permitted datasets. Analysts can create a unified view of movie titles, theatrical availability, ticket pricing, showtimes, genres, and digital-platform presence.
This type of intelligence can support content acquisition, release planning, audience segmentation, investment research, and entertainment-market forecasting.
The objective is not to treat cinema and streaming as completely separate markets. Instead, businesses can examine how audiences move between entertainment channels and how content performance changes throughout its lifecycle.
Creating Cross-Channel Content Intelligence
Streaming platforms have transformed how consumers discover and watch entertainment, making structured digital-market intelligence increasingly important. OTT Data Scraping can help organizations monitor permitted public data around titles, genres, platform catalogs, release information, and availability.
When this information is connected with theatrical datasets, analysts can study content from release through later distribution stages. Such a dataset may reveal whether certain genres consistently perform well in cinemas before becoming significant streaming titles, or whether franchise properties maintain audience interest across multiple channels.
Fandango's audience research demonstrates the continued importance of theatrical engagement. Its 2025 study surveyed more than 5,000 moviegoers, while its 2026 study surveyed more than 5,000 moviegoers plus a supplemental survey of more than 6,000 moviegoers.
| Year | Entertainment trend | Intelligence opportunity |
|---|---|---|
| 2020 | Streaming acceleration | Build digital-content baselines |
| 2021 | Hybrid viewing | Compare distribution windows |
| 2022 | Cinema recovery | Measure cross-channel demand |
| 2023 | Franchise resurgence | Track content lifecycle |
| 2024 | Diverse theatrical slate | Compare platform strategies |
| 2025 | Strong moviegoing interest | Analyze audience preferences |
| 2026 | Expanding theatrical calendar | Develop predictive models |
Cross-platform intelligence can support several commercial applications. Studios can examine content portfolios, distributors can evaluate release strategies, researchers can track audience behavior, and investors can compare entertainment-market trends.
The strongest datasets combine historical consistency with granular attributes. Instead of looking only at whether a movie exists on a platform, analysts can examine when it appeared, how long it remained available, how its theatrical performance compared with later distribution, and which genres or franchises showed recurring patterns.
This turns entertainment data into a strategic asset rather than a simple catalog.
Why Choose Real Data API?
For entertainment businesses, the value of data depends on whether information can be collected consistently, structured accurately, and delivered in a format suitable for analysis. Real Data API can support organizations that need scalable data pipelines for movie, theater, ticket, pricing, showtime, and broader entertainment-market intelligence.
A structured approach makes it easier to combine historical records with current observations and transform raw information into dashboards, analytical models, and business reports.
The platform can also help businesses organize Fandango data extraction for entertainment analytics around practical use cases such as ticket-price monitoring, theater benchmarking, release tracking, market research, and audience-demand analysis.
For companies building entertainment intelligence products, structured APIs can reduce manual data-processing requirements and create a repeatable foundation for downstream analytics. Data can then be integrated into business intelligence systems, databases, dashboards, or predictive models.
The broader market opportunity is substantial. Gower Street's latest estimate puts 2026 global box office at $34.7 billion, while its 2026 analysis points to continued growth in major theatrical markets.
For businesses seeking to understand this evolving market, dependable entertainment data infrastructure can support faster analysis and more informed decisions.
Conclusion
The movie industry has moved into a more complex, data-intensive environment where ticket pricing, theater availability, showtimes, formats, release schedules, and audience preferences all influence commercial outcomes.
Fandango API data extraction for movie market intelligence provides a framework for organizing these signals into structured datasets that can support competitive analysis, pricing research, theater benchmarking, release planning, and audience-demand forecasting.
The opportunity becomes even stronger when theatrical datasets are combined with OTT, entertainment, and market-performance information. From the disruption of 2020 to the projected $34.7 billion global box office for 2026, the market has demonstrated how quickly consumer behavior and industry conditions can change.
Businesses that establish reliable data pipelines can respond to these changes with stronger evidence instead of relying solely on assumptions.
Partner with Real Data API to turn structured entertainment data into actionable insights, competitive intelligence, and scalable analytics!
FAQs
How can Fandango API data extraction for movie market intelligence help businesses?
It can organize movie, theater, showtime, pricing, and availability signals, helping businesses identify demand patterns, compare markets, monitor competitors, and improve entertainment-market decisions.
What can Fandango Web Scraping Services monitor?
Fandango Web Scraping Services can help monitor permitted public movie information such as theaters, showtimes, ticket prices, formats, availability, titles, and location-level market changes.
Why combine an OTT Dataset with cinema information?
An OTT Dataset can complement theatrical information by helping analysts compare content availability, distribution windows, genres, and audience trends across cinema and streaming ecosystems.
How does OTT Data Scraping support entertainment research?
OTT Data Scraping can create structured datasets for analyzing platform catalogs, release patterns, genres, availability, and content trends alongside theatrical-market information.
Can Real Data API support entertainment analytics?
Yes. Real Data API can support structured entertainment-data workflows, while Fandango data extraction for entertainment analytics can help businesses analyze ticket, theater, pricing, and movie-market signals.
#Fandango #MovieData #MovieMarketIntelligence #TicketPricing #EntertainmentAnalytics #DataExtraction #MovieAnalytics #WebData #MarketResearchLatest posts
How A Flipkart Scraper For Product Data Extraction Tracks Product Reviews, Ratings, Prices, And Availability
How Amazon API for real-time ecommerce data Solves Pricing, Availability, and Competitor Monitoring Challenges?
How to Track Prices, Products, and Competitors with Meesho Data Scraping for Ecommerce Market Intelligence?
Indiamart Data Extraction For B2B Market Intelligence - Track Products, Competitors, And B2B Pricing Trends






.png)



