.gif)
.png)

TL;DR
- Vivino data extraction for wine market intelligence helps wine retailers, distributors, brands, and marketplaces convert product, rating, availability, and pricing signals into actionable demand and pricing insights.
- A structured API-led workflow can monitor wine SKUs, vintages, ratings, prices, discounts, regions, and competitor movements to identify opportunities before market conditions change.
Introduction
Wine businesses can use structured marketplace data to identify which products attract attention, how prices move, and where competitive gaps exist. Extract Vivino wine data for pricing intelligence to combine product attributes, ratings, reviews, vintages, prices, availability, and promotional signals into a repeatable market-intelligence dataset.
Vivino is particularly valuable as a source of consumer-facing wine information. Vivino data scraping API currently reports more than 77.4 million users, 3.48 billion scanned labels, and more than 20.4 million wines. Its app page also reports 352 million-plus ratings and 118 million-plus reviews.
For a retailer, the important question is not simply, "What wines are listed?" It is, "Which wines are gaining demand, what price points are consumers accepting, how does perceived quality relate to price, and where are competitors positioned?"
The answer requires historical, normalized, and regularly refreshed data rather than one-time product lists.
How Can Historical Product Signals Reveal Pricing Opportunities?
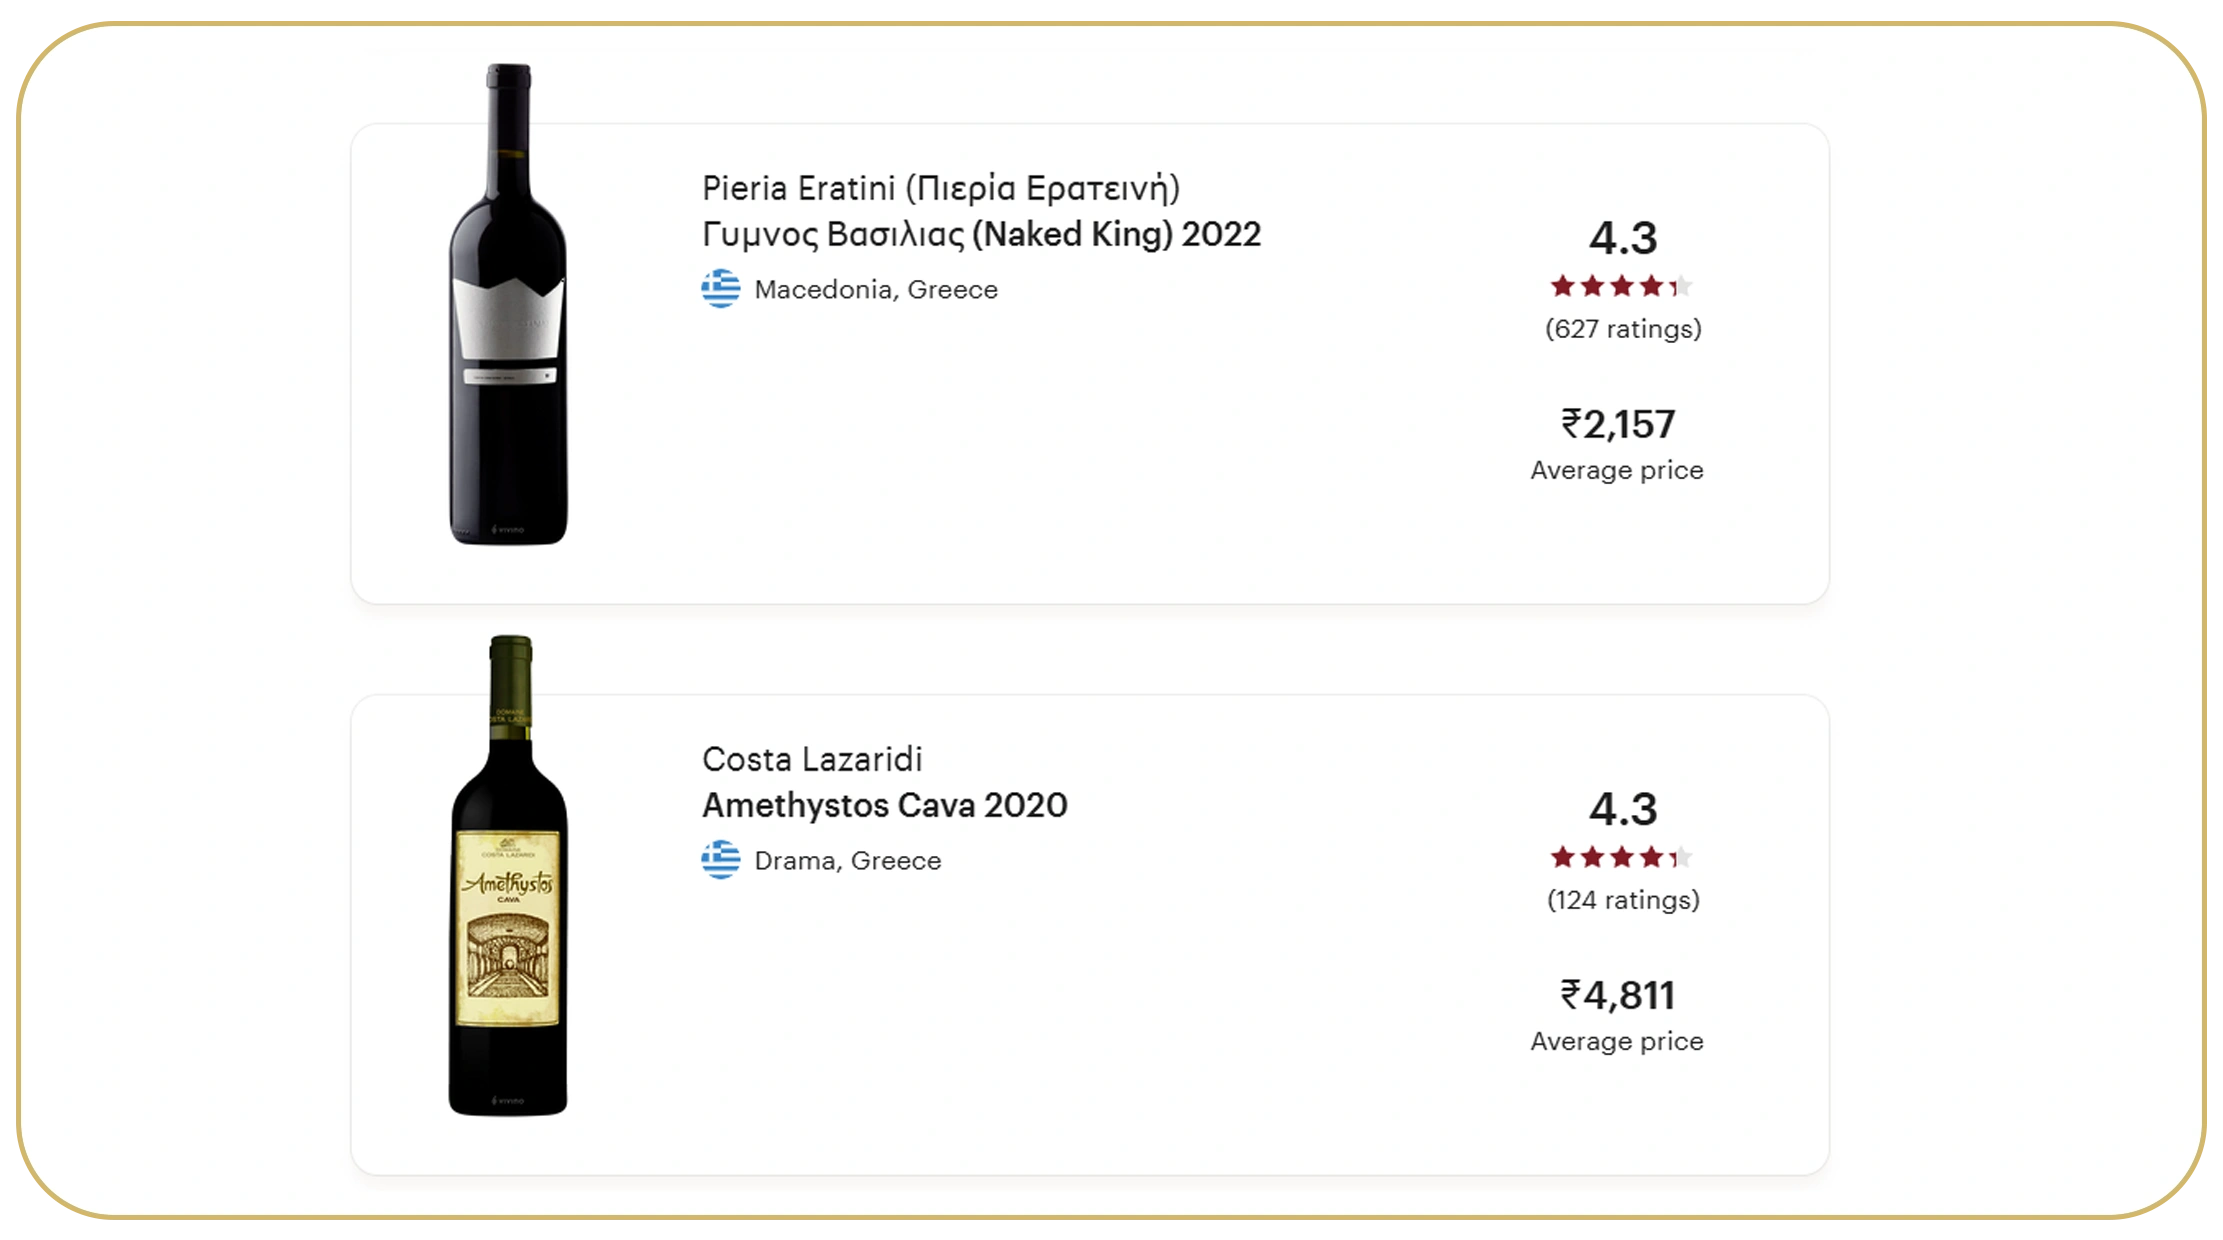
Vivino data scraping for wine price analysis can transform individual product observations into a historical pricing dataset. The useful fields include wine name, winery, country, region, grape variety, vintage, bottle size, listed price, discounted price, rating, review count, availability, and timestamp.
The objective is to calculate more than an average price. A buyer can measure median price, price dispersion, discount depth, price-per-rating point, price movement by vintage, and changes within comparable wine categories.
OIV data shows why historical context matters. Global wine production was 263.0 million hectolitres in 2020, 260.8 million in 2021, 263.8 million in 2022, 237.3 million in 2023, and 225.6 million in 2024. OIV's latest assessment puts 2025 production at approximately 227 million hectolitres.
Global supply context, 2020-2026
| Year | Global wine production, mhl | Data status | Pricing-intelligence implication |
|---|---|---|---|
| 2020 | 263.0 | OIV | Establishes pandemic-era baseline |
| 2021 | 260.8 | OIV | Relatively stable supply |
| 2022 | 263.8 | OIV | Inflation and logistics affected prices |
| 2023 | 237.3 | OIV | Lower supply increased monitoring importance |
| 2024 | 225.6 | OIV | Lowest production since 1961 |
| 2025 | ~227.0 | OIV estimate | Supply remained historically constrained |
| 2026 | Not yet annualized | Outlook | Track SKU-level price responses |
OIV reported that 2022 global wine exports reached a record €37.6 billion while the average export price increased 15% year over year, demonstrating how supply and cost pressure can change pricing even when consumption softens.
For commercial teams, this means historical price monitoring should be segmented by country, grape, vintage, rating band, bottle size, and retailer. A Cabernet Sauvignon at one price point cannot automatically be compared with every Cabernet Sauvignon in the market.
The actionable insight is to create comparable product cohorts. If several similarly rated wines move upward while one competitor remains stable, the stable product may represent a pricing threat—or a margin opportunity.
What Makes API-Based Collection More Useful Than Manual Monitoring?
Data collection services using Vivino API for wine intelligence can support continuous, structured collection instead of manually copying product information into spreadsheets.
An API-led architecture can standardize product identifiers and create recurring snapshots. Each observation can contain the product's current price, previous price, discount, rating, review count, availability, vintage, region, grape, and timestamp. Historical snapshots then become the foundation for trend analysis.
This matters because wine prices are not static. A product may appear at a promotional price today and return to its regular price tomorrow. Without timestamps, a buyer cannot distinguish a genuine market-price change from a temporary promotion.
Operational data framework, 2020-2026
| Year | Recommended data maturity | Primary business use |
|---|---|---|
| 2020 | Historical baseline | Identify pre/post-pandemic changes |
| 2021 | Expanded product tracking | Compare demand normalization |
| 2022 | Price + promotion tracking | Detect inflationary effects |
| 2023 | SKU-level history | Monitor supply-driven price movement |
| 2024 | Multi-market monitoring | Compare regional pricing |
| 2025 | Near-real-time intelligence | React to faster market changes |
| 2026 | Automated decision layer | Forecast, alert, and optimize |
The dataset should also distinguish between product attributes and market observations. Product attributes change relatively slowly: winery, grape, country, region, and vintage. Market observations change frequently: price, discount, availability, ranking, and review volume.
That distinction prevents unnecessary duplication and improves storage efficiency.
A strong data pipeline should also validate anomalies. For example, a sudden 70% price reduction might represent a genuine promotion, a currency issue, a bottle-size mismatch, or a data-quality problem. Automated validation rules can flag unusual movements before they reach pricing dashboards.
For distributors and retailers, the most valuable output is therefore not raw scraped data. It is a clean historical dataset that can be connected to dashboards, pricing models, forecasting systems, and business intelligence workflows.
How Can Competitive Analysis Identify Underserved Wine Segments?
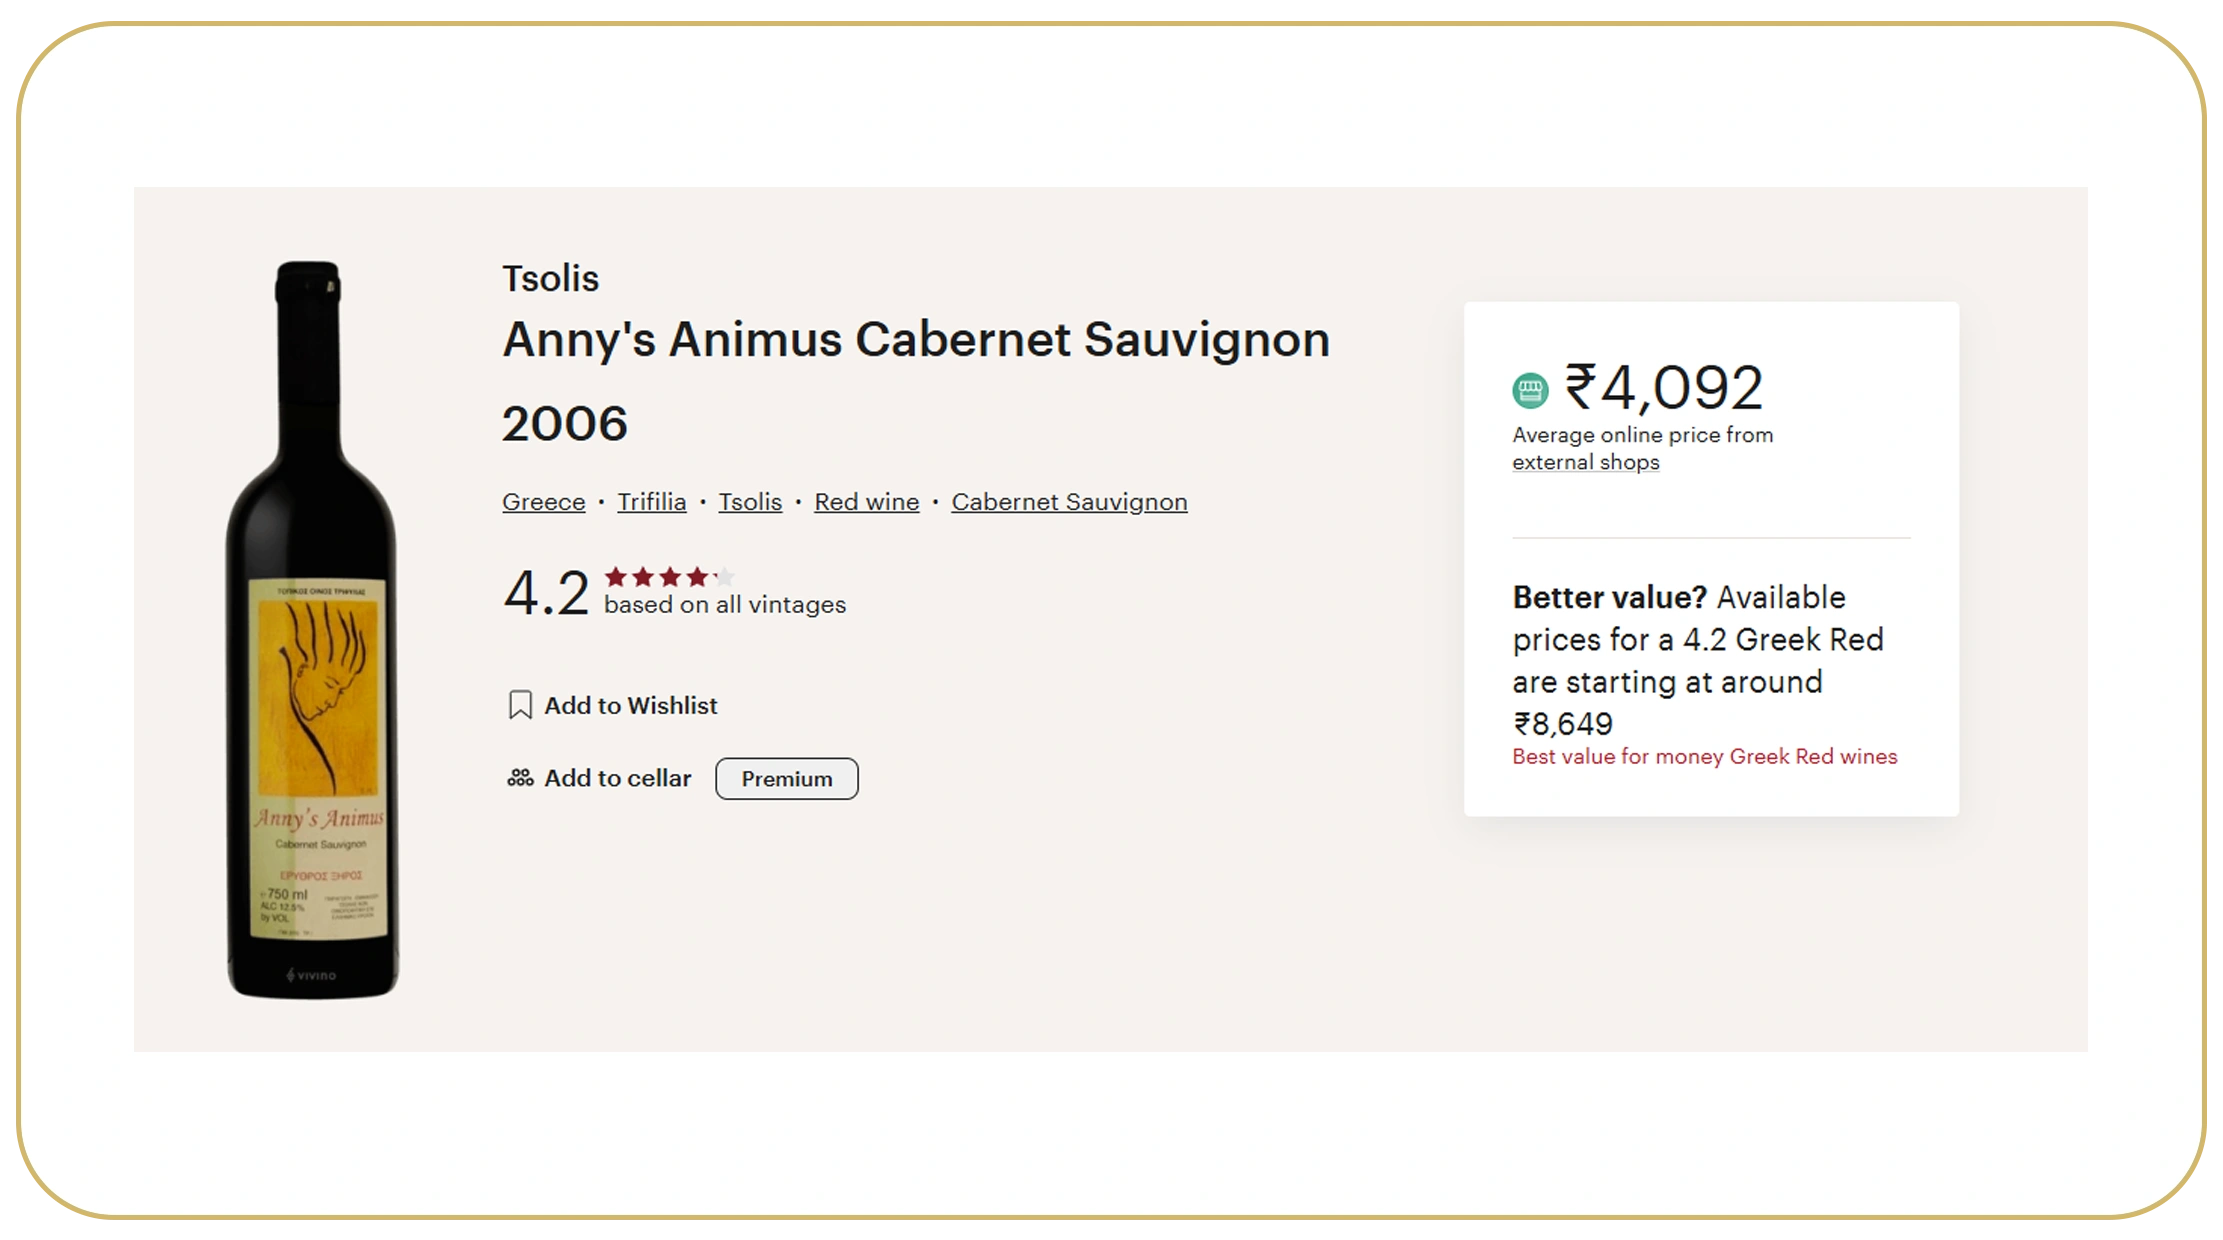
A Vivino wine data scraper for competitive analysis can help businesses compare their assortment with competing products across price, quality perception, geography, vintage, grape variety, and consumer engagement.
Vivino's current marketplace demonstrates the depth of product-level information available for analysis. Its public wine discovery pages expose price ranges, ratings, vintages, wine types, grapes, and regions.
For example, a competitor analysis can classify products into four strategic groups:
- High rating + high price — premium positioning.
- High rating + moderate price — potential value leaders.
- Low rating + low price — entry-level products.
- High rating + limited availability — potential opportunity products.
Competitive signal framework, 2020-2026
| Year | Priority signal | Example decision |
|---|---|---|
| 2020 | Product assortment | Which categories expanded online? |
| 2021 | Rating growth | Which wines gained consumer acceptance? |
| 2022 | Price movement | Which products absorbed inflation? |
| 2023 | Availability | Which SKUs became harder to source? |
| 2024 | Rating-price relationship | Which wines offer strongest perceived value? |
| 2025 | Competitor promotions | Which discounts are recurring? |
| 2026 | Opportunity scoring | Which gaps should be filled next? |
A practical opportunity score can combine rating, review velocity, price competitiveness, availability, discount frequency, and category growth. This is more useful than ranking wines only by rating.
For instance, a 4.2-rated wine with thousands of reviews and consistent availability may be commercially stronger than a 4.6-rated wine with very few reviews. Likewise, a highly rated wine priced significantly above comparable products may have limited volume potential.
The analysis should therefore answer three questions: What sells? What is competitively priced? What is missing?
For brands, this can reveal whether competitors are winning at a particular price tier. For retailers, it can identify assortment gaps. For distributors, it can highlight categories where demand signals are strong but supply appears limited.
Turn wine-market signals into smarter pricing, assortment, and sourcing decisions with scalable Vivino data intelligence—start building your competitive advantage today!
Get Insights Now!Which Product Categories Can Reveal New Market Opportunities?
A structured Vivino Liquor Dataset can combine wine-level attributes with market observations to identify emerging categories, premiumization patterns, and gaps in assortment. The broader objective of Vivino data extraction for wine market intelligence is to move from product discovery toward market opportunity detection.
Vivino's current platform contains millions of searchable wines and extensive consumer-generated ratings and reviews, providing a broad digital signal layer for wine research.
Opportunity-monitoring framework, 2020-2026
| Year | Market condition | Dataset opportunity |
|---|---|---|
| 2020 | Disrupted purchasing behavior | Capture digital assortment |
| 2021 | Online discovery expansion | Track new SKUs and ratings |
| 2022 | Inflation and supply disruption | Compare price elasticity |
| 2023 | Lower global production | Monitor premium pricing |
| 2024 | Historically low production | Identify supply-sensitive categories |
| 2025 | Softening consumption + constrained supply | Detect value segments |
| 2026 | Data-led category optimization | Build opportunity scores |
OIV estimates that 2024 global wine consumption fell 3.3% to 214 million hectolitres, the lowest level since 1961, while global production also reached historically low levels. In 2025, consumption was estimated at 208 million hectolitres, down 2.7% from 2024.
These conditions make segmentation increasingly important.
A market-intelligence dataset can identify whether consumers are shifting toward specific price bands, grape varieties, countries, wine styles, or vintages. It can also compare demand signals against availability.
Consider a simple example: if wines priced between $15 and $25 consistently receive strong ratings and increasing review activity while premium products above $50 experience weaker engagement, a retailer could test assortment expansion in the mid-premium segment.
Similarly, if a particular region shows strong ratings but relatively few competing products, that may indicate an assortment opportunity.
The key is to avoid interpreting any single metric in isolation. Ratings indicate consumer perception, prices indicate commercial positioning, and availability indicates market accessibility. Combined, they provide a more useful opportunity signal.
How Can Delivery and Marketplace Data Improve Wine Availability Decisions?
A Vivino Food Delivery Data API workflow can be useful when wine-market intelligence needs to be combined with broader digital-commerce observations. For businesses selling wine through marketplaces, delivery platforms, or omnichannel retail environments, product availability is as important as product price.
The commercial objective is to connect wine-product intelligence with delivery location, availability, estimated fulfillment, promotions, and local assortment wherever legally and technically appropriate.
Digital-commerce intelligence priorities, 2020-2026
| Year | Priority | Example KPI |
|---|---|---|
| 2020 | Digital availability | Online SKU coverage |
| 2021 | Delivery adoption | Listed products by location |
| 2022 | Cost pressure | Delivery fee and price changes |
| 2023 | Local assortment | Availability by market |
| 2024 | Omnichannel comparison | Marketplace price gap |
| 2025 | Speed + availability | Fulfillment consistency |
| 2026 | Predictive coverage | Stock-risk alerts |
This is particularly relevant for businesses operating across cities or states. A wine may be competitively priced nationally but unavailable in an important local market. A regional dataset can reveal these gaps.
The same framework can measure price differences between channels. If a product consistently appears at a higher price on one marketplace than another, the business can investigate whether the difference is caused by taxes, logistics, commissions, promotions, or retailer positioning.
The data should also preserve location and timestamp fields. Without these fields, local price comparisons can become misleading.
Another useful metric is availability-adjusted competitiveness. Instead of asking which competitor has the lowest price, ask which competitor has the best combination of price, rating, availability, and delivery proposition.
That produces a much more realistic view of customer choice.
For commercial teams, the result can support local assortment planning, pricing decisions, promotional calendars, and channel strategy.
How Should Businesses Benchmark Competitor Prices?
Vivino Competitor Price Analysis becomes more powerful when price is evaluated alongside product similarity, rating, vintage, bottle size, region, and promotional status.
The first step is product matching. Two products should not be compared merely because they share the same grape. Ideally, matching considers winery, wine name, vintage, region, bottle size, and product type.
Benchmarking model, 2020-2026
| Year | Benchmarking focus | Useful metric |
|---|---|---|
| 2020 | Baseline pricing | Median SKU price |
| 2021 | Market recovery | Price change % |
| 2022 | Inflation | Price index |
| 2023 | Supply pressure | Price dispersion |
| 2024 | Scarcity | Premium versus baseline |
| 2025 | Promotional behavior | Discount frequency |
| 2026 | Competitive optimization | Recommended price range |
A practical competitive-price index can be calculated as:
Competitive Price Index = Your Price ÷ Comparable-Market Median Price × 100
A value of 100 means the product matches the market median. A value above 100 indicates a higher price, while a value below 100 indicates a lower price.
However, price alone is insufficient. A wine priced 10% above the market may still be competitive if it has substantially stronger ratings, more reviews, better availability, or a more desirable vintage.
This creates an opportunity to build value-adjusted price benchmarking.
For example:
| Product | Price | Rating | Market position |
|---|---|---|---|
| A | $18 | 3.7 | Value |
| B | $22 | 4.1 | Strong value |
| C | $29 | 4.3 | Premium |
| D | $35 | 4.5 | Super-premium |
The right conclusion is not automatically that Product A is the best buy. Product B may offer the strongest combination of price and consumer perception.
This type of analysis can help retailers determine where to match competitors, where to maintain premium pricing, and where to use promotions.
Why Choose Real Data API?
For wine retailers, distributors, brands, marketplaces, and research teams, Vivino data extraction for wine market intelligence requires more than collecting isolated product records. The commercial value comes from structured, repeatable, timestamped information that can feed dashboards and analytical workflows.
Real Data API can be positioned as the data-delivery layer for businesses that need scalable extraction, normalization, recurring collection, and downstream analytics. A useful implementation should support fields such as product name, winery, vintage, grape, region, rating, review count, price, discount, availability, and collection timestamp.
The biggest advantage is operational consistency. Instead of relying on manual research, teams can establish a repeatable pipeline for monitoring market movements.
For pricing teams, that can mean faster competitive benchmarking. For category managers, it can mean stronger assortment decisions. For market researchers, it can mean a larger historical evidence base.
The goal is straightforward: convert fragmented wine-market observations into structured intelligence that supports measurable commercial decisions.
Conclusion
Wine-market competition is increasingly shaped by price transparency, consumer ratings, product availability, supply constraints, and rapidly changing digital purchasing behavior. Vivino data extraction for wine market intelligence provides a practical foundation for tracking these signals at product level and turning them into actionable market insights.
The strongest approach combines historical snapshots with current observations, then segments results by product, price, rating, vintage, region, competitor, and location. OIV data confirms that global wine production has faced significant supply pressure, falling from 263.0 million hectolitres in 2020 to 225.6 million in 2024, with 2025 remaining historically constrained.
For businesses, the opportunity is to move beyond static product lists and build an intelligence system that identifies price gaps, emerging categories, competitive threats, and assortment opportunities.
Connect with Real Data API to build a scalable data pipeline tailored to your market-monitoring and competitive-analysis requirements!
FAQs
1. What is wine data extraction used for?
Wine data extraction helps retailers and brands monitor prices, ratings, reviews, vintages, availability, assortment, and competitor positioning to identify demand patterns and pricing opportunities.
2. What data fields should wine businesses monitor?
Important fields include wine name, winery, vintage, grape variety, region, bottle size, rating, review count, price, discount, availability, product URL, and timestamp.
3. How frequently should wine prices be monitored?
High-competition retailers should consider daily or more frequent monitoring, while strategic market research may require weekly snapshots. Frequency should match price volatility and business objectives.
4. Can Real Data API support competitive wine research?
Yes. Real Data API can serve as a scalable data-delivery layer for structured collection, historical monitoring, normalization, and downstream wine-market analytics workflows.
5. How can wine businesses turn collected data into decisions?
Businesses can create price indices, competitor benchmarks, assortment-gap models, rating-price analysis, promotion tracking, availability scores, and market-opportunity dashboards from historical datasets.
Latest posts
Keeta scraper for monitoring food marketplace trends - Identify Discount Changes and Emerging Customer Demand
How to build a structured Nike product dataset for Product Intelligence and Retail Analytics
Allegro scraper for competitor price monitoring – How to Track Product Prices and Stay Ahead of Competitors
Ocado API data collection services for retailers - Track Competitor Prices and Deals






.png)



