Introduction
Scrape Fandango Movie Listings for entertainment analytics can help studios, exhibitors, distributors, entertainment researchers, and ticketing businesses transform movie listings, showtimes, ticket prices, theater information, ratings, and availability into structured market intelligence. This data can support demand analysis, competitive pricing, release planning, location-level research, and audience trend monitoring.
Fandango currently provides movie tickets and showtimes across more than 26,000 screens nationwide, with listings organized by movie, theater, city, state, and ZIP code. Its platform also exposes information around movies in theaters, coming-soon titles, offers, and theater amenities.
The value of extracting this information comes from its frequency and granulearity. A single movie listing can reveal the title, release status, location, theater, showtime, format, ticket availability, and displayed price. Collected historically, these observations can help analysts understand how supply and pricing change around releases, weekends, holidays, and promotional periods.
For entertainment businesses, the objective is not merely to collect movie listings. The objective is to connect marketplace-level signals with commercial questions: Which movies are attracting the most showtime capacity? Where are ticket prices highest? Which locations have limited availability? How does pricing differ by theater or format? How quickly does demand appear to change after release?
How Can Movie-Market Research Become More Data Driven?
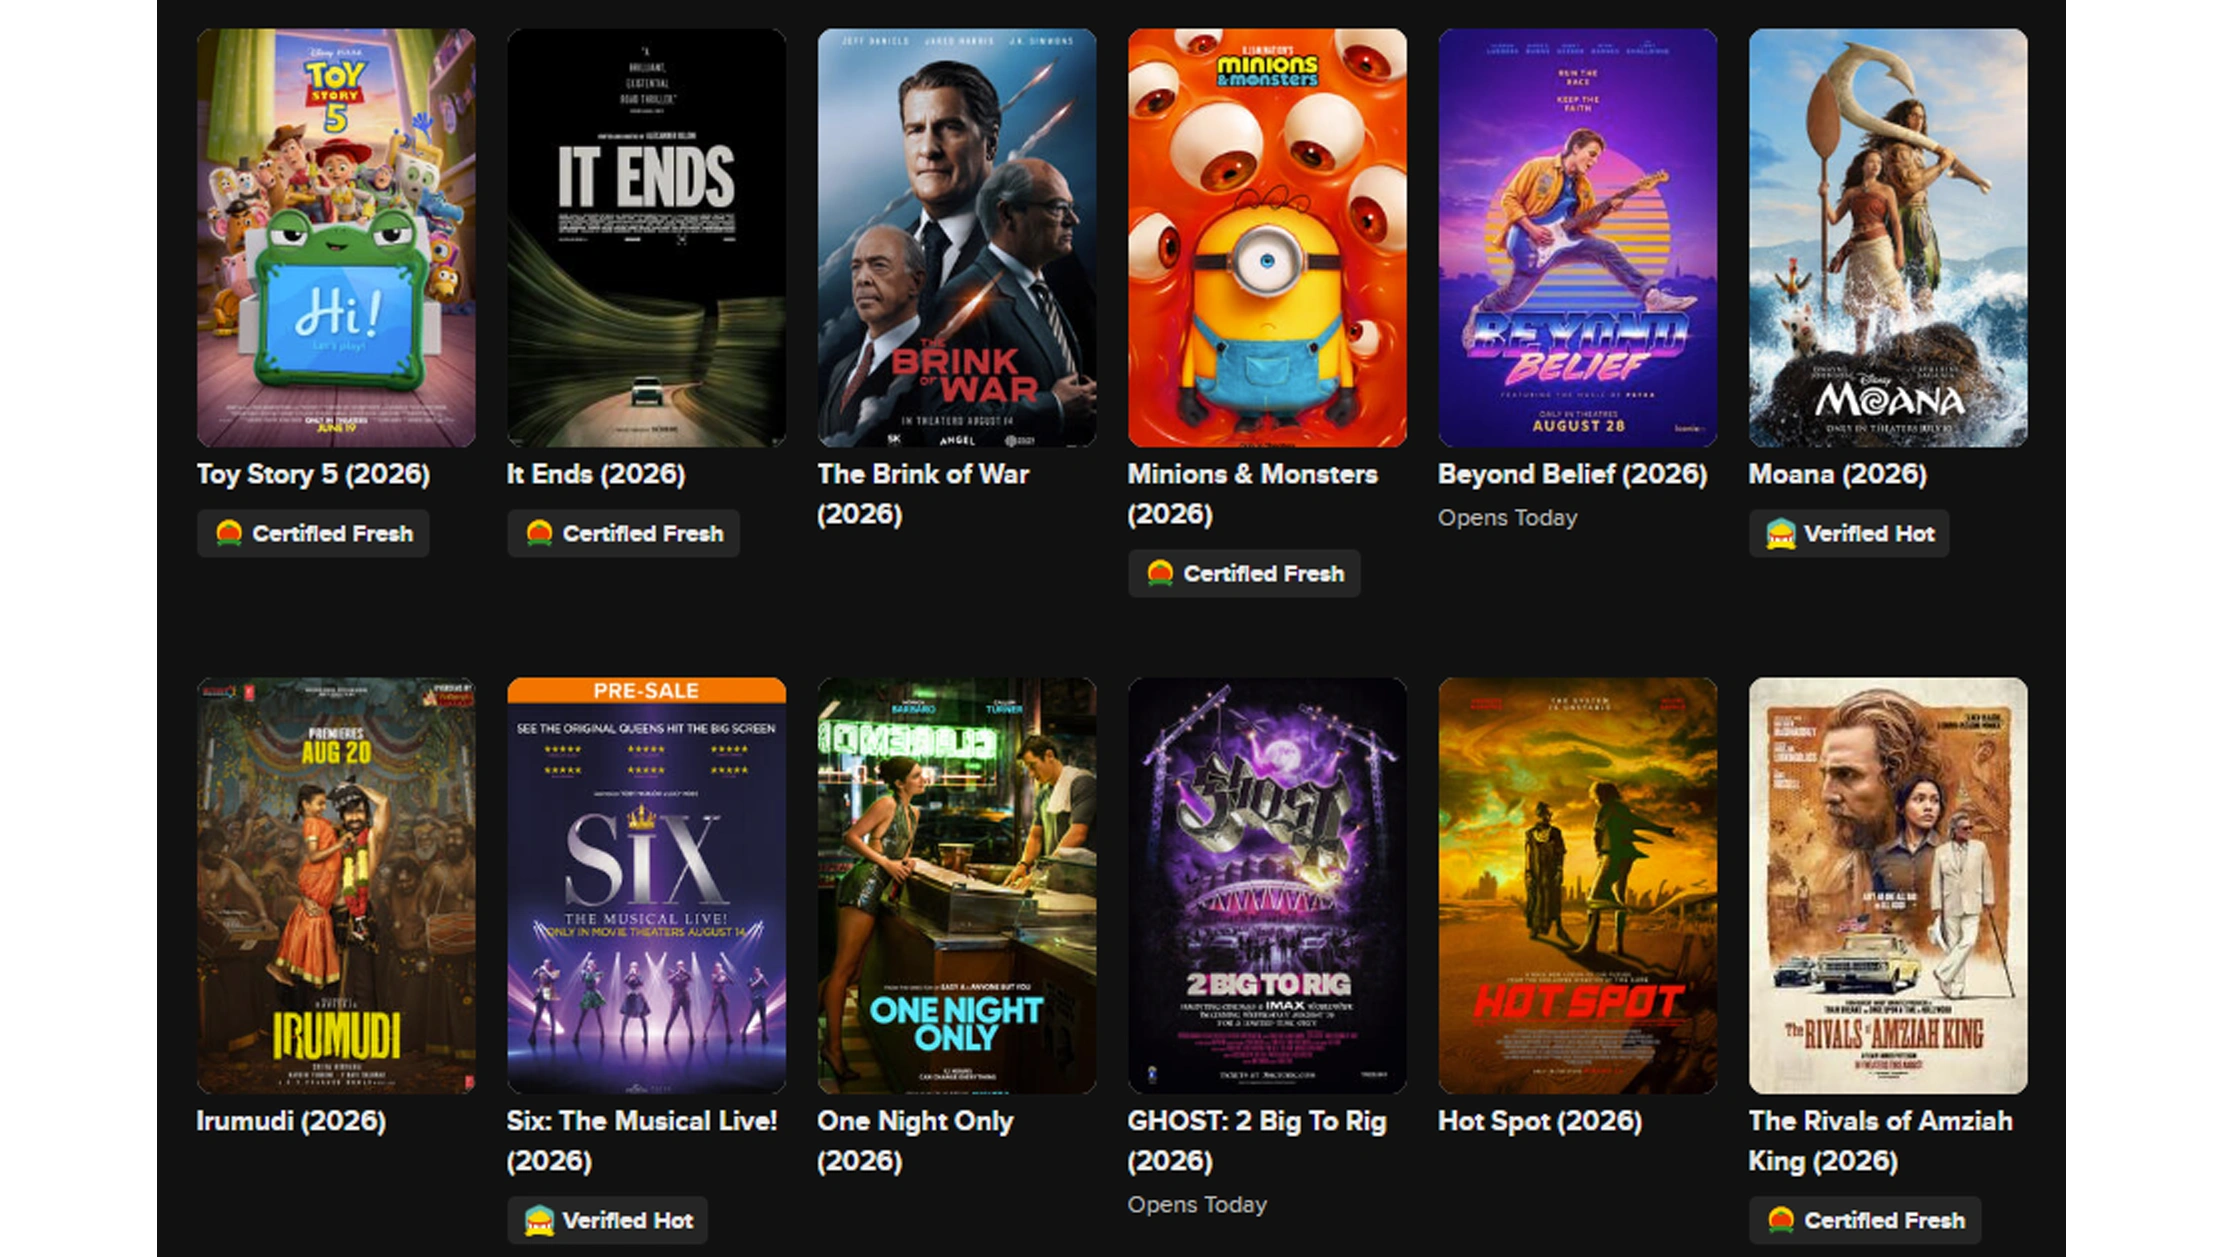
Fandango web scraping for entertainment market research can create a structured observation layer for analyzing theatrical entertainment markets. Researchers can collect relevant publicly available information such as movie titles, theater locations, showtimes, formats, ticket prices, ratings, release dates, and availability, subject to applicable terms and access requirements.
The importance of this data became especially clear after the pandemic disrupted theatrical exhibition. U.S. and Canadian ticket sales fell from 1.2297 billion in 2019 to just 231.6 million in 2020. They recovered to 444.0 million in 2021, 702.1 million in 2022, 819.0 million in 2023, 760.8 million in 2024, and 769.2 million in 2025.
U.S. and Canada annual ticket sales
| Year | Tickets sold | YoY change |
|---|---|---|
| 2020 | 231.6M | -81.2% vs. 2019 |
| 2021 | 444.0M | +91.7% |
| 2022 | 702.1M | +58.1% |
| 2023 | 819.0M | +16.6% |
| 2024 | 760.8M | -7.1% |
| 2025 | 769.2M | +1.1% |
| 2026 | N/A | Full-year data not yet available |
Source: Nash Information Services data reproduced by Pew Research Center.
This recovery pattern shows why historical marketplace data matters. An entertainment analyst examining only one year could miss the structural disruption and subsequent recovery. A timestamped dataset makes it possible to compare current conditions against multiple years of market context.
The research process can also be segmented by geography. Since Fandango organizes theater information by cities, states, ZIP codes, and theater locations, researchers can examine how showtime supply and pricing differ between markets.
For example, an exhibitor could compare the number of available showtimes for a major release across metropolitan areas. A distributor could examine whether a movie receives stronger theatrical exposure in particular markets. A market researcher could analyze whether premium formats command different prices from standard screenings.
The key is to treat extracted listing information as market observations rather than automatically equating listings with actual ticket sales. Availability, showtime count, and displayed price are useful signals, but they should be combined with box-office and audience datasets when estimating actual demand.
What Information Can Be Used for Entertainment Analytics?
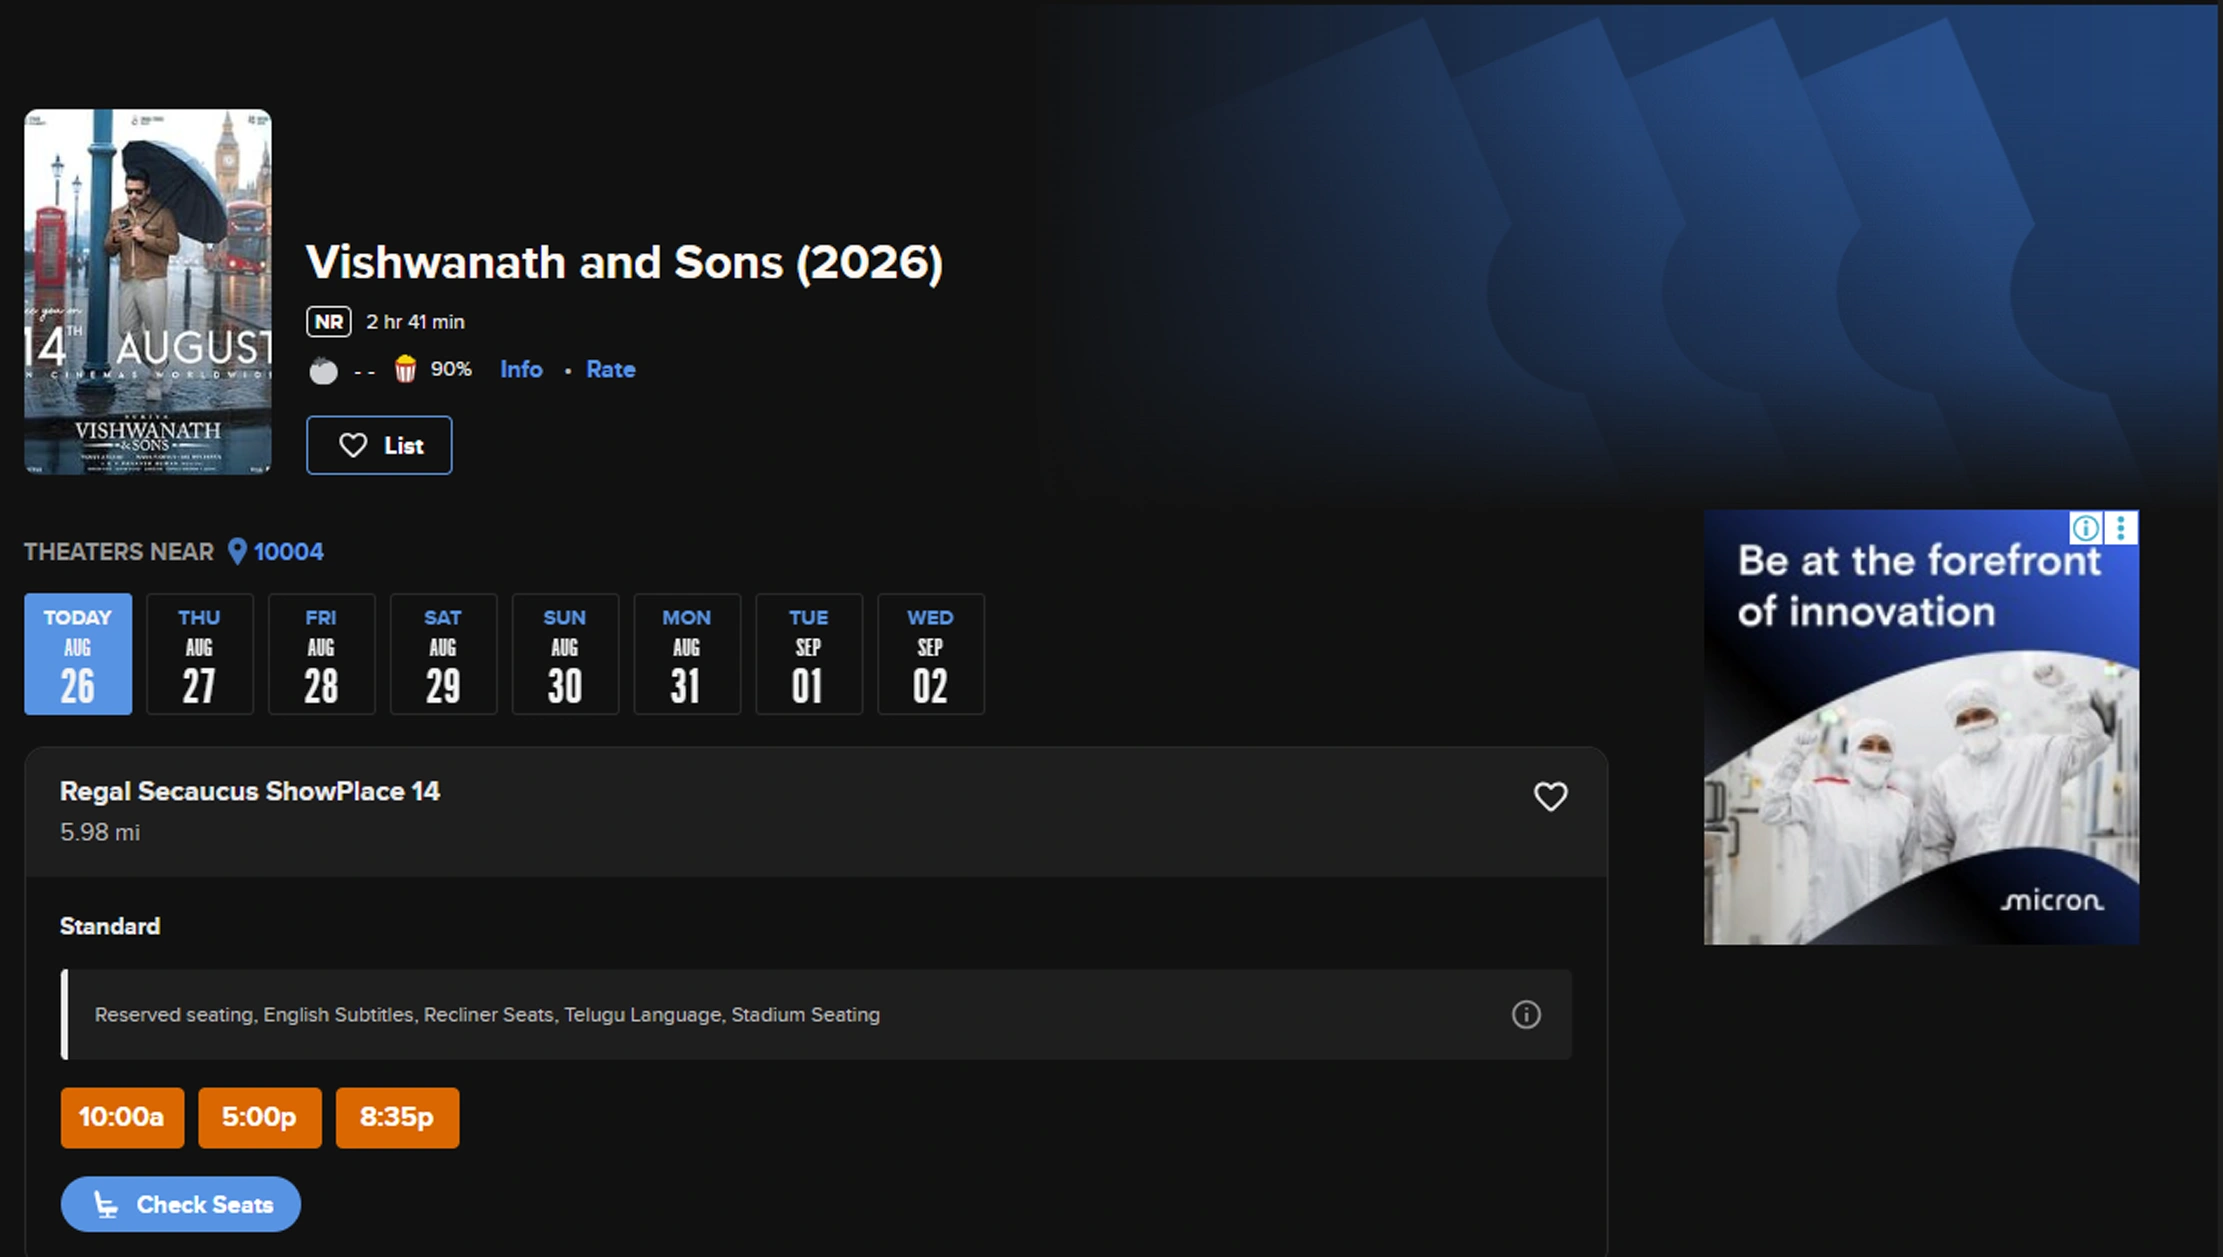
Businesses can extract Fandango information for entertainment analytics by designing datasets around specific research questions. A useful schema can contain movie metadata, theater information, showtime details, ticket prices, formats, dates, locations, ratings, and availability indicators.
Fandango's current platform demonstrates the breadth of information available for movie discovery. Its search functionality organizes results across movies, theaters, cast and crew, videos, and editorial content, while movie pages provide release and showtime information.
The data becomes significantly more useful when captured repeatedly. For example, a movie's showtime count on Monday can be compared with its Friday schedule. Price observations can be compared across theaters. Availability can be tracked before and after a major release.
Theatrical recovery context
| Year | Tickets sold | Market interpretation |
|---|---|---|
| 2020 | 231.6M | Severe pandemic disruption |
| 2021 | 444.0M | Initial recovery |
| 2022 | 702.1M | Strong reopening-driven growth |
| 2023 | 819.0M | Recovery continued |
| 2024 | 760.8M | Pullback from 2023 |
| 2025 | 769.2M | Relatively stable year |
| 2026 | N/A | Current-year monitoring required |
Pew Research Center notes that 2025 ticket volume remained well below the levels seen before the pandemic, despite being more than three times 2020's volume.
For analysts, this creates several opportunities. Historical showtime data can help identify release patterns. Price data can support competitive benchmarking. Theater-level data can reveal geographic differences. Movie metadata can enable genre and rating analysis.
However, a responsible research methodology should distinguish between observed and inferred information. A listing showing many showtimes does not prove that those screenings are sold out. Similarly, a higher ticket price does not necessarily mean stronger demand. The dataset should therefore be positioned as an intelligence layer that supports analysis, not as a substitute for verified transaction data.
This distinction is particularly important when building AI or machine-learning models. Models trained on marketplace observations can become misleading if listing availability is incorrectly labeled as demand. Better results come from combining extracted observations with verified outcome variables such as box office, attendance, or internal ticketing data.
How Can Current Data Improve Movie Demand Monitoring?
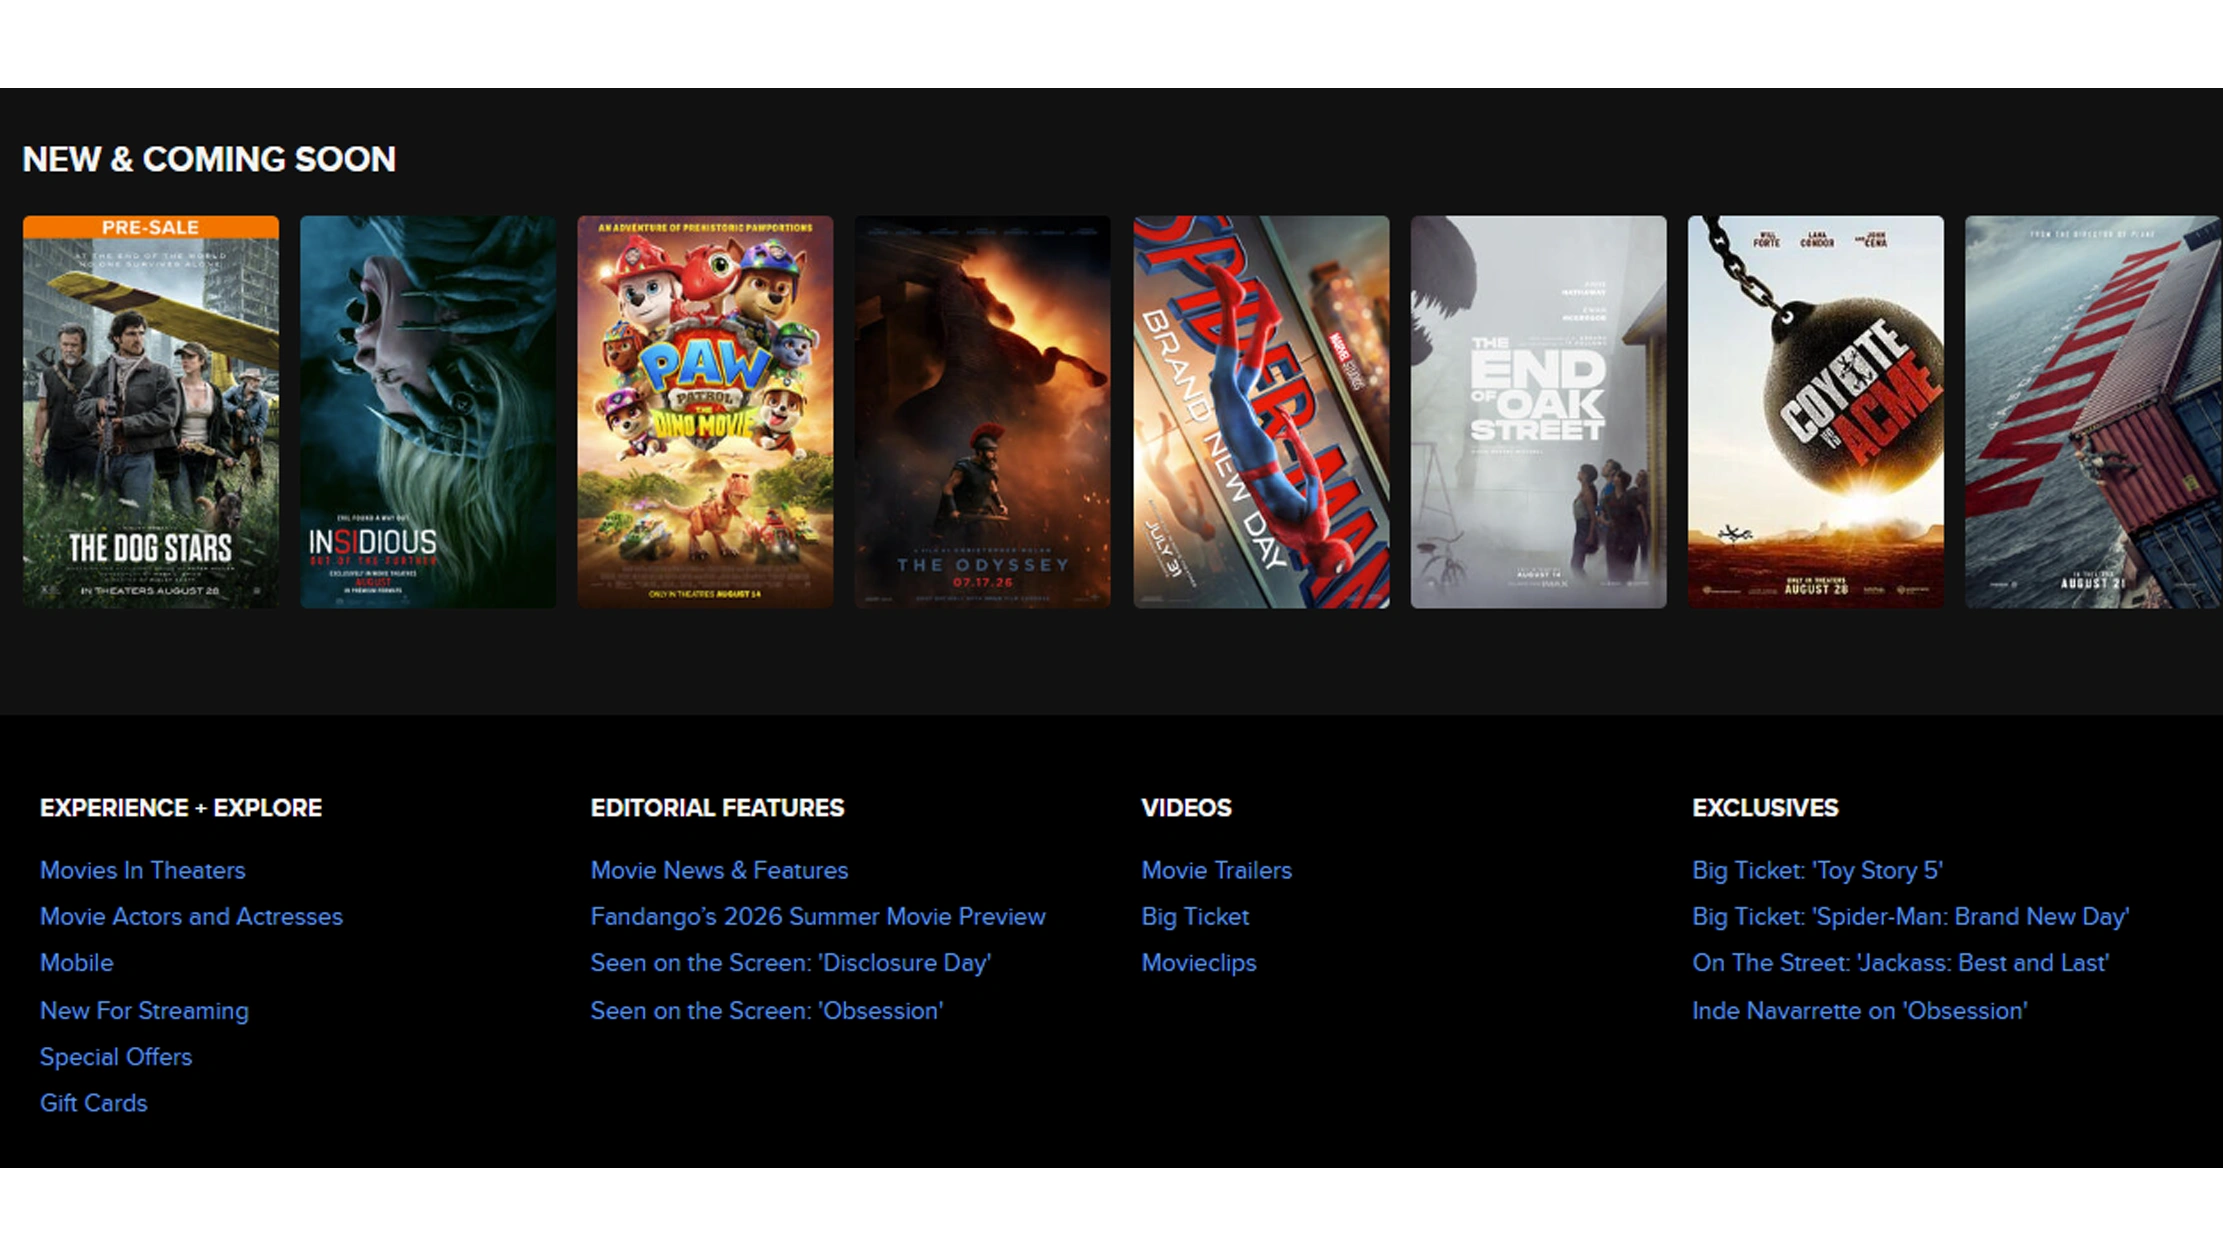
A real-time Fandango data extraction API can help businesses incorporate frequently refreshed marketplace observations into their analytics systems. Instead of relying on periodic manual exports, an API-oriented architecture can deliver structured records to databases, dashboards, data warehouses, or internal applications according to the project's requirements.
The value is particularly high around movie releases. A studio may want to observe theater coverage and showtime availability before opening weekend. An exhibitor may want to compare competing releases. A market researcher may want to measure how quickly showtime supply changes after a film launches.
Fandango's theater directory states that the platform provides showtimes and tickets across more than 26,000 screens nationwide. That scale creates a significant opportunity for location-level analysis.
Example analytical framework, 2020-2026
| Year | Ticket-sales benchmark | Data-collection focus |
|---|---|---|
| 2020 | 231.6M | Pandemic disruption |
| 2021 | 444.0M | Reopening patterns |
| 2022 | 702.1M | Demand recovery |
| 2023 | 819.0M | Market expansion |
| 2024 | 760.8M | Demand normalization |
| 2025 | 769.2M | Stabilization |
| 2026 | N/A | Current marketplace monitoring |
Ticket-sales figures are U.S./Canada totals from Nash Information Services as reported by Pew Research Center.
An API-based workflow can maintain timestamps for each observation. This allows analysts to calculate changes in showtime count, price, availability, and theater coverage.
For example, suppose a film has 100 observed showtimes in a metropolitan market three days before release and 140 one day before release. That change can be treated as an increase in scheduled supply. If ticket prices simultaneously increase, the combination becomes a useful signal for further investigation. It still should not be interpreted automatically as proof of higher consumer demand.
The API layer can also support automated alerts. A business could define rules for significant price changes, sudden reductions in showtimes, new theater additions, or changes in availability. These alerts can help analysts focus on exceptions rather than continuously reviewing every listing.
The resulting architecture is especially valuable for entertainment companies that need recurring intelligence rather than one-time research.
Which Marketplace Signals Can Reveal Entertainment Trends?
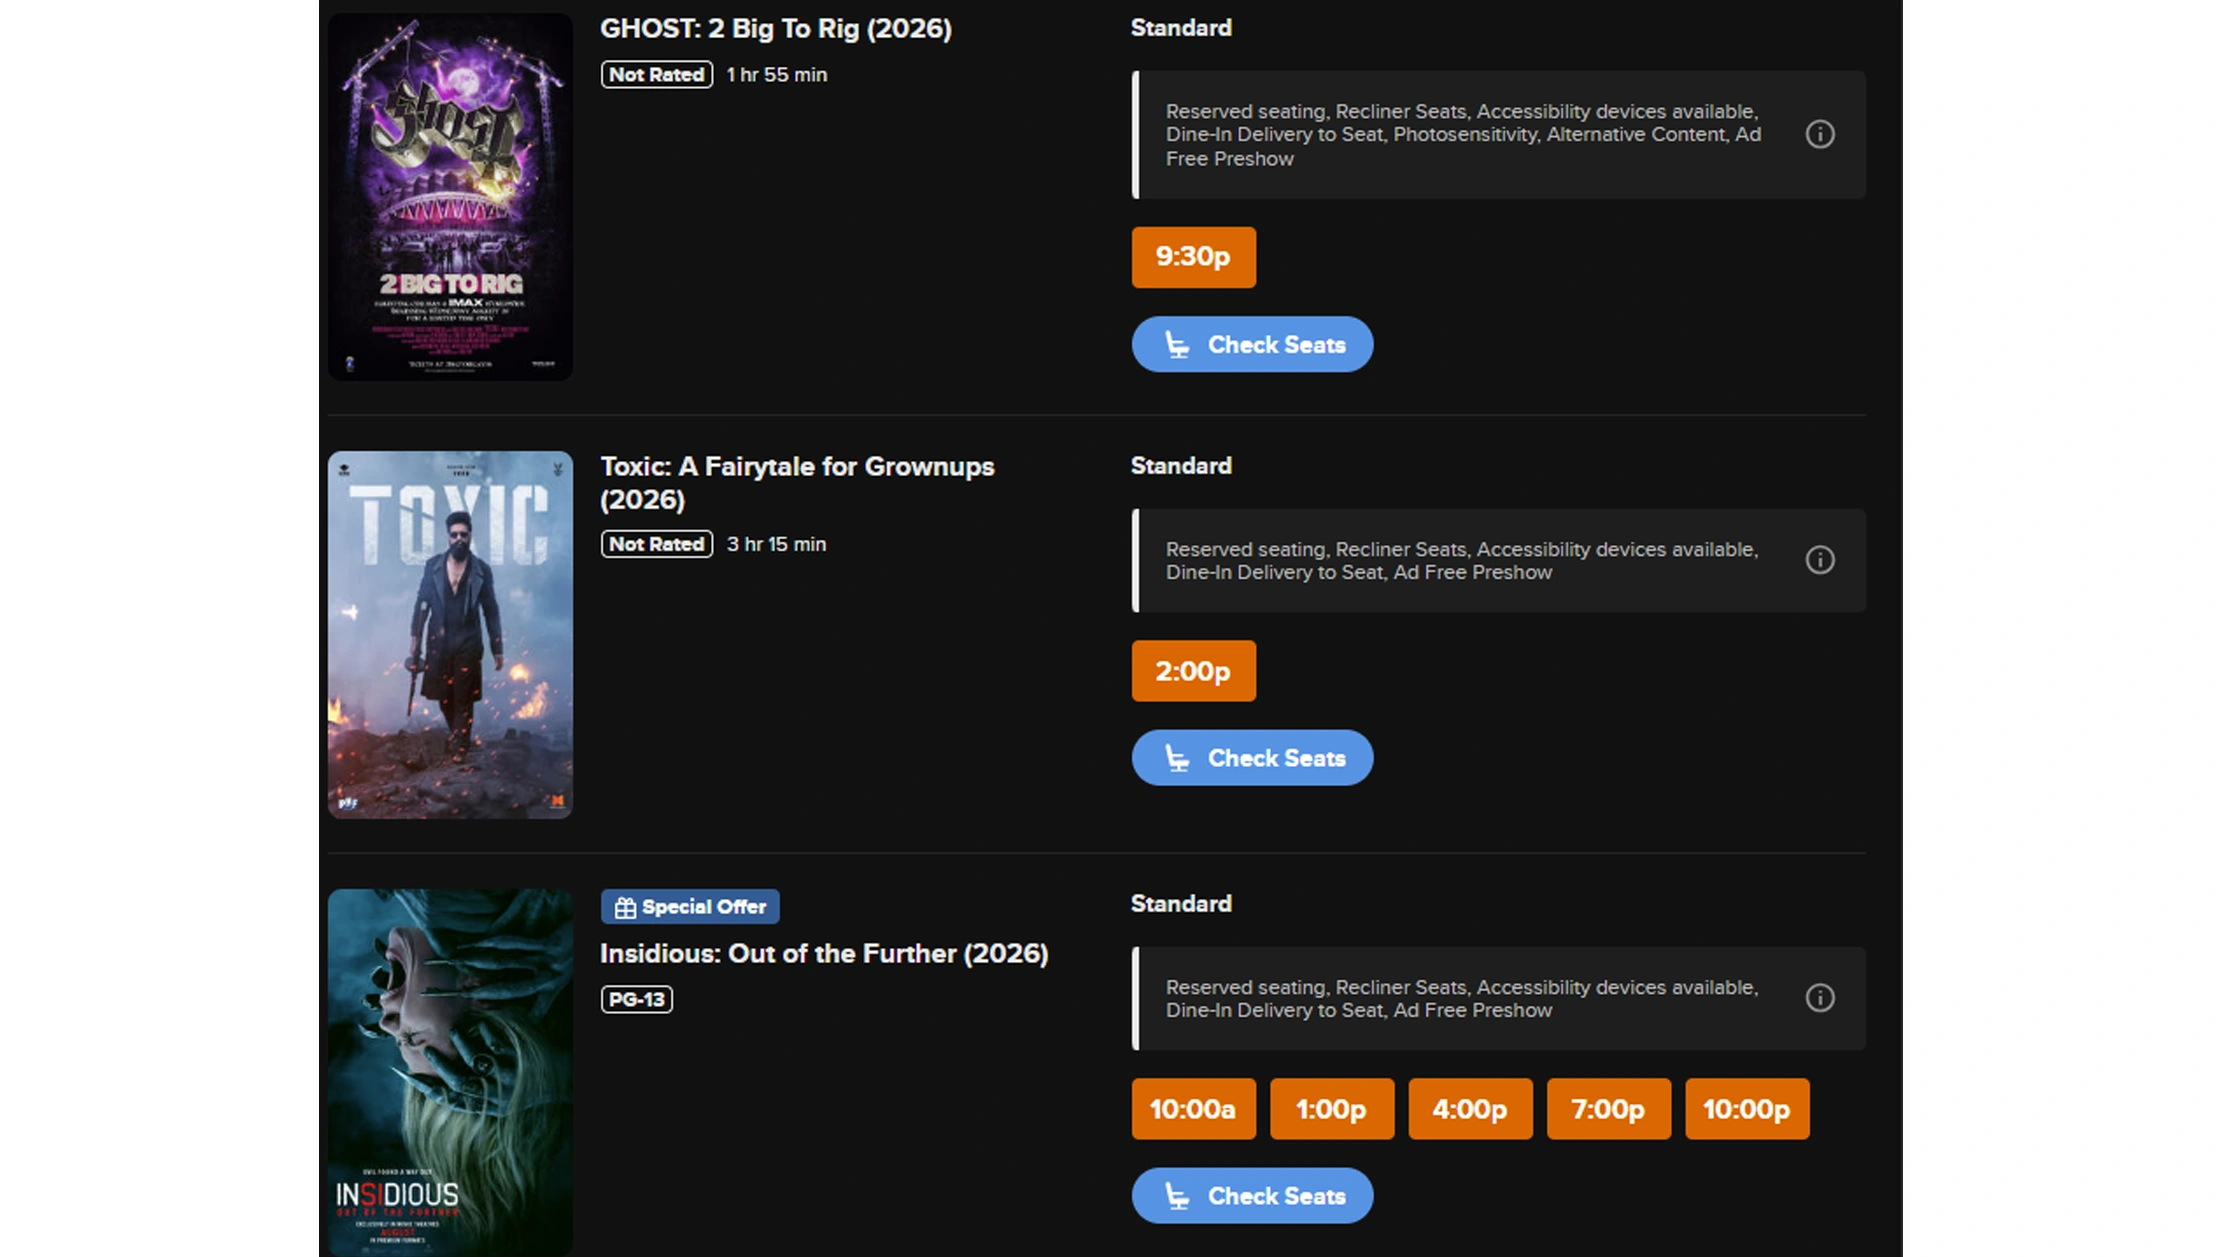
A Fandango web data scraper for entertainment insights can collect recurring observations that reveal changes across movies, theaters, locations, and time periods. The objective is to build a longitudinal dataset rather than simply capture today's listings.
One of the most useful dimensions is price. Fandango explains in its ticket policy that it sells tickets on behalf of theaters with contractual ticketing relationships and does not set theater ticket prices, showtimes, or inventory. The displayed price may also include applicable taxes and fees.
This means analysts should preserve the exact displayed price and distinguish it from a theoretical base ticket price. When comparing markets, taxes, fees, premium formats, and theater-specific pricing policies should be considered.
2020-2026 entertainment-market reference
| Year | Tickets sold | Analytical priority |
|---|---|---|
| 2020 | 231.6M | Market shock |
| 2021 | 444.0M | Reopening |
| 2022 | 702.1M | Recovery |
| 2023 | 819.0M | Peak of recent recovery |
| 2024 | 760.8M | Market adjustment |
| 2025 | 769.2M | Stabilization |
| 2026 | N/A | Live monitoring |
The figures show that theatrical attendance has not simply returned to a straight pre-pandemic growth path. That makes granular marketplace observations useful for understanding what is happening at the movie and theater level.
Researchers can examine whether specific genres receive more showtimes, whether premium formats have different price levels, whether release-week availability differs by market, and whether certain theaters consistently feature particular types of films.
The data can also support competitive research. If several movies launch during the same period, analysts can compare their geographic theater coverage and scheduled showtimes. This can provide a view of competitive supply even before final box-office results become available.
For audience analysis, extracted metadata can be combined with ratings, genres, release dates, and external demographic research. This creates a richer dataset for understanding which types of movies attract attention and how entertainment supply changes over time.
Again, the distinction between observed and inferred metrics remains critical. Scraped listings show what the marketplace displays; they do not automatically reveal actual audience behavior.
How Can Scalable Collection Support Entertainment Businesses?
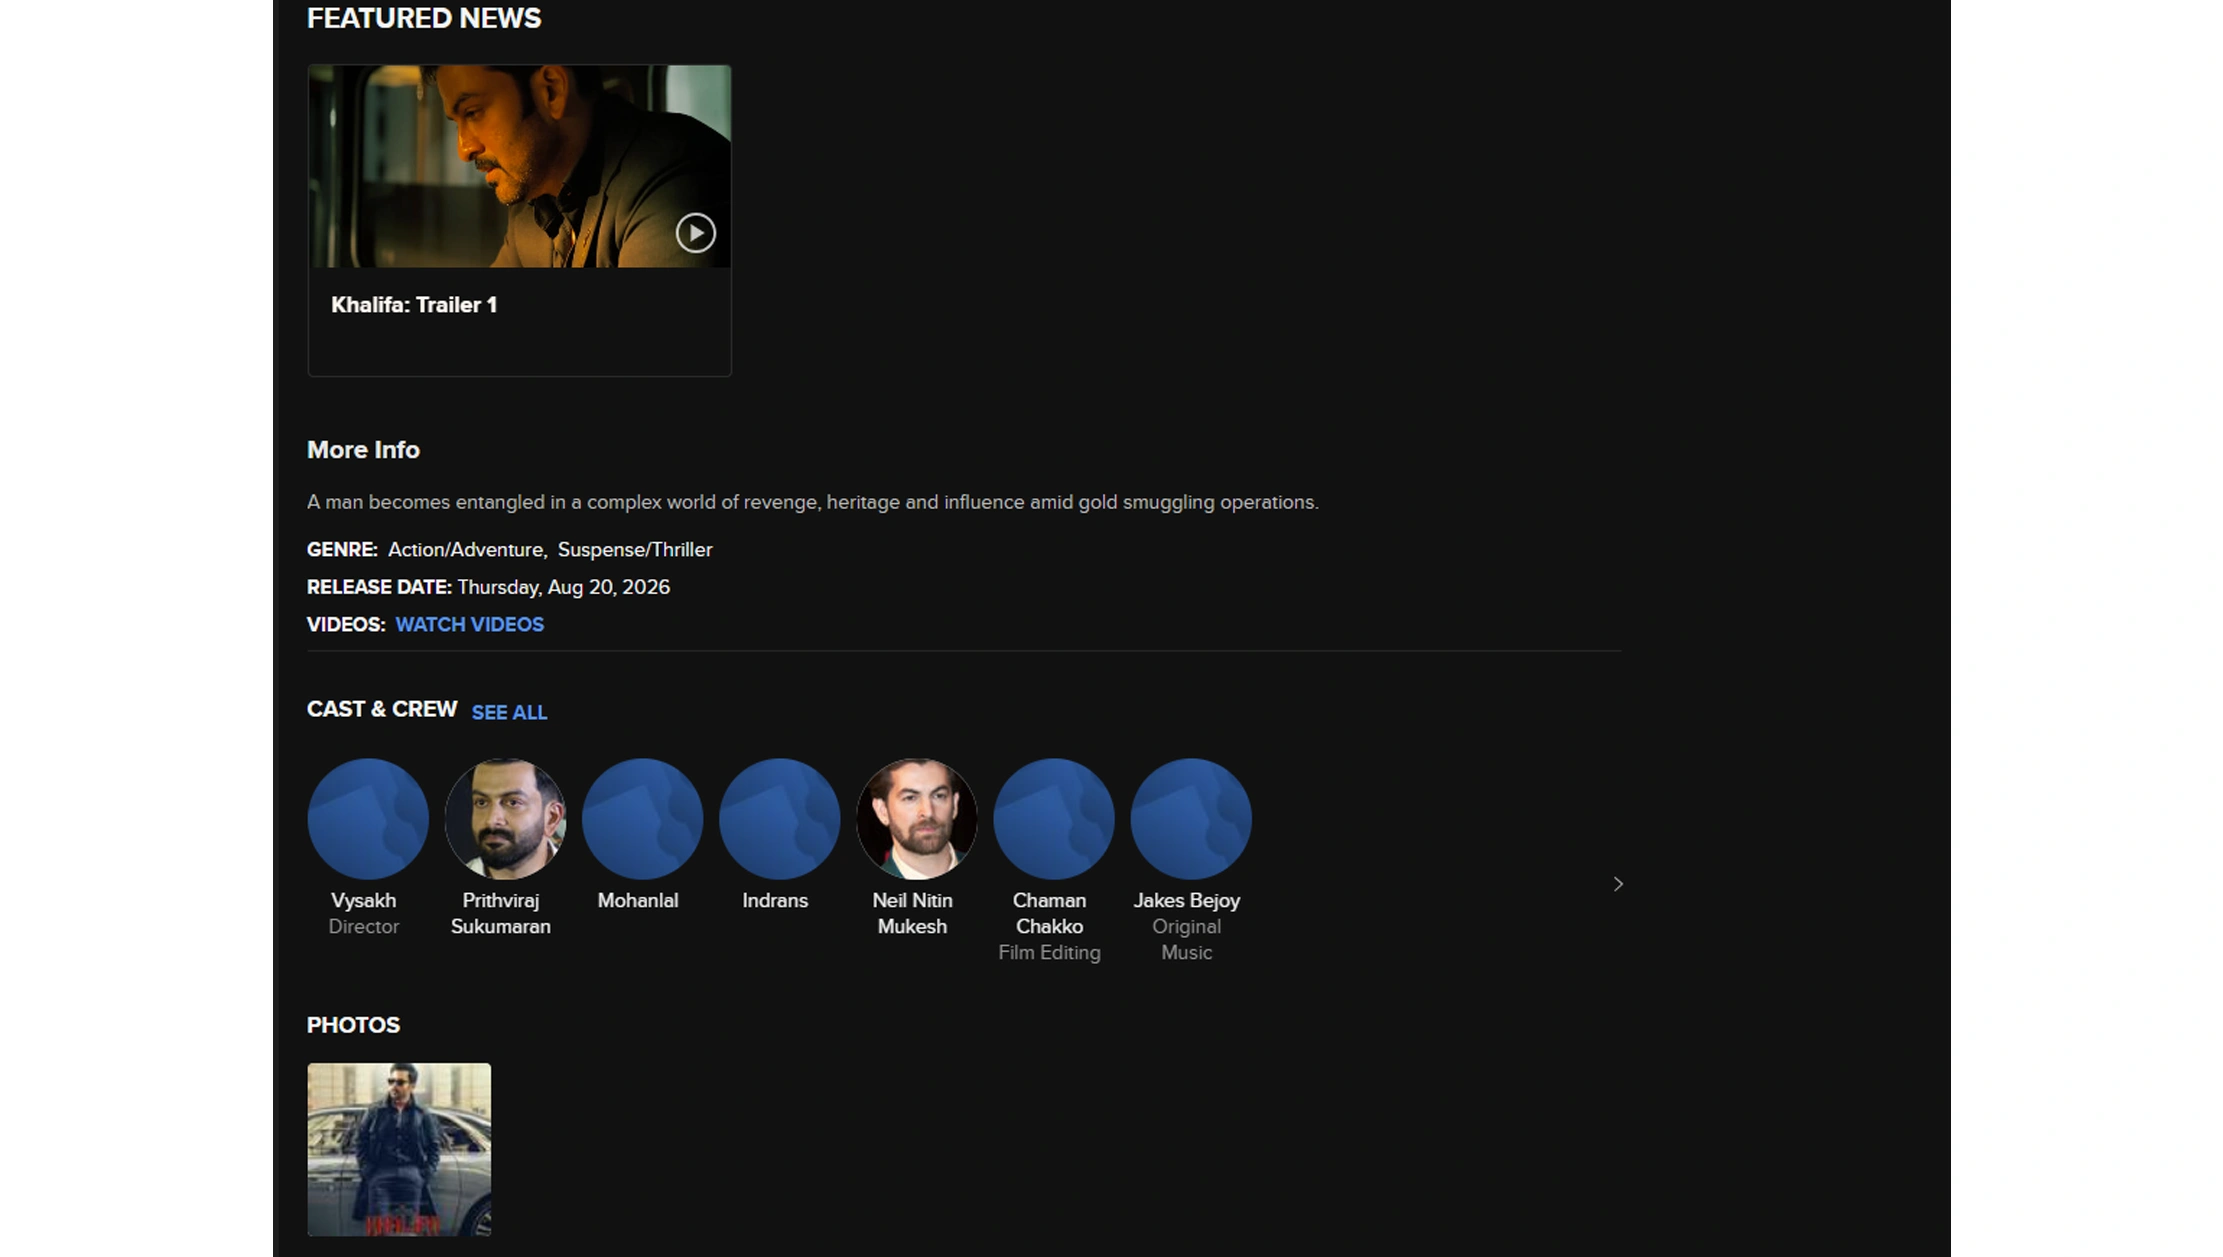
Fandango Web Scraping Services can help entertainment businesses create repeatable data pipelines for movie-market research. The advantage of a service-based approach is that the collection workflow can be designed around the organization's required fields, geography, frequency, and output format.
For a movie studio, the dataset might emphasize title coverage, theater distribution, showtimes, formats, and ticket prices. For a theater operator, the focus could shift toward competitive showtime schedules and market-level pricing. For a research company, a broader dataset may be needed to analyze historical trends across cities and movie categories.
Market scale and data interpretation
| Year | U.S./Canada tickets sold | What the trend indicates |
|---|---|---|
| 2020 | 231.6M | Exceptional market disruption |
| 2021 | 444.0M | Partial recovery |
| 2022 | 702.1M | Significant rebound |
| 2023 | 819.0M | Recent high point |
| 2024 | 760.8M | Lower than 2023 |
| 2025 | 769.2M | Slight recovery |
| 2026 | N/A | Current data collection |
The 2024 and 2025 figures indicate that the market remained below its 2019 level of 1.2297 billion tickets.
This makes data frequency important. Annual statistics are valuable for macro analysis, but they cannot explain what happened to an individual movie between Monday and Friday. Daily or weekly marketplace snapshots can fill that gap.
A scalable pipeline should therefore capture timestamps, source URLs or identifiers, movie metadata, theater identifiers, showtimes, prices, formats, and availability. Historical records should be retained rather than overwritten so that trend analysis remains possible.
Data validation is equally important. Duplicate theaters, changed movie names, canceled showtimes, missing prices, and temporary availability states can affect results. Normalization rules can help create consistent records across collection cycles.
For Real Data API clients, this creates a reusable entertainment intelligence layer. The same dataset can support pricing analysis, demand research, competitor monitoring, location analysis, and dashboard development without rebuilding the collection process for every question.
Can Entertainment Data Be Combined With OTT Intelligence?
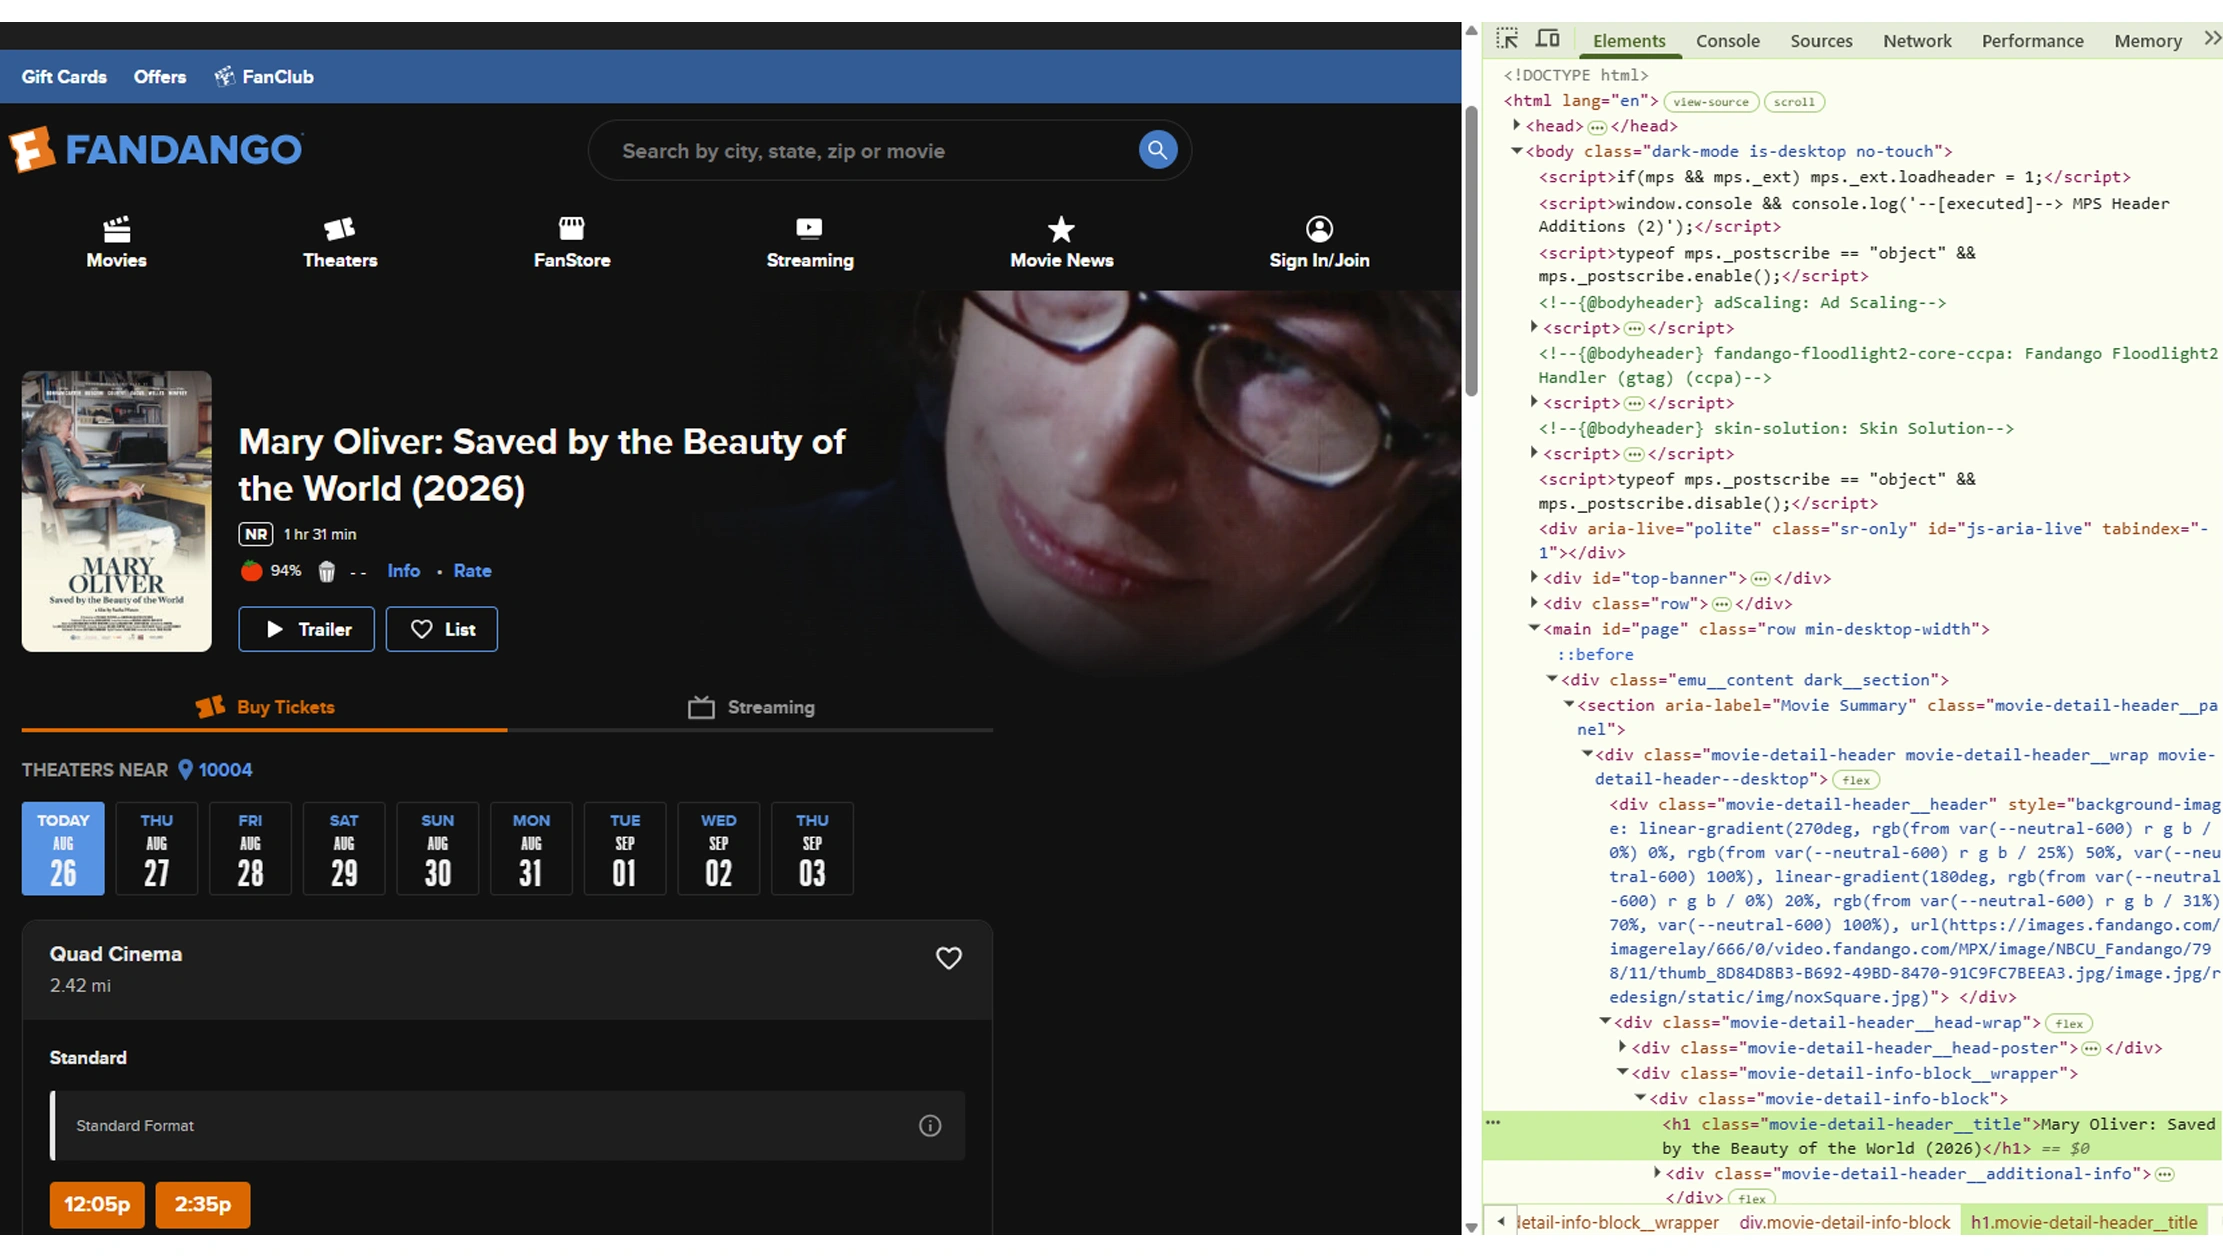
An OTT Data Scraping API can complement theatrical marketplace information by creating a broader entertainment dataset. Theatrical listings show one part of the consumer journey, while OTT availability and content information can provide additional context around digital distribution.
An OTT Dataset can contain information such as titles, genres, release dates, platforms, availability, language, ratings, and other publicly accessible metadata, depending on the project scope and applicable platform requirements. Combining this with theatrical information can help researchers study how entertainment consumption is distributed across cinema and streaming channels.
2020-2026 entertainment context
| Year | U.S./Canada theatrical tickets | Strategic interpretation |
|---|---|---|
| 2020 | 231.6M | Theatrical disruption |
| 2021 | 444.0M | Partial recovery |
| 2022 | 702.1M | Cinema rebound |
| 2023 | 819.0M | Stronger theatrical market |
| 2024 | 760.8M | Lower attendance |
| 2025 | 769.2M | Stabilization |
| 2026 | N/A | Monitor both channels |
Theatrical figures are from Nash Information Services via Pew Research Center.
The analytical advantage comes from combining datasets rather than treating cinema and streaming as isolated markets. Researchers can examine release windows, genre availability, title longevity, and changes in distribution strategy.
For example, a studio could compare the theatrical footprint of a title with its subsequent digital availability. A research firm could examine whether certain genres have stronger theatrical exposure while others have broader streaming representation. A content platform could use market intelligence to identify gaps in genre or regional availability.
This approach also supports more sophisticated forecasting. Instead of using only historical box-office data, analysts can consider theatrical showtime supply, ticket pricing, movie metadata, streaming availability, and broader consumer trends.
However, cross-platform matching must be handled carefully. Titles may use different naming conventions, release dates can vary by market, and availability windows can change. A common identifier or normalized title-matching process is therefore essential.
The broader lesson is that entertainment analytics becomes more powerful when datasets are connected around the same title, market, and time period.
Why Choose Real Data API?
Real Data API can help businesses create structured entertainment data pipelines designed around specific analytical requirements. The focus is on turning fragmented marketplace observations into datasets that can be integrated with business intelligence tools, databases, dashboards, and analytical models.
An OTT Dataset can be incorporated alongside theatrical information when the business wants a broader view of movie and streaming markets. This enables research teams to compare theatrical distribution, digital availability, pricing signals, content categories, and market changes.
For Fandango data extraction for entertainment analytics, Real Data API can support workflows centered on movie listings, showtimes, theater information, pricing, availability, release dates, ratings, and location-level analysis, where the data is accessible and permitted.
The value is particularly strong for teams that need recurring rather than one-time research. Historical snapshots allow analysts to compare current conditions with previous periods, while structured schemas make the information easier to query and analyze.
The platform's scale makes structured collection particularly relevant. Fandango states that it provides access to showtimes and tickets across more than 26,000 screens nationwide. This creates a substantial opportunity for geographic and competitive analysis when the required information is collected appropriately.
A well-designed pipeline should also include data validation, deduplication, timestamps, normalization, monitoring, and clear separation between observed marketplace data and modeled insights.
Conclusion
Fandango data extraction for entertainment analytics can provide entertainment businesses with a structured way to study movie demand signals, ticket pricing, showtime availability, theater coverage, and audience-related trends. The approach is especially useful in a market that continues to evolve following the dramatic disruption of 2020.
U.S. and Canadian ticket sales fell to 231.6 million in 2020 before recovering to 769.2 million in 2025, still below the 1.2297 billion tickets recorded in 2019. These figures demonstrate why current marketplace data needs historical context.
Fandango's platform provides movie and theater discovery, showtime information, ticketing, location-based search, and access across more than 26,000 screens nationwide. Extracting permitted public marketplace observations and preserving them historically can help businesses identify pricing patterns, competitive supply changes, geographic differences, and emerging entertainment trends.
The most effective strategy combines listing data with verified market statistics, internal business data, and other entertainment datasets. This prevents analysts from confusing marketplace availability with actual consumer demand.
Build a scalable entertainment intelligence pipeline with Real Data API and turn structured movie, theater, pricing, and showtime data into actionable market insights!
Latest posts
How A Flipkart Scraper For Product Data Extraction Tracks Product Reviews, Ratings, Prices, And Availability
How Amazon API for real-time ecommerce data Solves Pricing, Availability, and Competitor Monitoring Challenges?
How to Track Prices, Products, and Competitors with Meesho Data Scraping for Ecommerce Market Intelligence?

Indiamart Data Extraction For B2B Market Intelligence - Track Products, Competitors, And B2B Pricing Trends






.png)



