
Quick Summary
- Fashion Product Data Extraction for Retail Analytics helps fashion brands, online retailers, and marketplace sellers organize product prices, discounts, sizes, colors, stock status, and category information to understand competition and changing demand.
- Structured product information supports pricing comparisons, assortment planning, trend analysis, and inventory decisions across online channels.
- From 2020 to 2026, online shopping behavior and margin pressures have made timely, well-validated product intelligence increasingly valuable for retail teams.
Introduction
Fashion Product Data Extraction for Retail Analytics helps retailers turn online product listings into structured information they can use to compare prices, understand product availability, identify emerging styles, and evaluate competitor strategies. By collecting permitted, publicly available product details and organizing them consistently, fashion businesses can make more informed decisions about pricing, merchandising, and inventory.
Fashion retailers compete in a fast-moving environment. A product's price can change during a promotion, popular sizes can sell out, and competing brands can introduce similar designs within a short period. Manually checking multiple websites makes it difficult to maintain a reliable, up-to-date view of the market. Automated collection can reduce repetitive research and provide a consistent record of what was observed, where it appeared, and when it was captured.
A Web Scraping API can help deliver structured product information to databases, reporting tools, and analytics workflows. Depending on the source and permitted access, useful fields may include product names, brands, categories, prices, discounts, sizes, colors, availability, ratings, and product URLs.
The greatest value comes from turning these records into decisions. Retail teams can compare like-for-like products, monitor promotion patterns, identify assortment gaps, and review inventory signals before adjusting their strategies. Data quality remains essential: duplicate listings, unavailable sizes, inconsistent currencies, and stale prices can distort analysis. Retailers should also distinguish advertised prices from actual selling prices and avoid treating product availability as proof of demand.
This guide explains how fashion retailers can build a practical product-intelligence workflow, use real-world industry statistics, and translate online product information into actionable insights from 2020 through 2026.
How can retailers compare fashion products and competitor prices more accurately?
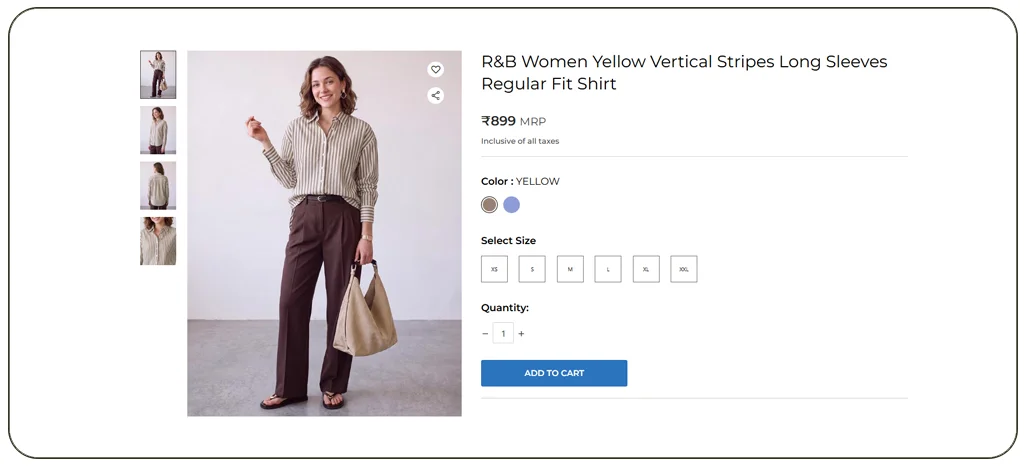
Fashion retailers need comparable information to determine whether their products are competitively priced. fashion product data web scraping helps collect listing details from relevant online stores and marketplaces so teams can compare similar products across brands, categories, and price ranges.
For a meaningful comparison, retailers should normalize product attributes before calculating price differences. A basic cotton T-shirt should not be compared directly with a premium designer garment simply because both are listed under the same broad category. Brand positioning, fabric, fit, product quality, and product specifications can all influence the price.
Fashion Product Data Extraction for Retail Analytics supports this process by organizing fields such as product title, brand, category, material, color, size, original price, promotional price, and availability. With consistent records, a retailer can identify products priced above or below a relevant competitor set and investigate whether the difference reflects a promotion, a premium product feature, or a possible pricing issue.
Which product fields matter most for comparison?
| Data field | Retail use | Quality check |
|---|---|---|
| Product name and identifier | Match comparable products | Normalize spelling and retain source IDs |
| Brand and category | Compare similar market segments | Standardize brand and category names |
| Regular and sale price | Measure discounts and price positioning | Validate currency and promotion conditions |
| Size and color | Compare variant-level availability | Keep variant data separate from parent products |
| Material and product attributes | Improve like-for-like comparisons | Flag missing or inconsistent specifications |
| Listing URL and capture date | Verify records and trace changes | Preserve source and timestamp |
What do real industry figures tell retailers?
Eurostat reported that 70% of EU online shoppers who had purchased online in the previous three months bought clothes, shoes, or accessories in 2023. In 2024, clothing—including sportswear—shoes, and accessories remained the most frequently purchased online product category, bought by 45% of individuals in the EU. The figures use different measures and time windows, so they should not be interpreted as a direct year-on-year change in fashion demand.
| Year | Real-world data point | Implication for product intelligence |
|---|---|---|
| 2020 | Pandemic restrictions accelerated the shift toward digital shopping in many markets | Capture online assortments and prices consistently |
| 2021 | Online channels remained important as shopping behavior evolved | Compare promotions across digital competitors |
| 2022 | Inflation and changing consumer spending increased pressure on value and margins | Monitor price points and discount depth |
| 2023 | 70% of recent EU online shoppers purchased clothing, shoes, or accessories | Prioritize relevant product categories |
| 2024 | 45% of EU individuals bought clothing, including sportswear, shoes, or accessories online in the previous three months | Review category-level assortment and competition |
| 2025 | McKinsey and The Business of Fashion described a price-sensitive consumer environment and continued pressure on industry growth | Evaluate value positioning and inventory exposure |
| 2026 | Full-year outcomes are not yet available as of October 2026 | Use dated, market-specific observations rather than assuming a completed annual trend |
Sources: Eurostat and McKinsey/Business of Fashion. The 2020–2022 entries are contextual summaries, not a numerical time series. The 2026 entry is a reporting-status note, not a market statistic.
Retailers should use these broad indicators as context, then examine their own product categories, target countries, and customer segments. National or regional shopping statistics do not automatically predict the performance of a specific brand or item.
How can online product listings reveal changing fashion trends?
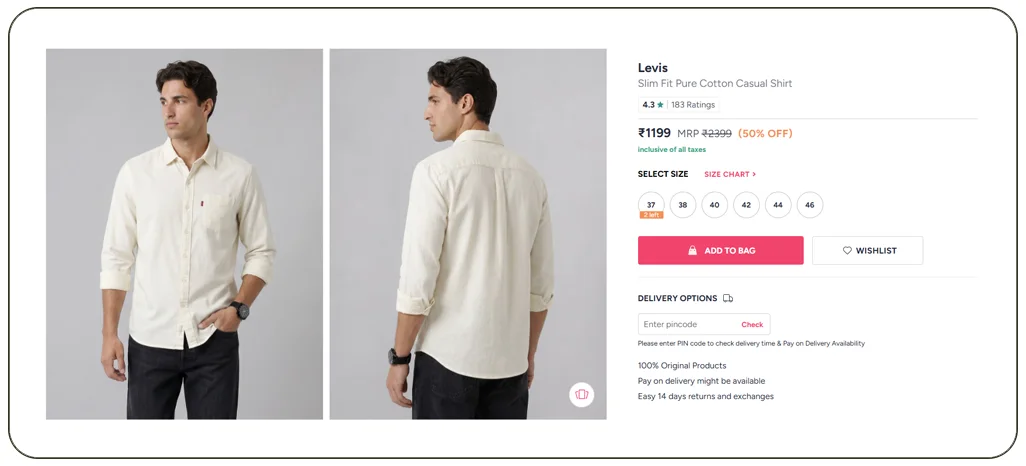
Retail teams can scrape fashion retail data to monitor the products competitors introduce, the styles they emphasize, and the categories receiving greater promotional attention. Product listings provide useful signals, including new arrivals, color ranges, material descriptions, displayed prices, discount labels, and size availability.
A trend-monitoring workflow should combine several observations instead of drawing conclusions from one product page. For example, the appearance of more linen garments across multiple retailers may justify investigating whether the category is receiving increased attention. It does not, by itself, prove that consumer demand or sales have increased. Sales records, search interest, sell-through information, and other reliable indicators are needed to confirm the trend.
What signals should a fashion trend dashboard track?
- New product introductions: Count newly observed items by category, brand, and period.
- Style and attribute frequency: Track descriptions such as oversized, relaxed fit, linen, recycled fabric, or wide-leg.
- Color and size availability: Record which variants are displayed as available or unavailable.
- Promotional activity: Compare the frequency and depth of advertised discounts.
- Assortment breadth: Measure how many relevant product types or variants competitors list.
- Product lifecycle changes: Track when listings first appear, change, or disappear.
A good dashboard distinguishes observed facts from interpretations. "The number of listings tagged as linen increased in the monitored sample" is a measurable statement. "Consumers now prefer linen" is a broader claim that needs additional evidence.
How should retailers interpret changes from 2020 to 2026?
The period offers several useful research phases: the rapid shift toward online shopping around 2020–2021, subsequent pressure on household budgets and retail margins, and more recent attention to inventory management, product discovery, and technology-enabled planning. McKinsey and The Business of Fashion's State of Fashion 2025 report highlighted low-single-digit industry revenue growth expectations, price-sensitive consumers, and the need to improve inventory planning.
For 2026 analysis, teams should use current observations with clear capture dates and compare them with compatible historical records. If a retailer changed its source coverage, product taxonomy, or collection schedule, annotate the change rather than interpreting a larger dataset as a sudden trend.
The practical outcome is a repeatable trend-review process: detect a signal, check it across multiple sources, compare it with historical observations, and validate it with sales or customer data before changing the assortment.
How can retailers respond faster to competitor price changes?
real-time fashion pricing data can help retailers detect observed price changes sooner and review whether their own prices remain aligned with their positioning. In practice, "real-time" should mean a clearly defined refresh interval that matches the business requirement. Many retail workflows use scheduled collection rather than continuous updates, and source availability can limit how quickly changes are detected.
Fashion Product Data Extraction for Retail Analytics enables a retailer to compare captured prices over time, monitor discount campaigns, and flag items that fall outside defined pricing rules. A retailer may, for example, receive an alert when a competitor's listed price for a comparable product drops below a set threshold. The team can then decide whether to respond, investigate the promotion, or maintain its current price based on margin and brand strategy.
Which metrics help make price monitoring actionable?
| Metric | Calculation or rule | Business application |
|---|---|---|
| Price difference | Retailer price minus competitor price | Identify price gaps |
| Price gap percentage | Price difference ÷ competitor price × 100 | Compare gaps across price levels |
| Discount depth | (Original price − sale price) ÷ original price × 100 | Review promotional intensity |
| Price-change frequency | Number of observed changes during a period | Identify frequently repriced products |
| Price position | Rank within a comparable product group | Understand relative market position |
| Monitoring freshness | Time since the latest successful capture | Identify potentially stale comparisons |
Retailers should verify that prices are comparable. A competitor's displayed discount may require a membership, coupon, or minimum purchase. Shipping costs, taxes, seller identity, and product variants can also affect the final price. These details should be captured when available and relevant.
What does a practical pricing workflow look like?
- Select a defined group of products and competitors.
- Collect prices and promotional details on a documented schedule.
- Normalize currencies and match comparable variants.
- Flag meaningful price changes or rule violations.
- Validate the source listing before acting.
- Review margin, inventory, brand positioning, and promotion strategy before changing a price.
Automated alerts should support human decisions rather than change prices without safeguards. Retailers should set minimum-margin rules, exclude unsuitable comparisons, and maintain a record of the evidence behind pricing decisions.
Build a clearer view of competitor pricing with a monitoring workflow tailored to your categories, target retailers, and refresh requirements!
Get Insights Now!How can structured product feeds improve retail analytics?
A fashion product data API can provide a standardized way to deliver product records to internal databases, dashboards, and reporting systems. Instead of manually copying listing details into spreadsheets, retail teams can integrate structured information into existing workflows, provided the source and provider support the required fields and permitted access.
A useful feed may contain product identifiers, titles, brand names, category labels, prices, promotional prices, sizes, colors, availability indicators, ratings, and source URLs. The exact fields depend on the website, marketplace, product type, and access method. Retailers should confirm field coverage, refresh frequency, historical retention, and data-delivery format before implementation.
What should a retail data pipeline include?
| Pipeline stage | Main responsibility | Recommended control |
|---|---|---|
| Source selection | Identify relevant stores and marketplaces | Document source coverage and permitted use |
| Collection | Capture accessible product information | Log failures and timestamps |
| Normalization | Standardize categories, currencies, and attributes | Apply consistent mapping rules |
| Product matching | Identify comparable products across sellers | Use product IDs and normalized attributes |
| Validation | Check prices, variants, and missing fields | Flag outliers and incomplete records |
| Integration | Send data to analytics systems | Validate schema and delivery status |
| Reporting | Present trends and competitive signals | Show source, capture time, and caveats |
A common problem is inconsistent product identity. The same item might be named differently across marketplaces, while color or size variants may appear as separate pages. Matching should therefore consider identifiers when available, plus brand, model, category, attributes, and variant details. Uncertain matches should be flagged for review instead of automatically merged.
What should teams measure during the 2020–2026 period?
Fashion businesses can build a historical dataset from permitted archived records, licensed sources, or snapshots collected consistently over time. The aim is to compare like with like. If a business only began tracking a category in 2023, it should not claim complete historical coverage from 2020 without reliable source records.
For 2025, industry reporting emphasized inventory challenges and the use of technology to improve planning. McKinsey and The Business of Fashion estimated that the industry produced between 2.5 billion and 5 billion items of excess stock in 2023, with an estimated sales value of $70 billion to $140 billion. This is a global industry estimate, not a measure of losses for an individual retailer.
For 2026, teams should prioritize current product coverage, reliable change histories, and clear quality indicators. Useful measures include percentage of required fields populated, duplicate rate, capture freshness, product-match confidence, and the share of monitored listings that can be verified at source.
How can ongoing monitoring support assortment and inventory decisions?
Fashion Data Scraping helps retailers maintain an ongoing view of competitor assortments, product availability, and promotional activity. A single product snapshot can show which items are listed at a given moment. Repeated snapshots make it possible to observe whether a product's price changes, a size disappears from a listing, or a competitor introduces new styles.
These signals are particularly useful for merchandising and planning teams that need to balance breadth of assortment with inventory risk. If several competitors expand a category, a retailer can investigate whether the change reflects seasonality, a campaign, or a longer-term shift. If a popular size is repeatedly unavailable, that observation can trigger a stock check—but it does not prove the item sold out because of strong demand. Listings can be unavailable for other reasons, including regional restrictions or page errors.
Fashion Product Data Extraction for Retail Analytics helps connect these observations with internal sales and inventory information. When external listing data is matched with the retailer's own sell-through, returns, and stock records, the team can make better-supported decisions about replenishment, promotions, and product selection.
Which assortment signals are worth tracking?
| Signal | What the retailer observes | Next step |
|---|---|---|
| New arrivals | Additional products appear in a monitored category | Review assortment gaps and product positioning |
| Variant availability | Listed sizes or colors change status | Validate with stock and sales information |
| Repeated markdowns | Similar products receive multiple price reductions | Review competitive pressure and seasonality |
| Category expansion | More product types appear across competitors | Investigate demand using internal sales data |
| Listing removal | A product disappears from a monitored source | Verify whether it was removed, sold, or moved |
| Attribute shifts | Product descriptions show different materials or styles | Compare with buying plans and customer feedback |
What lessons do industry trends offer?
The 2020–2021 period demonstrated the importance of adapting to rapid channel changes. From 2022 onward, cost pressures and changing consumer spending made pricing and inventory decisions more challenging. In its 2025 industry report, McKinsey highlighted inventory excellence as a key priority, noting that excess stock and stockouts both affect fashion businesses.
Retailers can use these lessons to establish category-specific monitoring. Track seasonal products against previous equivalent periods rather than comparing a winter assortment with summer listings. Document changes in source coverage and preserve historical values so teams can distinguish a genuine assortment shift from a data-collection change.
External listing signals should always be considered alongside internal sales, returns, stock levels, and buying commitments. That combination makes it easier to decide which products need replenishment, which promotions need review, and which assortment gaps deserve further investigation.
How can organized product information make reporting more reliable?
Fashion Datasets are most valuable when they are structured around clear business questions. A dataset intended for competitor price tracking needs accurate prices, currencies, product matches, and timestamps. A dataset intended for trend analysis needs consistent categories and attributes. A dataset intended for assortment planning may need variant availability and product lifecycle information.
Collecting a large number of fields without defining their purpose can increase processing costs and make quality problems harder to identify. Retail teams should start with a minimum viable schema, test it against real product pages, and expand it only when new fields support a defined decision.
What should a reliable product dataset contain?
- Product identity: Product ID where available, title, brand, category, and product URL.
- Variant details: Size, color, material, style, and other available specifications.
- Commercial information: Regular price, displayed sale price, currency, discount label, and seller.
- Availability information: Captured stock or availability status, with the time observed.
- Provenance: Source name, source URL, capture timestamp, and collection status.
- Quality indicators: Missing-field flags, duplicate status, normalization results, and match confidence.
How should data quality be managed through 2026?
| Quality check | Example method | Why it matters |
|---|---|---|
| Completeness | Measure populated critical fields | Prevents incomplete comparisons |
| Consistency | Standardize currencies, units, and categories | Supports cross-store analysis |
| Duplicate detection | Compare identifiers and normalized attributes | Avoids inflated assortment counts |
| Price validation | Flag zero, negative, or unexpected values | Catches extraction errors |
| Freshness | Record the latest successful capture | Reveals stale records |
| Traceability | Retain source and timestamp | Makes results easier to verify |
Historical analysis requires particular care. A price collected today does not prove what the product cost last month. To measure changes reliably, preserve dated snapshots and record the method used to match products over time. If a source changes its layout or product identifiers, note the change and reassess match quality.
Retailers should also collect only information they are permitted to use, follow applicable website terms and laws, respect access restrictions, and apply appropriate retention and security controls. Personal information should not be collected unless it is necessary and lawfully permitted.
A well-managed dataset makes analysis repeatable, helps analysts explain how a result was produced, and gives decision-makers more confidence in the evidence behind pricing and merchandising recommendations.
Why choose Real Data API for fashion retail intelligence?
Fashion retailers need product information that fits their market, category, and decision-making process. A practical data solution should focus on accurate collection, consistent formatting, traceable sources, and delivery that supports the retailer's existing analytics systems.
When evaluating a provider or implementation partner, consider these criteria:
- Relevant source coverage: Confirm that the required fashion stores, marketplaces, regions, and product categories are supported.
- Consistent product attributes: Check whether prices, discounts, variants, and categories can be normalized across sources.
- Historical tracking: Determine whether dated records are available for price comparisons and assortment analysis.
- Quality monitoring: Ask how duplicate products, missing fields, stale records, and extraction failures are detected.
- Flexible integration: Verify that the output format fits your databases, dashboards, and reporting workflows.
- Responsible collection: Review access permissions, source terms, privacy safeguards, and data-retention requirements.
How can retailers evaluate a competitive analysis workflow?
Scrape Fashion Products API for Competitive Analysis is a useful target workflow for businesses that want to compare competitor assortments, track price changes, and organize product-level market intelligence. Before scaling, retailers should run a pilot across a small set of products and sources, then assess coverage, match accuracy, freshness, and usefulness to actual business decisions.
Real Data API can be evaluated against these requirements to determine whether its data capabilities fit a retailer's research objectives. Start with a clearly defined use case, such as monitoring sale prices across selected brands or comparing product availability within a specific category. Agree on measurable acceptance criteria before expanding the scope.
Conclusion
Fashion retailers can make better-informed decisions when they combine consistent product records with clear analytical goals. Structured information helps teams compare competitor prices, evaluate discounts, observe assortment changes, and investigate emerging styles across online channels.
The 2020–2026 period reinforces the importance of adapting to changing shopping behavior, margin pressure, and inventory challenges. However, industry-wide statistics provide context rather than guarantees. Retailers should validate local market signals, compare equivalent products, and combine external observations with internal sales, stock, and customer data.
The strongest approach is to collect only relevant information, normalize product attributes, preserve dated snapshots, and verify important changes before taking action. These practices help fashion businesses reduce manual research and build a more repeatable process for pricing, merchandising, and assortment planning.
Ready to improve your fashion market intelligence? Real Data API helps businesses turn online product information into structured data for retail analysis. Define the brands, product categories, and pricing signals that matter to your business, then explore a data solution that supports actionable insights and informed retail decisions.
FAQs
1. How does a Web Scraping API help fashion retailers?
A Web Scraping API can deliver structured product information from permitted sources, helping retailers automate collection, compare competitor listings, and integrate product intelligence into their reporting systems.
2. What information can fashion product data web scraping collect?
fashion product data web scraping can capture available product names, brands, categories, prices, discounts, sizes, colors, availability, and URLs to support structured fashion retail analysis.
3. Why should businesses scrape fashion retail data?
Businesses scrape fashion retail data to compare competitor assortments, monitor promotional activity, track product availability, identify market changes, and support better-informed pricing and merchandising decisions.
4. How can real-time fashion pricing data support pricing decisions?
real-time fashion pricing data can help retailers detect observed price changes, review competitor promotions, and assess price positioning, provided the data is fresh, comparable, and verified before action.
5. What should retailers look for in a fashion product data API?
A fashion product data API should provide relevant source coverage, consistent fields, reliable updates, traceable records, and integration options. Real Data API can be evaluated against these requirements and the retailer's specific goals.
Latest posts
How to Scrape Grocery Product Listing Data in 2026 Using Grocery Data Scraping to Improve Grocery Pricing and Inventory Decisions?

How Foodpanda data scraping for restaurant market research Improves Restaurant Listings, Discounts, and Menu Intelligence
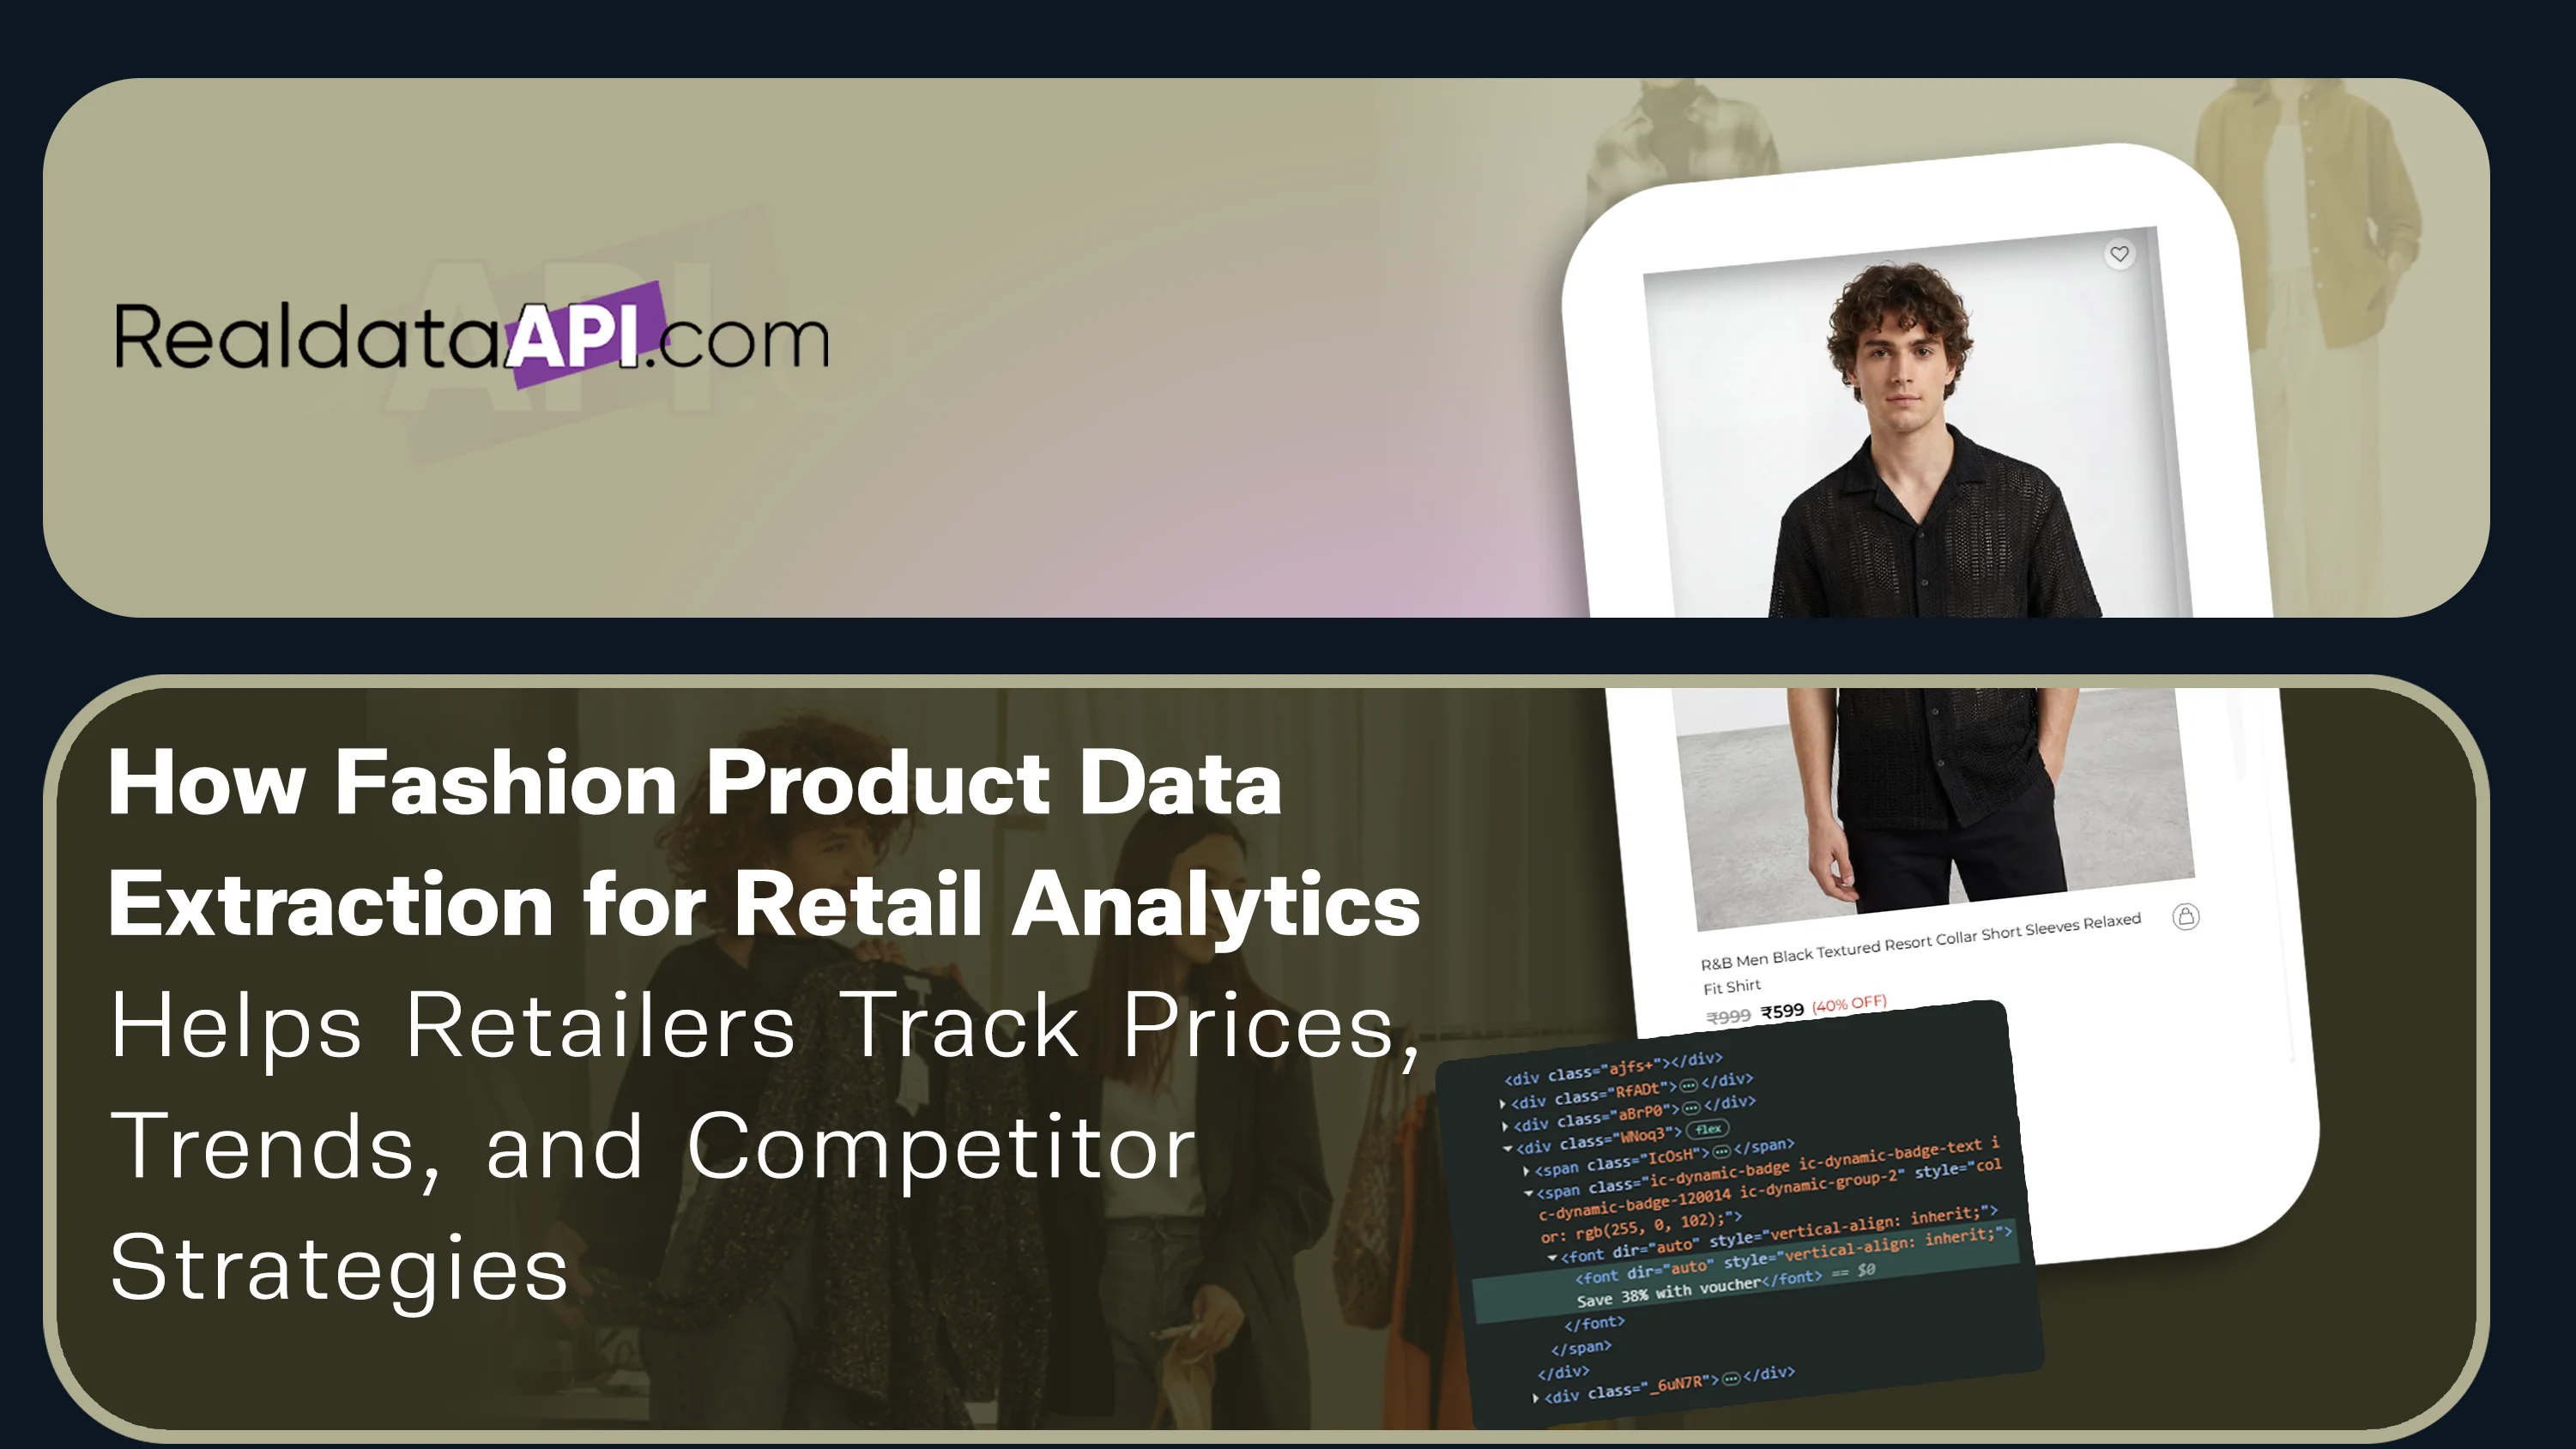
How Fashion Product Data Extraction for Retail Analytics Helps Retailers Track Prices, Trends, and Competitor Strategies
How OTT Data Scraping for Streaming Market Intelligence Helps Streaming Businesses Optimize Pricing, Content, and Market Strategy






.png)



