Quick Summary
- Foodpanda data scraping for restaurant market research helps restaurant chains, food brands, and delivery businesses understand local pricing, menu availability, customer-facing offers, and competitor positioning across delivery markets.
- Businesses that Scrape Foodpanda Menu and Prices can compare product rates, discount structures, restaurant listings, and menu variations to identify pricing gaps and improve promotional decisions.
- With structured marketplace data, companies can monitor changes from 2020 to 2026, develop evidence-based strategies, and strengthen their food delivery market intelligence.
Introduction
Food delivery platforms have transformed how consumers discover restaurants, compare dishes, evaluate discounts, and decide where to order. For restaurant chains, cloud kitchens, food aggregators, and market research companies, understanding these digital storefronts is essential for making informed commercial decisions. Foodpanda data scraping for restaurant market research enables businesses to examine publicly accessible restaurant listings, menu items, displayed prices, delivery fees, and promotional offers in a structured format.
Manual research often becomes inefficient when a business needs to monitor hundreds of restaurants across multiple neighborhoods. Prices change, new restaurants enter the market, menu items become unavailable, and promotional campaigns vary by location. Collecting consistent data helps research teams identify these changes without relying exclusively on occasional manual checks.
Businesses that Scrape Foodpanda Menu and Prices can build comparable datasets for pricing intelligence, menu optimization, and competitive benchmarking. These insights help decision-makers answer practical questions: Which cuisines are becoming more expensive? Which restaurants rely heavily on discounts? How does menu variety differ between neighborhoods? Which promotional strategies appear alongside competitive pricing?
Real Data API helps businesses approach these challenges through structured web data collection and extraction solutions. By converting accessible marketplace information into organized datasets, companies can develop repeatable research workflows, evaluate market conditions, and make decisions based on observed evidence rather than assumptions.
How Do Local Pricing Patterns Reveal Market Opportunities?
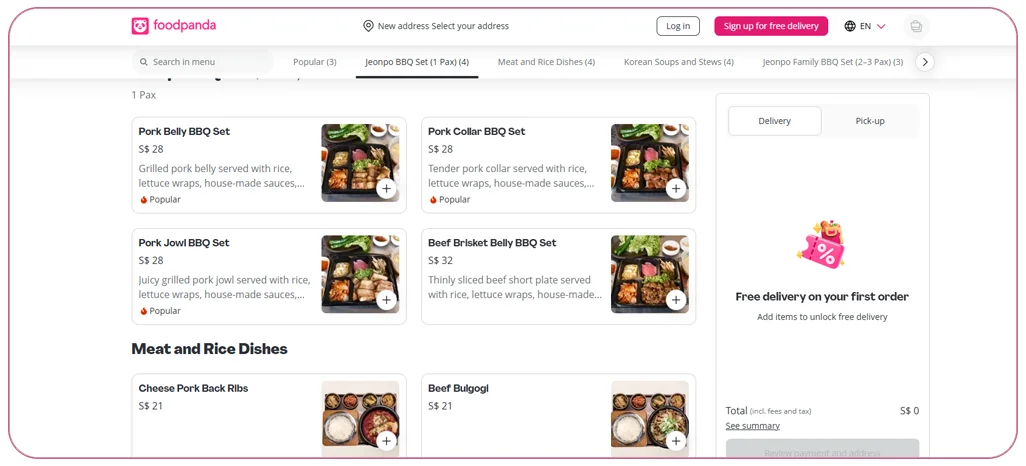
Food delivery pricing varies by city, neighborhood, cuisine, restaurant positioning, and promotional strategy. A burger sold by a premium restaurant may cost substantially more than a comparable item from a value-oriented outlet. Delivery charges, minimum-order requirements, packaging fees, and platform promotions can further affect the final amount paid by customers.
Analyzing Foodpanda menu price trends across local markets helps businesses understand these differences systematically. Researchers can group comparable menu items by cuisine, serving size, restaurant category, and geographic area. They can then compare median prices, price ranges, and changes over time instead of relying on isolated observations.
For example, a quick-service restaurant expanding into a new neighborhood could compare the displayed prices of similar meals across competing outlets. If its proposed price exceeds the local median, management can investigate whether portion size, brand positioning, ingredients, or delivery convenience justify the difference.
A structured approach to Foodpanda data scraping for restaurant market research can also support historical comparisons. From 2020 through 2026, food delivery markets have experienced changes in consumer ordering habits, digital adoption, inflationary pressures, and promotional competition. However, the direction and magnitude of these changes differ by market and must be established using actual historical observations.
Which pricing indicators should businesses monitor?
| Indicator | What it measures | Business application |
|---|---|---|
| Median menu price | Typical listed price within a comparable category | Establish competitive price benchmarks |
| Price range | Difference between the lowest and highest observed prices | Identify budget and premium segments |
| Discount percentage | Advertised reduction against the stated reference price | Evaluate promotional intensity |
| Delivery fee | Displayed charge for delivery | Compare customer-facing costs |
| Price change | Difference between observations over time | Identify increases and reductions |
| Item availability | Whether a product appears available during collection | Track assortment changes |
Consider the following example. These figures are hypothetical and demonstrate a calculation method; they are not verified Foodpanda market statistics.
| Year | Median meal price | Annual change |
|---|---|---|
| 2020 | ₹180 | Baseline |
| 2021 | ₹185 | 2.8% |
| 2022 | ₹195 | 5.4% |
| 2023 | ₹205 | 5.1% |
| 2024 | ₹215 | 4.9% |
| 2025 | ₹225 | 4.7% |
| 2026 | ₹235 | 4.4% |
This example illustrates how a research team might calculate year-over-year price movements. Actual comparisons require consistent item definitions, comparable locations, reliable timestamps, and historical records. Current listings alone cannot establish what prices were in previous years.
Restaurants can use these insights to adjust menu prices, review product bundles, identify underserved price segments, and avoid competing exclusively through discounts. The objective is to understand the market context behind a price rather than simply copy a competitor's displayed rate.
How Can Structured Delivery Data Improve Analytical Decisions?
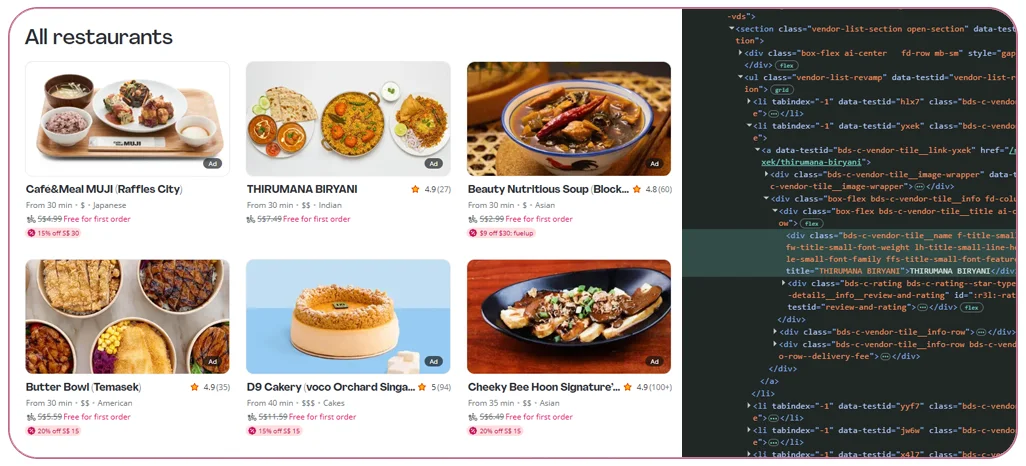
Food delivery businesses need more than individual menu snapshots. They require organized, consistent records that connect restaurants, products, locations, prices, promotional details, and collection timestamps. A structured analytical workflow makes this information easier to compare across markets and reporting periods.
A Foodpanda API for food delivery analytics can serve as a useful concept for teams seeking programmatic access to marketplace information. However, access methods matter: a public-facing delivery platform should not be assumed to provide an unrestricted official API for every dataset. Depending on available permissions and technical arrangements, businesses may use authorized APIs, permitted web extraction, licensed datasets, or other approved collection methods.
Once collected, the data should be normalized into a consistent schema. Restaurant names may use different spellings, menu descriptions may contain inconsistent formatting, and the same dish may appear under different category labels. Standardization helps analysts avoid treating duplicate records as separate products or comparing fundamentally different meals.
What should an analytical dataset contain?
| Field | Purpose | Example |
|---|---|---|
| Restaurant identifier | Distinguishes individual outlets | RST-1042 |
| Restaurant name | Identifies the storefront | Example Kitchen |
| Location | Supports geographic comparisons | Central district |
| Cuisine category | Groups similar businesses | Indian |
| Menu item | Identifies the product | Paneer wrap |
| Listed price | Records the displayed amount | ₹220 |
| Discount details | Captures advertised promotions | 15% off |
| Availability | Records observed status | Available |
| Timestamp | Establishes when information was collected | 2026-06-15 12:00 |
| Source reference | Supports verification and traceability | Permitted listing URL |
A consistent dataset helps businesses answer questions at several levels. Operations teams can identify missing or inconsistent listing information. Marketing teams can evaluate the positioning of promotional offers. Category managers can compare menu breadth, while analysts can identify price differences across locations.
The 2020–2026 period can be especially useful for longitudinal analysis when valid historical data is available. Researchers should distinguish between observed values, estimated values, and missing records rather than filling historical gaps with assumptions.
Useful analytical outputs include category-level median prices, restaurant counts by cuisine, the percentage of listings advertising discounts, menu availability rates, and the frequency of observed price changes. Each metric should have a clear definition so that reports remain comparable between collection cycles.
The strongest workflows also include quality checks. These can flag unusually large price changes, duplicate menu entries, missing currency symbols, and inconsistent discount calculations. Analysts should preserve the original collected values alongside normalized fields, making it easier to audit discrepancies and explain results to business stakeholders.
How Does Competitor Monitoring Support Smarter Promotions?
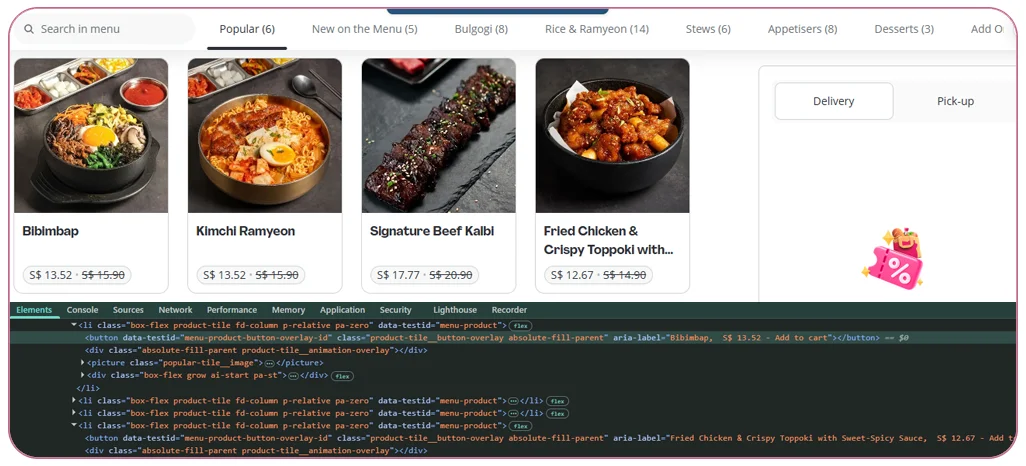
Restaurants compete on multiple dimensions, including menu variety, price, delivery convenience, product descriptions, ratings where available, and promotional visibility. A restaurant with higher prices may still attract customers through larger portions or distinctive dishes, while a lower-priced competitor may rely on frequent promotional campaigns.
Real-time Foodpanda competitor analysis helps businesses observe these differences through repeated, timestamped collection of accessible listing information. The term real-time should reflect the actual collection frequency. A system that checks listings every few hours provides periodic monitoring, not continuous second-by-second visibility.
Combining these observations with Foodpanda data scraping for restaurant market research enables teams to compare their positioning against relevant competitors. Rather than monitoring every restaurant indiscriminately, businesses can define a competitor set based on cuisine, location, price range, and customer segment.
For instance, a cloud kitchen specializing in biryani could monitor comparable outlets within its delivery radius. It might track the listed prices of regular and family portions, the number of available meal combinations, advertised discounts, and changes in product availability. The resulting analysis can reveal where its assortment is narrower or where its pricing differs from comparable offerings.
Which competitive indicators matter most?
| Metric | How to interpret it | Recommended response |
|---|---|---|
| Discount frequency | How often a listing displays a promotion during observed checks | Review campaign timing and profitability |
| Menu breadth | Number of distinct available items | Identify assortment gaps |
| Price positioning | Price relative to comparable products | Review value proposition |
| Bundle availability | Presence of meal combinations or family packs | Evaluate bundle opportunities |
| Listing completeness | Presence of relevant menu descriptions and details | Improve customer-facing information |
| Availability changes | Changes in observed item status | Investigate potential operational issues |
The following example illustrates a hypothetical competitive comparison. It is not an actual measurement of Foodpanda restaurants.
| Metric | Restaurant A | Restaurant B | Restaurant C |
|---|---|---|---|
| Comparable meal price | ₹240 | ₹220 | ₹260 |
| Advertised discount | 10% | 15% | 5% |
| Available menu items | 42 | 55 | 38 |
| Meal bundles | 6 | 9 | 4 |
These observations suggest different positioning strategies, but they do not prove which restaurant performs best. Sales volume, order conversion, profit margins, customer retention, and operational capacity require separate evidence.
Restaurants should also evaluate discounts carefully. A higher advertised discount may improve visibility or customer appeal, but it can reduce contribution margins if the underlying price and cost structure are unfavorable. Teams should calculate promotional profitability using their own costs rather than assuming the most aggressive competitor is the most successful.
Want to turn restaurant marketplace observations into actionable competitive intelligence? Explore Real Data API's data collection solutions to plan a structured, market-specific research workflow!
Get Insights Now!How Can Better Listing Data Improve Restaurant Visibility?
Restaurant listings influence how consumers discover and evaluate dining options. Clear names, accurate menu descriptions, appropriate categories, correct prices, and consistent availability information help customers understand what an outlet offers before placing an order.
Foodpanda restaurant listing data collection allows businesses to evaluate these elements across a defined group of restaurants. Researchers can identify missing descriptions, inconsistent item naming, incomplete categories, and differences between comparable storefronts. These observations help restaurant operators prioritize improvements to their own authorized listings.
Listing research is particularly useful for restaurant chains operating across multiple locations. Different outlets may offer different menu combinations, display different prices, or maintain inconsistent descriptions for similar products. A standardized dataset makes these variations easier to detect.
What should a listing quality audit include?
| Audit dimension | Data to inspect | Potential improvement |
|---|---|---|
| Restaurant identity | Name and outlet information | Standardize brand presentation |
| Menu descriptions | Item names and descriptions | Improve clarity and consistency |
| Categorization | Cuisine and menu categories | Make products easier to classify |
| Price accuracy | Displayed price compared with approved internal price | Investigate discrepancies |
| Availability | Observed item status | Update authorized menus when needed |
| Promotional details | Displayed offer and applicable conditions | Clarify campaign terms |
| Image presence | Whether relevant product imagery is displayed | Improve visual completeness |
An effective audit begins with a baseline. Researchers record the available listing fields, define a completeness score, and compare results across outlets or collection dates. A simple score might measure the percentage of required fields populated, provided that the required fields are defined consistently.
For example, a chain could require every listed product to have a standardized name, price, category, and availability field in its internal reference dataset. Researchers could then compare those records with accessible platform listings and flag differences for review. The platform's displayed information should be treated as an observation, not automatically as the definitive internal price or inventory record.
From 2020 to 2026, businesses may also want to examine how listing formats and menu presentation have evolved. This requires archived observations or licensed historical records. A present-day snapshot cannot reliably reconstruct past descriptions, removed items, or historical promotional conditions.
The business value lies in identifying specific corrections. Instead of producing a broad report stating that listings need improvement, a useful audit identifies the affected outlet, field, observed value, expected value, timestamp, and recommended action. This gives marketing and operations teams a practical list of issues to resolve.
Listing data can also support expansion decisions. If a business is evaluating a new neighborhood, restaurant counts and menu categories can help describe the competitive landscape. These figures should be interpreted alongside population characteristics, delivery coverage, customer demand, and operational costs rather than used as standalone measures of market attractiveness.
How Does Automated Collection Make Menu Intelligence More Reliable?
Manual marketplace research is manageable when a team tracks a handful of restaurants. It becomes harder when analysts need to monitor hundreds of outlets, compare multiple cities, or repeat the same checks throughout the week. Automated extraction can reduce repetitive work and produce more consistent records when the collection process is designed carefully.
A Foodpanda Scraper is a data extraction workflow or tool configured to capture permitted information from accessible platform pages or other authorized sources. Depending on the source and technical setup, collected fields may include restaurant names, menu categories, product descriptions, displayed prices, promotional information, availability indicators, and timestamps.
When combined with Foodpanda data scraping for restaurant market research, automated collection supports recurring reports instead of one-off spreadsheets. Analysts can schedule checks, standardize output fields, validate records, and compare observations across reporting periods.
How should businesses organize the process?
- Define the research objective. Specify whether the project focuses on pricing, promotional activity, listing quality, menu breadth, or geographic competition.
- Choose a representative sample. Select restaurants by location, cuisine, price range, and business model.
- Establish permitted data access. Review applicable platform terms, access restrictions, privacy obligations, and licensing requirements before collection.
- Standardize the schema. Use consistent fields for restaurant identity, item details, currency, price, discount, availability, and timestamp.
- Validate incoming records. Detect duplicates, missing values, malformed prices, and implausible changes.
- Store historical observations. Preserve dated snapshots so that genuine changes can be distinguished from isolated collection errors.
- Generate actionable reports. Deliver findings to pricing, marketing, category management, and operations teams.
Automation also introduces challenges. Platforms may change page structures, restrict access, alter location-specific results, or display personalized offers. Collection failures can produce incomplete datasets, while aggressive collection frequencies can create unnecessary technical load or violate access restrictions. Responsible workflows should respect access controls and use appropriate collection intervals.
Businesses should measure the reliability of their data pipeline through indicators such as successful collection rate, record completeness, duplicate rate, validation failure rate, and time between observation and reporting. These operational metrics are important because a large dataset is not necessarily a reliable dataset.
The following table provides targets for designing an internal quality framework. These are suggested starting points, not independently verified industry benchmarks.
| Quality indicator | Target | Why it matters |
|---|---|---|
| Required-field completeness | At least 98% | Reduces missing analytical values |
| Duplicate records | Below 1% | Prevents inflated item counts |
| Successful scheduled runs | At least 95% | Supports dependable reporting |
| Timestamp coverage | 100% of observations | Enables chronological analysis |
| Critical price validation | 100% of flagged records reviewed | Reduces pricing errors |
Targets should be adapted to the source, business requirements, and risk tolerance. For example, a research report that informs a major pricing decision may require manual verification of every unusual price change, whereas a broad market scan may use sampling and automated anomaly detection.
The most useful outcome is not merely faster collection. It is a repeatable process that makes it easier to understand what changed, where it changed, and whether the observation is sufficiently reliable to inform a commercial decision.
How Can Historical Records Reveal Longer-Term Market Shifts?
A historical dataset can help researchers distinguish short-lived promotional activity from persistent changes in restaurant pricing, menu variety, and competitive positioning. However, historical analysis depends on the availability and quality of dated observations. Records collected today cannot independently establish conditions in 2020 or any other earlier period.
A FoodPanda Dataset can be organized around restaurant identifiers, geographic attributes, menu item identifiers, displayed prices, promotional fields, availability status, and observation timestamps. Historical records can then be aggregated by month, quarter, or year, depending on the frequency and completeness of the data.
For the 2020–2026 period, researchers may investigate several questions: Did comparable menu prices rise faster in one neighborhood than another? Did restaurants add more meal bundles? Did promotional activity become more frequent during certain months? Were some menu categories more stable than others?
These are research questions, not predetermined findings. The answers should emerge from actual records and should account for changes in platform coverage, restaurant participation, and data collection methods.
Which historical metrics are most informative?
| Metric | Calculation approach | Strategic value |
|---|---|---|
| Median price movement | Compare category medians across periods | Identify broad pricing changes |
| Menu turnover | Count items added and removed between snapshots | Evaluate assortment changes |
| Discount prevalence | Share of observed listings displaying discounts | Compare promotional intensity |
| Restaurant entry and exit | Track outlets appearing or disappearing from the observed sample | Describe marketplace changes |
| Price volatility | Measure variation in comparable item prices | Identify unstable pricing categories |
| Data coverage | Track the number of restaurants and observations available | Assess whether comparisons remain representative |
Consider a hypothetical historical study of 100 restaurants. If only 60 restaurants have usable records in 2020 but 95 have records in 2026, a simple comparison of total menu items could be misleading. The later total might reflect broader coverage rather than genuine menu expansion.
Researchers can address this problem by maintaining a balanced panel of restaurants observed across all comparison periods, where possible. They can also report results for the full available sample separately, explain missing periods, and test whether conclusions change when the sample definition changes.
Price comparisons require similar care. Analysts should compare like-for-like products, account for portion sizes and product variants, and distinguish regular prices from promotional prices. Currency differences, tax treatment, delivery fees, and changes in product naming should be documented.
A historical dataset becomes more valuable when paired with internal business outcomes. A restaurant may compare observed competitor prices with its own order volume, campaign spending, average order value, or contribution margin. These additional variables can help management evaluate whether marketplace changes coincide with business performance. Correlation alone, however, does not prove that a competitor's discount caused a change in sales.
For decision-makers, the goal is a dependable evidence base. Historical analysis can help identify patterns, test pricing hypotheses, plan seasonal campaigns, and prioritize markets for further investigation. The reliability of every conclusion depends on transparent methodology, consistent definitions, and a clear distinction between observed facts and estimates.
Why Choose Real Data API?
Real Data API supports businesses seeking structured data collection and extraction solutions for market intelligence, competitive research, and commercial analytics. For food delivery research, the appropriate approach depends on the target platform, available access methods, geographic scope, required fields, and reporting frequency.
A well-designed data project should do more than return a large spreadsheet. It should produce records that analysts can validate, compare, and connect to business decisions. Clear schemas, repeatable collection procedures, historical storage, and data quality checks all contribute to more dependable analysis.
Businesses can evaluate a provider or solution against the following criteria:
- Relevant data fields: Confirm that the available collection method supports the restaurant, menu, pricing, and promotional fields required for the project.
- Geographic coverage: Establish which locations can be researched and how location-specific listings are handled.
- Data freshness: Agree on realistic collection intervals and timestamp requirements.
- Data quality: Define validation rules, duplicate handling, and procedures for investigating unexpected values.
- Scalability: Assess whether the workflow can accommodate additional restaurants, locations, or collection cycles.
- Compliance and access: Ensure that collection methods respect applicable terms, permissions, and legal requirements.
- Usable delivery formats: Choose structured outputs that fit the organization's reporting and analytical workflow.
The Foodpanda Food Dataset Helps Businesses Track marketplace changes by bringing comparable observations into a consistent analytical structure. Depending on the data available, teams can use these records to review restaurant listings, compare displayed prices, evaluate advertised promotions, and investigate changes in menu availability.
For restaurant groups, this can support menu governance and competitive benchmarking. For food brands, it can inform category research and product positioning. For analytics teams, it can provide a foundation for recurring reports and historical comparisons.
Real Data API is best evaluated against a defined business use case. Before starting a project, identify the target markets, required fields, intended decisions, collection frequency, and evidence needed to verify results. This makes it easier to determine whether the resulting dataset will address a real operational or commercial challenge.
Conclusion
Restaurant marketplace intelligence helps businesses understand how local competitors present their menus, price their products, and promote their offerings. Foodpanda data scraping for restaurant market research provides a structured approach to collecting and comparing accessible listing information, enabling restaurant operators, food brands, and analytics teams to make better-informed decisions.
From price benchmarking and listing audits to promotional monitoring and historical trend analysis, the greatest value comes from consistent observations supported by clear definitions and reliable timestamps. Businesses should distinguish actual marketplace measurements from examples, avoid drawing historical conclusions from current snapshots, and validate unusual changes before acting on them.
For companies evaluating new markets or refining existing restaurant strategies, the next step is to define a focused research project. Select the relevant locations, identify the competitor set, choose the necessary menu and pricing fields, and establish measurable data quality requirements.
Ready to turn food delivery marketplace data into actionable business intelligence? Contact Real Data API to discuss your data collection requirements and build a research workflow aligned with your pricing, listing, and menu intelligence goals!
FAQs
1. What is the purpose of marketplace research for restaurants?
Foodpanda data scraping for restaurant market research helps businesses compare accessible restaurant listings, menu prices, promotional offers, and product availability to identify competitive gaps and improve commercial planning.
2. How can businesses compare menu prices across locations?
Businesses can Scrape Foodpanda Menu and Prices from permitted sources, normalize comparable items, group observations by location, and calculate median prices, price ranges, and changes across reporting periods.
3. Can restaurants monitor competitor discounts automatically?
Yes. A permitted collection workflow can record advertised discounts and timestamps at scheduled intervals, helping teams compare promotional patterns without assuming that discounts directly indicate sales performance.
4. What information can a restaurant dataset contain?
A structured FoodPanda Dataset may include restaurant names, location details, menu categories, item descriptions, displayed prices, promotional information, availability indicators, and collection timestamps, subject to source access and permissions.
5. How can Real Data API support food delivery research?
Real Data API can help businesses explore suitable data extraction approaches, organize marketplace information, and develop repeatable research workflows for menu intelligence, competitive benchmarking, and pricing analysis.
Latest posts
How to Scrape Grocery Product Listing Data in 2026 Using Grocery Data Scraping to Improve Grocery Pricing and Inventory Decisions?
How Foodpanda data scraping for restaurant market research Improves Restaurant Listings, Discounts, and Menu Intelligence

How Fashion Product Data Extraction for Retail Analytics Helps Retailers Track Prices, Trends, and Competitor Strategies
How OTT Data Scraping for Streaming Market Intelligence Helps Streaming Businesses Optimize Pricing, Content, and Market Strategy







.png)



