Quick Summary
- OTT Data Scraping for Streaming Market Intelligence enables streaming businesses to monitor competitor pricing, content catalogs, availability, ratings, and market movements from publicly accessible digital sources.
- OTT Scraping API solutions help convert frequently changing streaming information into structured, analysis-ready data for pricing optimization, content planning, competitor benchmarking, and strategic decision-making.
- From 2020 to 2026, the streaming market has shifted toward multi-platform competition, ad-supported plans, live content, and data-led personalization, making continuous market monitoring increasingly important.
Introduction
OTT Data Scraping for Streaming Market Intelligence helps streaming businesses make faster decisions by transforming publicly available information about competitors, catalogs, pricing, genres, availability, ratings, and content changes into structured market intelligence. The core business question is simple: How can streaming companies understand what competitors offer, how they price it, and which content trends are gaining attention before those changes affect market position? Continuous data collection provides the visibility required to answer that question.
The need for this intelligence has increased as streaming has become a dominant part of television consumption. Nielsen reported that streaming represented 48.6% of total TV usage in May 2026, while YouTube accounted for 13.8% of TV watch-time among media distributors. In May 2025, streaming had already reached 44.8% of TV viewing, exceeding the combined 44.2% share of broadcast and cable for the first time in Nielsen's measurement history.
An OTT Scraping API can support this intelligence workflow by providing a structured mechanism for collecting frequently changing information at scale. Instead of relying on occasional manual checks, streaming businesses can establish recurring monitoring workflows covering content availability, subscription tiers, promotional offers, release activity, ratings, genres, and competitor movements.
For streaming executives, product managers, content acquisition teams, pricing analysts, and media researchers, the objective is not simply to collect more data. The objective is to convert changing OTT information into decisions about what to price, what to promote, what content to acquire, where to compete, and when to respond.
What Competitive Visibility Can Streaming Businesses Build?
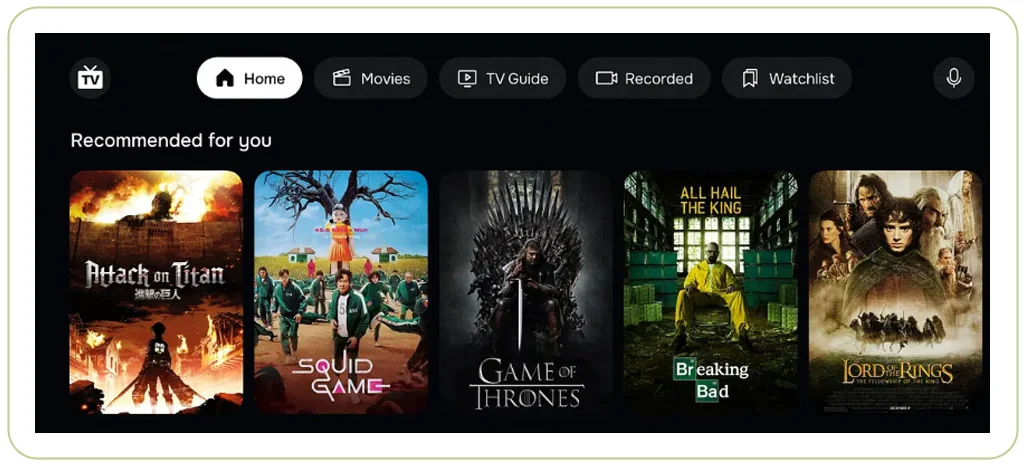
Streaming businesses increasingly need a structured view of the competitive environment. A competitor may introduce a cheaper ad-supported tier, remove popular titles, add live sports, change regional availability, or launch a bundle without making the significance of that change immediately obvious.
extract OTT competitor data supports a systematic approach to capturing those changes across selected streaming platforms, regions, categories, and time periods. Relevant fields can include platform name, title, genre, language, release year, content type, subscription plan, price, promotional offer, rating, availability, and URL.
The value becomes clearer when data is tracked historically rather than collected as a one-time snapshot.
| Market indicator | Real-world data point | Business implication |
|---|---|---|
| Streaming share of TV | 40.3% in June 2024 | Streaming became the largest measured TV viewing category at that point. |
| Streaming share of TV | 44.8% in May 2025 | Streaming surpassed combined broadcast and cable viewing in Nielsen's May measurement. |
| Streaming share of TV | 47.3% in July 2025 | Streaming approached half of all TV viewing. |
| Streaming share of TV | 48.6% in May 2026 | Streaming reached another record in Nielsen's Gauge reporting. |
The 2020-2026 period illustrates why historical competitive data matters. In 2020, streaming benefited from major changes in home entertainment consumption. By 2021, Nielsen had launched The Gauge to measure television and streaming consumption. In 2022 and 2023, streaming services increasingly experimented with pricing, advertising, bundles, and content strategies. By 2024, streaming represented more than 40% of TV usage during multiple monthly measurement periods. In 2025, it repeatedly approached or exceeded the mid-40% range. By 2026, streaming had reached 48.6% of total TV usage in May.
For a streaming business, this progression means competitor monitoring should not be treated as an occasional research project. A historical dataset can reveal whether competitors are consistently raising prices, expanding catalogs, reducing content availability, increasing ad-supported offerings, or concentrating on specific genres.
Business takeaway: Competitive visibility becomes more valuable when every observation can be compared with previous observations, market events, and competitor behavior.
How Can Catalog Changes Improve Content Decisions?
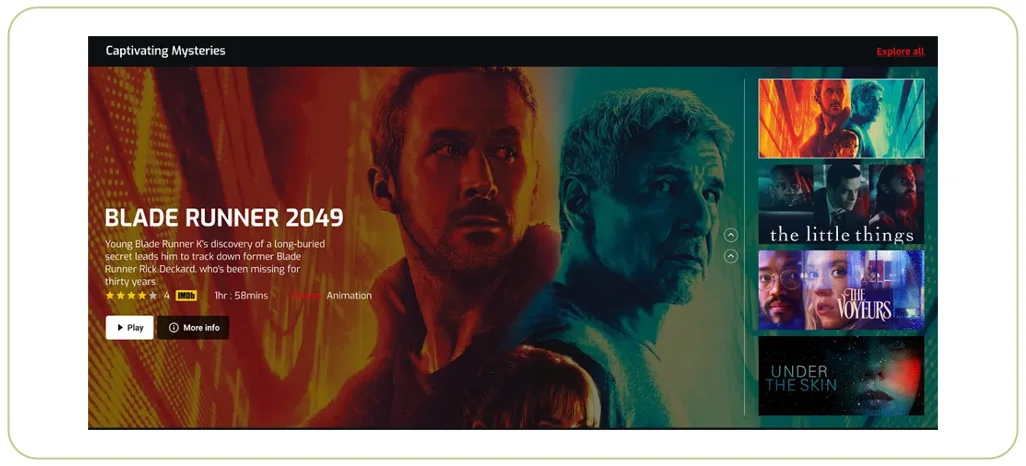
Content is one of the most visible competitive variables in streaming. A platform's catalog can change every week as new releases arrive, licensing agreements expire, originals launch, and regional rights change.
real-time OTT catalog data gives content and strategy teams a more current view of what is available across competing platforms. Instead of manually visiting multiple services, businesses can organize information by title, genre, language, release date, platform, country, content type, rating, and availability status.
This creates several practical use cases:
- Identify frequently appearing genres across competing platforms.
- Track newly added and removed titles.
- Compare original versus licensed content.
- Monitor regional catalog differences.
- Identify gaps in a competitor's content offering.
- Measure catalog expansion or contraction over time.
- Support content acquisition and licensing research.
- Build historical title-level availability records.
Nielsen's data shows how individual titles can generate enormous viewing volumes. In December 2025, Stranger Things generated more than 15 billion viewing minutes and became the month's most-watched streaming title. Earlier, Bridgerton generated 9.3 billion viewing minutes in June 2024, while Your Honor generated 7.5 billion minutes across Netflix and Paramount+.
These figures demonstrate why title-level intelligence matters. A streaming company does not only need to know that a competitor has thousands of titles. It needs to understand which types of titles are appearing, disappearing, gaining visibility, and potentially influencing audience demand.
From 2020 to 2026, catalog competition evolved from simply expanding libraries toward more differentiated strategies. In the early 2020s, platforms emphasized library scale and exclusive originals. By 2023-2024, pricing pressure, advertising, sports, bundles, and franchise content became increasingly important. In 2025, Nielsen reported that seven different streaming platforms supplied the most-watched streaming titles in March, demonstrating the breadth of competition. By 2026, major streaming services were competing across entertainment, sports, advertising, and cross-platform distribution.
Business takeaway: Catalog intelligence becomes strategically useful when content availability is connected with release timing, competitive gaps, audience signals, and commercial outcomes.
Why Is Continuous Competitive Monitoring Better Than Occasional Research?
OTT competitor data scraping provides a repeatable way to monitor changes across multiple platforms and markets. This matters because pricing and content decisions can become outdated quickly.
Consider a pricing team comparing five competitors on Monday. By Friday, one competitor could introduce a new ad-supported tier, another could change its monthly price, and a third could launch a bundle. A static spreadsheet would immediately become less reliable.
Recurring monitoring can capture:
| Monitoring area | Example fields | Strategic question |
|---|---|---|
| Pricing | Monthly price, annual price, tier | Is our price competitive? |
| Plans | Ad-free, ad-supported, premium | Which monetization models are expanding? |
| Content | Title, genre, language, release year | Where are competitors investing? |
| Availability | Country, region, plan | Which markets have catalog advantages? |
| Ratings | Rating, review count | Which titles demonstrate strong audience signals? |
| Promotions | Discount, trial, bundle | How aggressively are competitors acquiring users? |
The evolution from 2020 to 2026 makes continuous monitoring increasingly relevant. Streaming services moved from aggressive subscriber acquisition toward profitability, retention, advertising, bundling, and content efficiency. Deloitte's 2025 Digital Media Trends found that surveyed consumers reported paying an average of $69 per month for four paid streaming services, up from $61 the previous year. The same research found that 47% believed they were paying too much for streaming services, while 41% said the available SVOD content was not worth the price.
That creates a direct pricing challenge: businesses must balance subscription revenue against perceived value.
Build a continuously updated competitive intelligence pipeline to identify pricing changes, catalog movements, and market opportunities before they become strategic blind spots!
Get Insights Now!Historical monitoring can also reveal seasonal behavior. A competitor may discount during holidays, release premium content during sports seasons, increase promotional activity around major launches, or introduce bundles when customer acquisition slows.
For product and strategy teams, this means competitive data should be viewed as a time series rather than a collection of isolated records.
How Can Streaming Teams Turn Web Signals Into Actionable Content Intelligence?
A streaming OTT content web data scraper can help businesses structure large volumes of publicly available content information for downstream analytics. The important distinction is between collection and intelligence. Raw title lists alone do not answer business questions; structured, normalized, time-stamped records make analysis possible.
A useful content intelligence model can include:
- Discovery layer – identifies relevant streaming platforms and content pages.
- Extraction layer – captures titles, metadata, pricing, availability, ratings, and other permitted fields.
- Normalization layer – standardizes categories, currencies, dates, genres, and platform names.
- Validation layer – identifies missing, duplicate, inconsistent, or outdated records.
- Historical layer – stores changes so teams can compare snapshots.
- Analytics layer – converts records into pricing, catalog, competitive, and trend indicators.
- Delivery layer – sends structured data into dashboards, warehouses, applications, or analytical workflows.
This approach became more valuable between 2020 and 2026 as the number of streaming services, content formats, monetization options, and distribution models increased. Nielsen's May 2025 data showed streaming usage had risen 71% compared with May 2021. The market therefore needs more than simple platform-level monitoring.
For example, a content team could calculate:
- New titles added per month.
- Titles removed per month.
- Original-content share.
- Genre distribution.
- Average rating by genre.
- Content availability by country.
- Competitor release frequency.
- Average content age.
- Share of catalog by language.
- Changes in premium content availability.
These indicators can support decisions about licensing, original programming, market entry, partnerships, and promotional campaigns.
A key advantage is that structured data can connect content intelligence with commercial intelligence. If a platform expands its sports catalog while simultaneously introducing an ad-supported plan, the combined change may signal a broader monetization strategy. If several competitors increase their investment in a particular genre, that trend may influence acquisition priorities.
Business takeaway: The strongest streaming intelligence systems connect title-level data with pricing, timing, geography, monetization, and competitor behavior.
What Business Problems Can Large-Scale Collection Solve?
OTT Data Scraping becomes especially valuable when streaming businesses need consistent data across many platforms, countries, categories, and time periods.
Manual research can work for a small competitive review, but it becomes inefficient when teams need thousands of records updated frequently. Automated collection can support broader coverage while reducing repetitive research work.
| Business problem | Data-driven response | Potential outcome |
|---|---|---|
| Competitor price changes | Track subscription tiers and pricing history | Faster pricing response |
| Catalog uncertainty | Monitor additions and removals | Better content visibility |
| Regional differences | Compare country-level availability | Improved market planning |
| Genre competition | Classify and compare catalogs | Better acquisition strategy |
| Promotional activity | Record discounts and bundles | Stronger campaign benchmarking |
| Content concentration | Analyze title and genre distribution | Identify market gaps |
| Market expansion | Compare platforms across regions | Support localization decisions |
Real-world market data reinforces the need for this approach. Antenna reported that the Premium SVOD category exceeded 250 million subscriptions at the end of 2024, growing 10.4% year over year. It also recorded 174.3 million gross additions and 147.8 million cancellations during 2024, illustrating significant movement within the subscription ecosystem.
Advertising has also become an important component of streaming economics. Antenna reported that nearly 46% of subscriptions among SVOD services offering both ad-supported and ad-free options were ad-supported in Q2 2025, with ad-supported subscriptions growing 32.7% year over year. Nielsen separately reported that 73.6% of overall TV viewing in Q2 2025 was to content with advertising.
From 2020 through 2026, the strategic problem therefore shifted from How do we enter streaming? to How do we compete efficiently in an increasingly complex streaming ecosystem? Pricing, content, advertising, bundles, sports, regional availability, and audience behavior now interact.
A structured dataset allows teams to monitor those interactions rather than analyzing each variable separately.
How Can Structured Datasets Support Strategic Planning?
OTT Datasets provide the historical foundation needed to turn repeated observations into measurable market indicators. A single snapshot can show what a competitor offers today. A longitudinal dataset can reveal what the competitor is changing and how quickly.
For example, a six-month dataset could show whether a platform:
- Raises or lowers prices.
- Adds more ad-supported options.
- Expands specific genres.
- Removes older titles.
- Increases original programming.
- Expands into new countries.
- Changes content availability by subscription tier.
- Adjusts promotional offers around major releases.
The 2020-2026 period demonstrates why historical context matters. Streaming grew from an increasingly important digital entertainment channel into a dominant component of TV viewing. Nielsen's 2024 reports showed streaming reaching 40.3% of TV usage in June and 41.4% in July. In July 2025, streaming reached 47.3%. By May 2026, it reached 48.6%.
This progression creates opportunities for predictive and comparative analysis.
A mature dataset can support dashboards such as:
| Dashboard | Key metrics |
|---|---|
| Pricing intelligence | Price changes, tiers, discounts, annualized cost |
| Catalog intelligence | Additions, removals, genres, languages |
| Competitive intelligence | Platform comparisons and market positioning |
| Content intelligence | Releases, ratings, title concentration |
| Geographic intelligence | Country availability and regional gaps |
| Monetization intelligence | Ad-supported versus ad-free offerings |
For decision-makers, the key is consistency. If data is collected using changing definitions, inconsistent naming, or irregular schedules, historical analysis becomes unreliable. Standardized schemas, timestamps, validation rules, and documented collection processes are therefore essential.
Why Choose Real Data API?
Real Data API can support streaming businesses that need scalable, structured, and repeatable web data collection for competitive research and market analysis. The focus should be on transforming fragmented online information into organized datasets that analysts and business teams can use.
A practical implementation can support:
- Recurring data collection.
- Structured output formats.
- Competitor monitoring workflows.
- Product and content metadata extraction.
- Historical change tracking.
- Data normalization.
- Integration with analytics environments.
- Scalable monitoring across markets and platforms.
The strongest business case is not simply automation. It is decision speed. When pricing teams receive structured competitive changes quickly, they can evaluate positioning sooner. When content teams see catalog changes systematically, they can identify gaps faster. When strategy teams have historical observations, they can distinguish temporary events from persistent market movements.
The market's trajectory makes this increasingly important. Streaming accounted for 44.8% of TV viewing in May 2025 and reached 48.6% in May 2026 according to Nielsen. As streaming approaches half of television usage, competitive intelligence becomes a core strategic capability rather than a secondary research activity.
How Does OTT API scraping to track content popularity improve decisions?
OTT API scraping to track content popularity can help businesses organize signals such as title rankings, ratings, viewing indicators where publicly available, release frequency, and catalog visibility into structured analytical datasets.
The objective is not to assume that one metric equals popularity. Instead, teams can combine multiple observable signals and compare them over time.
For example, a title that appears across several competitor catalogs, receives strong ratings, remains prominently promoted, and persists over multiple monitoring periods may represent a stronger competitive signal than a title that appears briefly and disappears.
A practical popularity model could evaluate:
Popularity Signal = Visibility + Rating Strength + Review Volume + Catalog Persistence + Competitive Presence
The exact formula should be adapted to the available data and business objective.
This approach is particularly useful for content acquisition teams. Instead of evaluating content opportunities only through internal viewing data, teams can incorporate broader market signals to identify genres, franchises, languages, and formats receiving sustained competitive attention.
Conclusion
OTT Data Scraping for Streaming Market Intelligence gives streaming businesses a structured way to understand an increasingly complex market. The strongest use case is not simply collecting content or pricing information. It is building a repeatable intelligence layer that connects competitor activity with pricing, catalog strategy, content trends, regional availability, advertising models, and market positioning.
The 2020-2026 period shows how quickly streaming has evolved. Nielsen reported streaming at 40.3% of TV usage in June 2024, 44.8% in May 2025, and 48.6% in May 2026. Meanwhile, consumer research points to growing price sensitivity and continued pressure around perceived content value.
For streaming businesses, the practical lesson is clear: competitive data should be continuous, structured, historical, and actionable.
Ready to turn changing streaming-market data into actionable competitive intelligence? Connect with Real Data API to build a scalable data collection workflow tailored to your pricing, content, and market strategy needs!
FAQs
1. What is OTT data scraping used for?
OTT data scraping collects publicly available streaming information such as prices, catalogs, ratings, genres, and availability to support OTT Data Scraping for Streaming Market Intelligence.
2. How does an OTT Scraping API help streaming businesses?
An OTT Scraping API can automate structured data collection across selected sources, helping teams monitor pricing, catalogs, content changes, and competitive movements more efficiently.
3. Why should businesses extract OTT competitor data?
Businesses use extract OTT competitor data workflows to compare subscription prices, content offerings, promotions, regional availability, and strategic changes across competing streaming platforms.
4. What does real-time OTT catalog data include?
real-time OTT catalog data can include titles, genres, languages, release dates, ratings, availability, subscription tiers, and content additions or removals across monitored streaming services.
5. How frequently should OTT competitor data scraping run?
The ideal frequency depends on business objectives. OTT competitor data scraping may run daily, weekly, or more frequently when pricing, catalog availability, or promotional changes require faster detection.
Latest posts
How to Scrape Grocery Product Listing Data in 2026 Using Grocery Data Scraping to Improve Grocery Pricing and Inventory Decisions?
How Foodpanda data scraping for restaurant market research Improves Restaurant Listings, Discounts, and Menu Intelligence
How Fashion Product Data Extraction for Retail Analytics Helps Retailers Track Prices, Trends, and Competitor Strategies
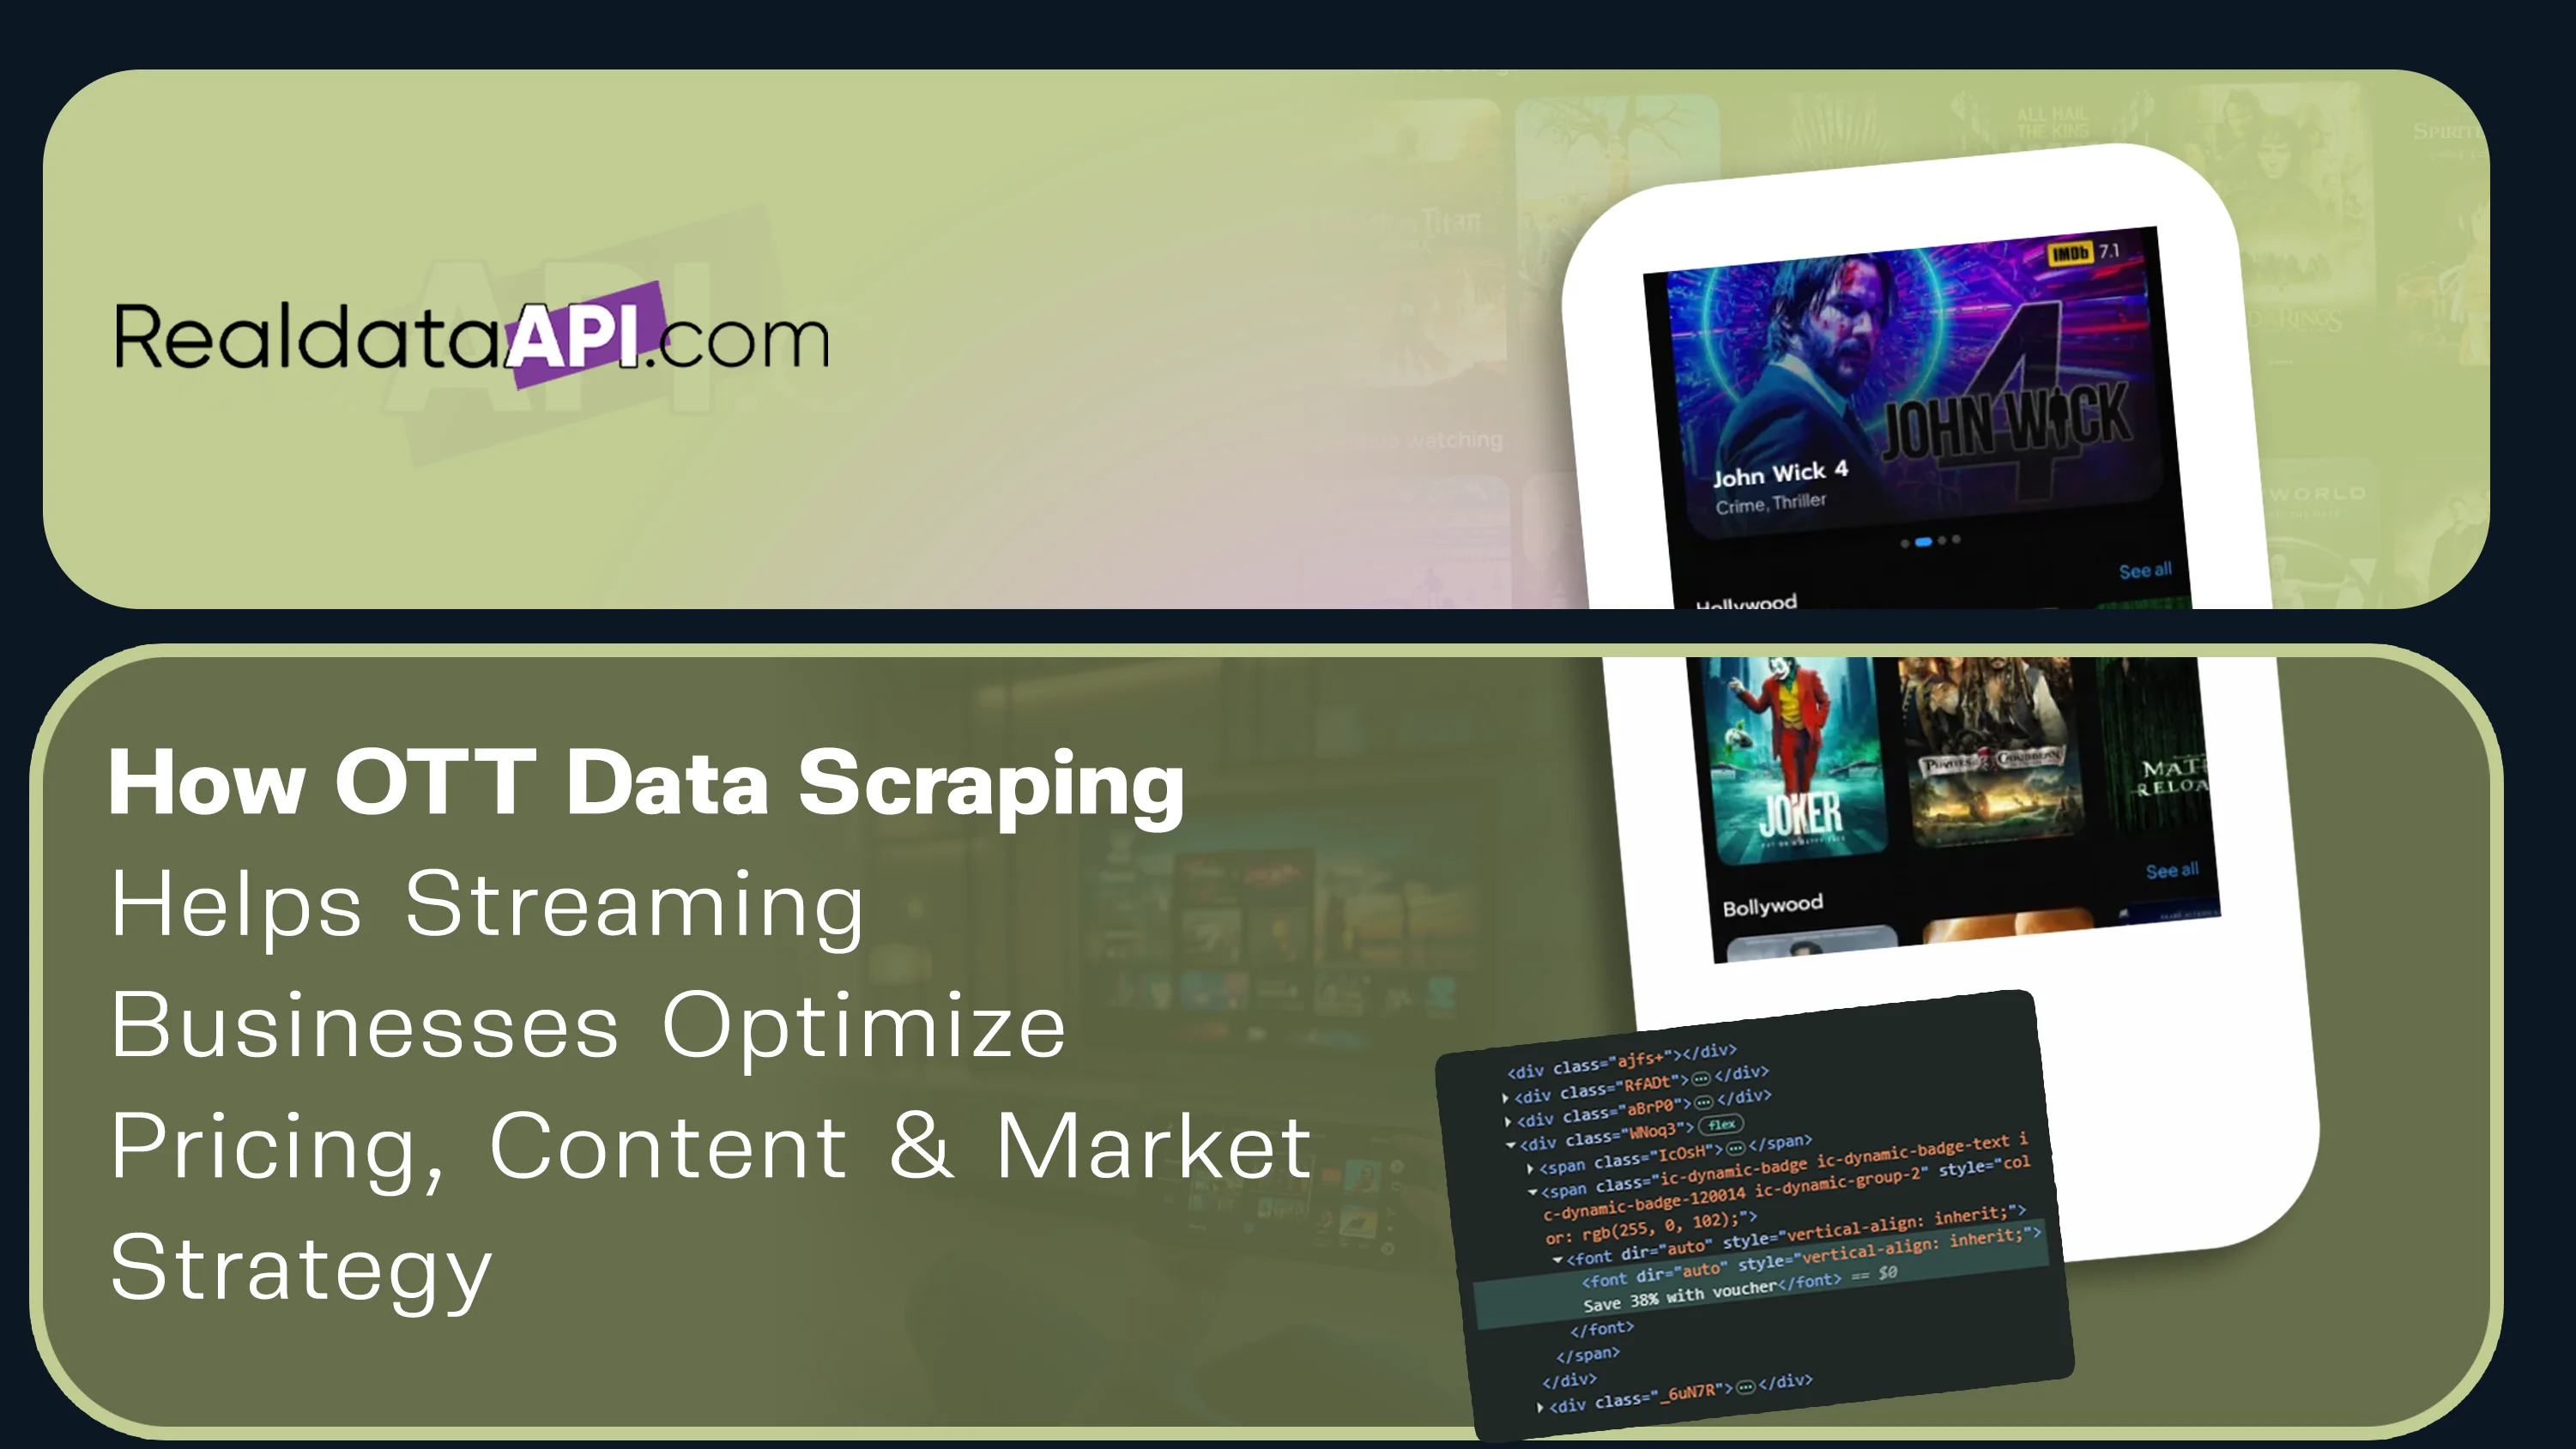
How OTT Data Scraping for Streaming Market Intelligence Helps Streaming Businesses Optimize Pricing, Content, and Market Strategy






.png)



