
Quick Summary
- Scrape Grocery Product Listing Data in 2026 Using Grocery Data Scraping to understand how structured online grocery data supports product comparisons, competitor monitoring, and smarter pricing decisions.
- Grocery Scraping API workflows can help retailers collect accessible product prices, discounts, pack sizes, and availability information in consistent formats.
- Historical tracking and data validation help grocery retailers, FMCG brands, and e-commerce teams identify price gaps, monitor assortment changes, and improve inventory planning.
Introduction
To scrape grocery product listings in 2026, businesses should collect accessible product names, prices, pack sizes, discounts, categories, and availability, then validate and compare the records over time. Scrape Grocery Product Listing Data in 2026 Using Grocery Data Scraping to turn fragmented online listings into useful insights for pricing, competitor monitoring, and inventory planning.
For grocery retailers, online marketplaces, supermarket websites, and quick-commerce platforms are important sources of product intelligence. However, manually checking thousands of listings can be time-consuming, especially when prices, promotions, and availability change frequently. Structured data collection helps businesses maintain a more consistent view of the market.
A Grocery Scraping API workflow can organize permitted, accessible listing information into datasets for dashboards, price comparisons, category analysis, and inventory-related decisions. The exact fields available depend on each source, its access methods, and applicable terms.
The main objective is not simply to collect more records. It is to gather accurate, comparable, and sufficiently fresh data that answers practical business questions: Which competitors offer lower prices? Which products are frequently unavailable? Which pack sizes offer better value? Where are assortment gaps emerging?
This guide explains six practical applications, includes measurement tables and a 2020–2026 market timeline, and outlines how grocery businesses can build more reliable data workflows.
Which Grocery Data Fields Should Retailers Monitor?
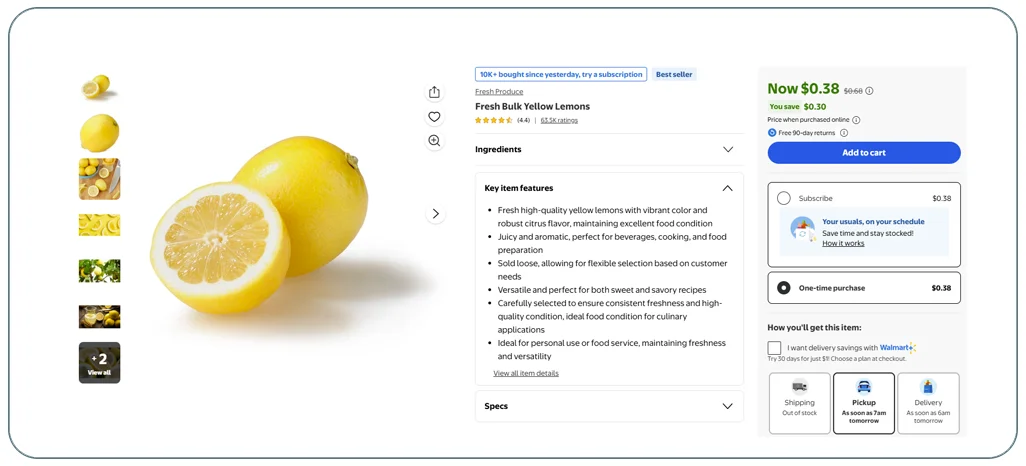
grocery data scraping in 2026 should begin with a clear list of business-critical fields. Retailers need to compare equivalent products, identify pricing differences, and monitor availability without confusing package sizes or promotional prices. A standardized dataset helps pricing managers and category teams make decisions based on consistent information.
Which product attributes matter most?
| Data field | Example | Business use |
|---|---|---|
| Product name | Whole milk | Product identification |
| Brand | Manufacturer or private label | Brand benchmarking |
| Listed price | Current displayed price | Price comparison |
| Pack size | 1 litre, 500 g, or 12 units | Like-for-like comparison |
| Unit price | Price per litre, kilogram, or unit | Value assessment |
| Discount | Displayed offer or markdown | Promotion monitoring |
| Availability | In stock or unavailable, if shown | Assortment monitoring |
| Product category | Dairy, produce, pantry | Category-level analysis |
| Timestamp | Date and time of collection | Historical tracking |
| Product URL or ID | Source listing reference | Record matching |
What KPIs should businesses measure?
| KPI | Calculation | Why it matters |
|---|---|---|
| Field completeness | Populated required fields ÷ total required fields × 100 | Measures dataset coverage |
| Duplicate rate | Duplicate records ÷ total records × 100 | Identifies redundant data |
| Price-change rate | Products with a price change ÷ matched products × 100 | Tracks pricing movement |
| Availability rate | Available monitored products ÷ monitored products × 100 | Measures observed assortment availability |
| Refresh success rate | Successful scheduled updates ÷ scheduled updates × 100 | Evaluates collection reliability |
These are recommended measurement formulas, not actual performance statistics for a particular retailer.
How has the need evolved from 2020 to 2026?
In 2020, changes in shopping behavior increased the importance of digital grocery listings and online availability. During 2021–2022, retailers had practical reasons to compare prices, product assortment, and promotions across online channels. In 2023–2024, historical observations became more useful for identifying recurring price movements and changes in product availability. By 2025, structured data validation and product matching remained important for retailers managing larger catalogs. In 2026, businesses can combine product-level data with unit-price calculations and timestamped observations to improve category comparisons. These dates describe the evolution of monitoring needs, not a verified numerical market-growth series. Retailers should establish a baseline from their own collected data before setting targets for completeness, freshness, or price-monitoring coverage.
How Can Retailers Keep Product Information Current?
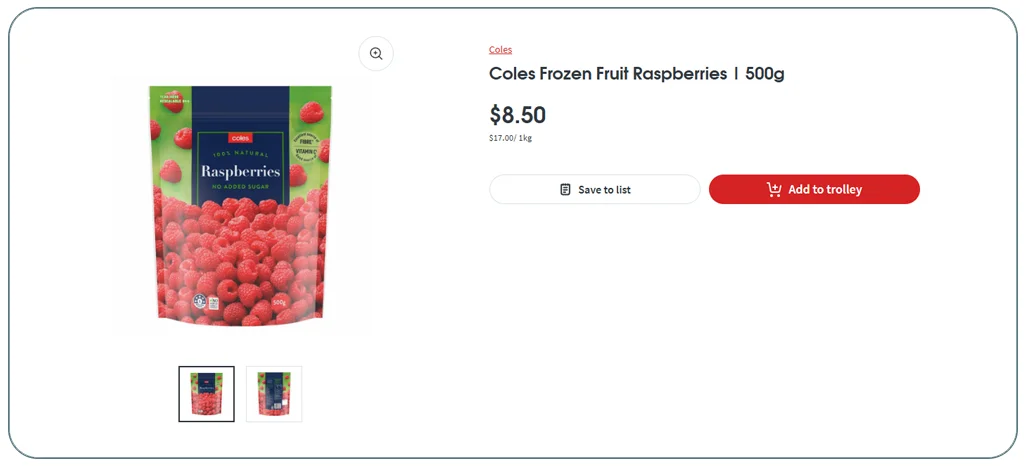
real-time grocery product data collection helps retailers observe online listing changes closer to when they occur. In practice, "real-time" can mean frequent or event-triggered updates, depending on the source, permitted access, technical limits, and collection schedule. Businesses should define their freshness requirements instead of assuming every source can be monitored continuously.
Which collection frequency is appropriate?
| Business need | Suggested starting frequency | Considerations |
|---|---|---|
| Fast-moving promotional prices | Several checks per day, where permitted | Promotions may change quickly |
| Standard grocery prices | Daily or several times per week | Balance freshness and cost |
| Product assortment changes | Daily or weekly | Depends on catalog turnover |
| Product descriptions and pack sizes | Weekly or after detected changes | Usually less time-sensitive |
| Historical category research | Weekly or monthly | Consistency matters most |
These frequencies are planning suggestions, not guarantees of source availability or recommended limits for every website.
What makes a reliable update workflow?
- Schedule collections according to the importance of each category.
- Record the collection timestamp and source for every observation.
- Compare new records with previous records using stable product identifiers where available.
- Flag unusual price movements for validation before triggering business actions.
- Store unavailable or missing values separately from confirmed out-of-stock observations.
- Monitor failed collection jobs and retry only in ways allowed by the source.
What changed between 2020 and 2026?
In 2020, grocery businesses faced increased pressure to understand online product availability and changing shopping patterns. During 2021–2022, ongoing online ordering made recurring monitoring more useful for evaluating price and assortment differences. In 2023–2024, businesses could gain more context by retaining historical records instead of replacing old values with the latest listing. In 2025, attention to data freshness and automated quality checks helped support more dependable workflows. In 2026, retailers can use different update schedules for fast-moving prices, slower-changing product descriptions, and periodic category analysis. Scrape Grocery API For Retail Pricing Analysis helps businesses structure grocery marketplace data to monitor price changes, product availability, and assortment trends over time. There is no single correct refresh frequency for every product. A useful approach is to compare the cost of collecting data more frequently against the business impact of acting on outdated information.
How Does an API Make Grocery Catalog Analysis Easier?
A grocery product listing API workflow can help businesses retrieve accessible product information and deliver it in a predictable, structured format. This makes it easier to connect grocery listings with pricing dashboards, category reports, internal databases, and other analytics tools.
What should an API-based dataset contain?
| Component | Purpose |
|---|---|
| Product identifiers | Match listings across collection periods |
| Price and currency | Support consistent comparisons |
| Unit and pack-size fields | Compare equivalent quantities |
| Promotion details | Separate standard and discounted prices |
| Availability fields | Track observed listing status |
| Source metadata | Preserve provenance |
| Timestamps | Support historical analysis |
| Validation flags | Identify records requiring review |
What is the practical workflow?
- Define requirements — Choose sources, categories, products, and required fields.
- Collect accessible listings — Use an appropriate authorized collection method.
- Normalize and validate — Standardize units, currencies, identifiers, and values.
- Deliver for analysis — Provide structured records for dashboards and reports.
How has API-based collection evolved from 2020 to 2026?
In 2020, many grocery teams relied on manual research and spreadsheet comparisons. During 2021–2022, the need to handle more online listings highlighted the limitations of repeated manual collection. In 2023–2024, structured data delivery could help organizations connect external listing information with internal product and pricing workflows. During 2025, data quality, stable schemas, and historical retention remained important for maintaining useful records. In 2026, API-based collection can support repeatable grocery intelligence workflows, provided that the source permits access and exposes the necessary fields. An API does not automatically guarantee real-time updates, complete catalog coverage, or perfect accuracy. Those outcomes depend on source access, implementation, validation, and update frequency.
Need a structured grocery data pipeline? Contact Real Data API to discuss collection requirements, field coverage, refresh schedules, and analytics-ready delivery.
Get Insights Now!How Can Grocery Data Reveal Market Opportunities?
Businesses that extract grocery product data for market analysis can compare product categories, brands, pack sizes, promotions, and price movements to understand how the online grocery market is changing. This analysis helps category managers investigate pricing gaps, identify assortment opportunities, and prioritize products for further research.
Which market signals should teams analyze?
| Market signal | How to measure it | Potential insight |
|---|---|---|
| Price differences | Compare matched products across retailers | Identify competitive gaps |
| Unit-price differences | Standardize prices per kilogram, litre, or unit | Reveal relative value |
| Assortment gaps | Compare available products by category | Identify missing variants |
| Promotion frequency | Count observed offers over time | Evaluate promotional intensity |
| Product availability | Track observed listing status | Identify availability differences |
| Private-label presence | Compare private-label listings by category | Review assortment positioning |
Example: comparing equivalent grocery products
Suppose three online retailers list different sizes of the same branded cooking oil. Comparing only the displayed package prices could make one retailer appear cheaper simply because it sells a smaller bottle. Converting the prices into a standard cost per litre provides a more meaningful comparison.
The following example uses hypothetical values for illustration.
| Retailer | Pack size | Listed price | Price per litre |
|---|---|---|---|
| Retailer A | 1 litre | 150 | 150 |
| Retailer B | 750 ml | 120 | 160 |
| Retailer C | 2 litres | 280 | 140 |
Prices are illustrative currency units, not observed market prices.
This comparison shows why unit-price normalization matters. Retailer C has the lowest unit price in this example, even though its total package price is highest.
What do the 2020–2026 developments mean for retailers?
In 2020, shifts toward online grocery shopping made digital product visibility increasingly important. During 2021–2022, retailers needed to understand how product assortment and pricing differed across online channels. In 2023–2024, category-level comparisons became more useful when combined with unit prices and promotion history. During 2025, maintaining historical records helped teams distinguish temporary offers from persistent differences. In 2026, grocery businesses can use comparable product datasets to investigate underrepresented categories, pricing gaps, and changes in promotional activity. These opportunities must be validated against real observations, since a price difference alone does not prove a market opportunity or predict sales.
How Can Data Collection Improve Pricing and Inventory Decisions?
Grocery Data Scraping can support pricing and inventory planning by creating a consistent view of online product prices, promotions, assortment, and observable availability. It is particularly useful when a retailer needs to compare multiple competitors or maintain visibility across a large catalog.
However, online availability is not the same as a retailer's internal inventory level. A listing marked unavailable may reflect a temporary website condition, delivery-zone restriction, or source-specific issue. Businesses should treat external availability as an indicator to investigate, not as a definitive statement about physical stock.
How can collected data support business decisions?
| Business challenge | Data to analyze | Suggested action |
|---|---|---|
| Competitor prices change frequently | Matched price history | Review pricing rules |
| Promotions reduce apparent margins | Standard and discounted prices | Evaluate promotional strategy |
| Product sizes differ | Pack-size and unit-price fields | Compare equivalent value |
| Assortment gaps appear | Category and variant coverage | Review product range |
| Availability changes repeatedly | Timestamped status observations | Investigate supply or listing issues |
| Data quality is inconsistent | Completeness and matching KPIs | Improve validation |
A practical approach to inventory-related insights
- Track observable product availability across selected sources.
- Compare availability patterns with internal inventory records where appropriate.
- Flag repeated competitor availability gaps for review.
- Distinguish confirmed observations from missing or failed data collection.
- Use sales, replenishment, and supply-chain information to validate inventory decisions.
How did these needs develop from 2020 to 2026?
In 2020, changing grocery shopping patterns highlighted the importance of product availability and online catalog visibility. During 2021–2022, recurring product checks helped retailers observe differences in assortment and pricing. In 2023–2024, combining external listing observations with internal inventory and sales information could provide more context for commercial decisions. During 2025, structured historical records helped businesses review repeated changes rather than rely on isolated checks. In 2026, retailers can use monitored prices and availability indicators to prioritize product reviews, identify potential assortment gaps, and assess competitor activity. Actual stock levels, demand, and replenishment requirements still need to be validated using appropriate internal data. External listings alone cannot establish why an item is unavailable or how many units remain in a warehouse.
How Can Historical Grocery Data Support Better Forecasting?
Grocery Scraping API workflows can help businesses preserve timestamped product observations so they can compare market conditions across days, weeks, months, and years. Historical records provide context for understanding whether a price movement is temporary, whether a product repeatedly becomes unavailable, and whether promotional patterns recur.
For businesses building long-term monitoring programs, Scrape Grocery Product Listing Data in 2026 Using Grocery Data Scraping as part of a consistent process that preserves historical records, normalizes product attributes, and validates observations before analysis.
What should a historical dataset include?
| Field | Why retain it? |
|---|---|
| Product ID or matching key | Connect observations of the same item |
| Collection timestamp | Establish when the value was observed |
| Standard price | Track baseline pricing |
| Discounted price | Monitor promotions |
| Pack size and unit price | Compare equivalent products |
| Availability status | Track visible assortment changes |
| Retailer or source | Identify where the observation originated |
| Quality flags | Highlight uncertain or incomplete records |
How can historical records be used?
- Price trend analysis: Compare matched products over time.
- Promotion evaluation: Review how often discounts appear and how long they remain visible.
- Assortment tracking: Identify new, changed, or no-longer-visible listings.
- Category benchmarking: Compare product groups using consistent metrics.
- Forecasting inputs: Combine historical marketplace observations with internal sales, inventory, and seasonal information.
What does the 2020–2026 timeline indicate?
In 2020, the changing role of online grocery channels increased the value of digital product records. During 2021–2022, recurring observations could help businesses monitor price and assortment differences. In 2023–2024, preserving historical data made it easier to distinguish one-time changes from recurring patterns. During 2025, improved normalization and validation helped support more consistent comparisons. In 2026, historical product datasets can inform pricing reviews and contribute to forecasting when combined with suitable internal information. These dates provide market context rather than a verified annual growth statistic. Historical listings alone do not prove future demand or sales performance; forecasting requires appropriate validation and additional evidence.
Why Choose Real Data API?
Grocery businesses need dependable data collection workflows that fit their product coverage, reporting requirements, and commercial goals. Real Data API can help organizations plan structured collection, data standardization, validation, and delivery for grocery market research, subject to source accessibility and project requirements.
What benefits should businesses look for?
- Scalable collection: Support monitoring across selected grocery categories, products, and online retailers.
- Structured data delivery: Organize available information into consistent fields for analysis.
- Pricing intelligence: Compare standard prices, discounts, pack sizes, and unit prices.
- Historical monitoring: Preserve dated records for trend analysis.
- Data validation: Identify missing fields, duplicates, and questionable product matches.
- Flexible integration: Prepare datasets for spreadsheets, databases, dashboards, and business intelligence tools.
Well-organized Grocery Datasets can support more consistent comparisons by connecting product identifiers, retailer information, timestamps, prices, and availability observations. Businesses should agree on required fields and quality standards before collection begins.
For a successful project, define the products to monitor, choose a suitable refresh schedule, establish validation rules, and document how uncertain records will be handled. These steps help ensure that collected data is relevant to the business decisions it is intended to support.
Conclusion
Grocery retailers and FMCG brands need reliable information to understand online pricing, product assortment, promotional activity, and competitor availability. Manual research can become difficult to maintain as catalogs expand and marketplace information changes. A structured data collection workflow helps businesses compare products consistently and investigate market changes using dated observations.
A carefully designed grocery monitoring process can help category managers evaluate unit prices, review competitor promotions, identify assortment gaps, and improve the information available for pricing and inventory planning. The strongest results come from accurate product matching, transparent data quality checks, appropriate refresh schedules, and validation against internal business information.
Scrape Grocery API For Retail Pricing Analysis workflows can help organizations structure their market-monitoring efforts around product prices, pack sizes, discounts, and historical observations. The resulting insights can support smarter decisions when the underlying data is accurate, accessible, and appropriate for the intended analysis.
Ready to improve grocery pricing intelligence and product monitoring? Contact Real Data API to discuss a tailored data collection workflow that helps turn online grocery listings into actionable business insights!
Frequently Asked Questions
1. What is a grocery data scraping API?
A Grocery Scraping API helps businesses collect accessible online grocery product information in structured formats, supporting price comparison, assortment monitoring, and market research across selected sources.
2. Which grocery product details should businesses monitor?
grocery data scraping in 2026 can capture product names, prices, pack sizes, discounts, categories, and availability indicators to help retailers compare products and identify competitive differences.
3. How can retailers monitor changing grocery prices?
real-time grocery product data collection supports scheduled observations of accessible product prices and promotions, helping teams detect changes according to source availability and configured collection frequency.
4. Why use an API for grocery product listings?
A grocery product listing API can organize accessible product attributes into consistent records, helping businesses connect grocery information with reporting systems, dashboards, and pricing analysis workflows.
5. Can grocery data help identify market opportunities?
Businesses can extract grocery product data for market analysis to compare unit prices, assortment, and promotional patterns. Real Data API can help structure these observations for further evaluation.
Latest posts
How to Scrape Grocery Product Listing Data in 2026 Using Grocery Data Scraping to Improve Grocery Pricing and Inventory Decisions?
How Foodpanda data scraping for restaurant market research Improves Restaurant Listings, Discounts, and Menu Intelligence

How Fashion Product Data Extraction for Retail Analytics Helps Retailers Track Prices, Trends, and Competitor Strategies
How OTT Data Scraping for Streaming Market Intelligence Helps Streaming Businesses Optimize Pricing, Content, and Market Strategy







.png)



