Introduction
The mobile app ecosystem has become an important source of market intelligence for brands, app developers, investors, agencies, and researchers. Application listings reveal much more than app names and categories. Ratings, reviews, developer information, pricing, descriptions, rankings, and user feedback can collectively provide valuable signals about customer preferences, competitor positioning, product quality, and emerging market opportunities.
Google Play web scraping for market research enables businesses to transform publicly available app-store information into structured datasets for systematic analysis. Instead of manually examining individual application pages, organizations can collect large volumes of information and compare applications across categories, developers, countries, ratings, and time periods. A Google Play Scraper can support this process by helping create repeatable datasets for competitive intelligence and market research.
The size and changing composition of Google Play make this approach increasingly relevant. AppBrain reported 1,922,006 applications available on Google Play in July 2026, while its June 2026 data showed 74.2 thousand new applications launched and 35.3 thousand applications removed, resulting in net growth of 38.9 thousand apps during that month.
For this report, the statistics are presented through a Real Data API analysis framework. The objective is to show not only the underlying market numbers but also what those numbers indicate for competitive research, trend identification, brand analysis, and data-driven decision-making.
Mapping Changes Across the Application Ecosystem
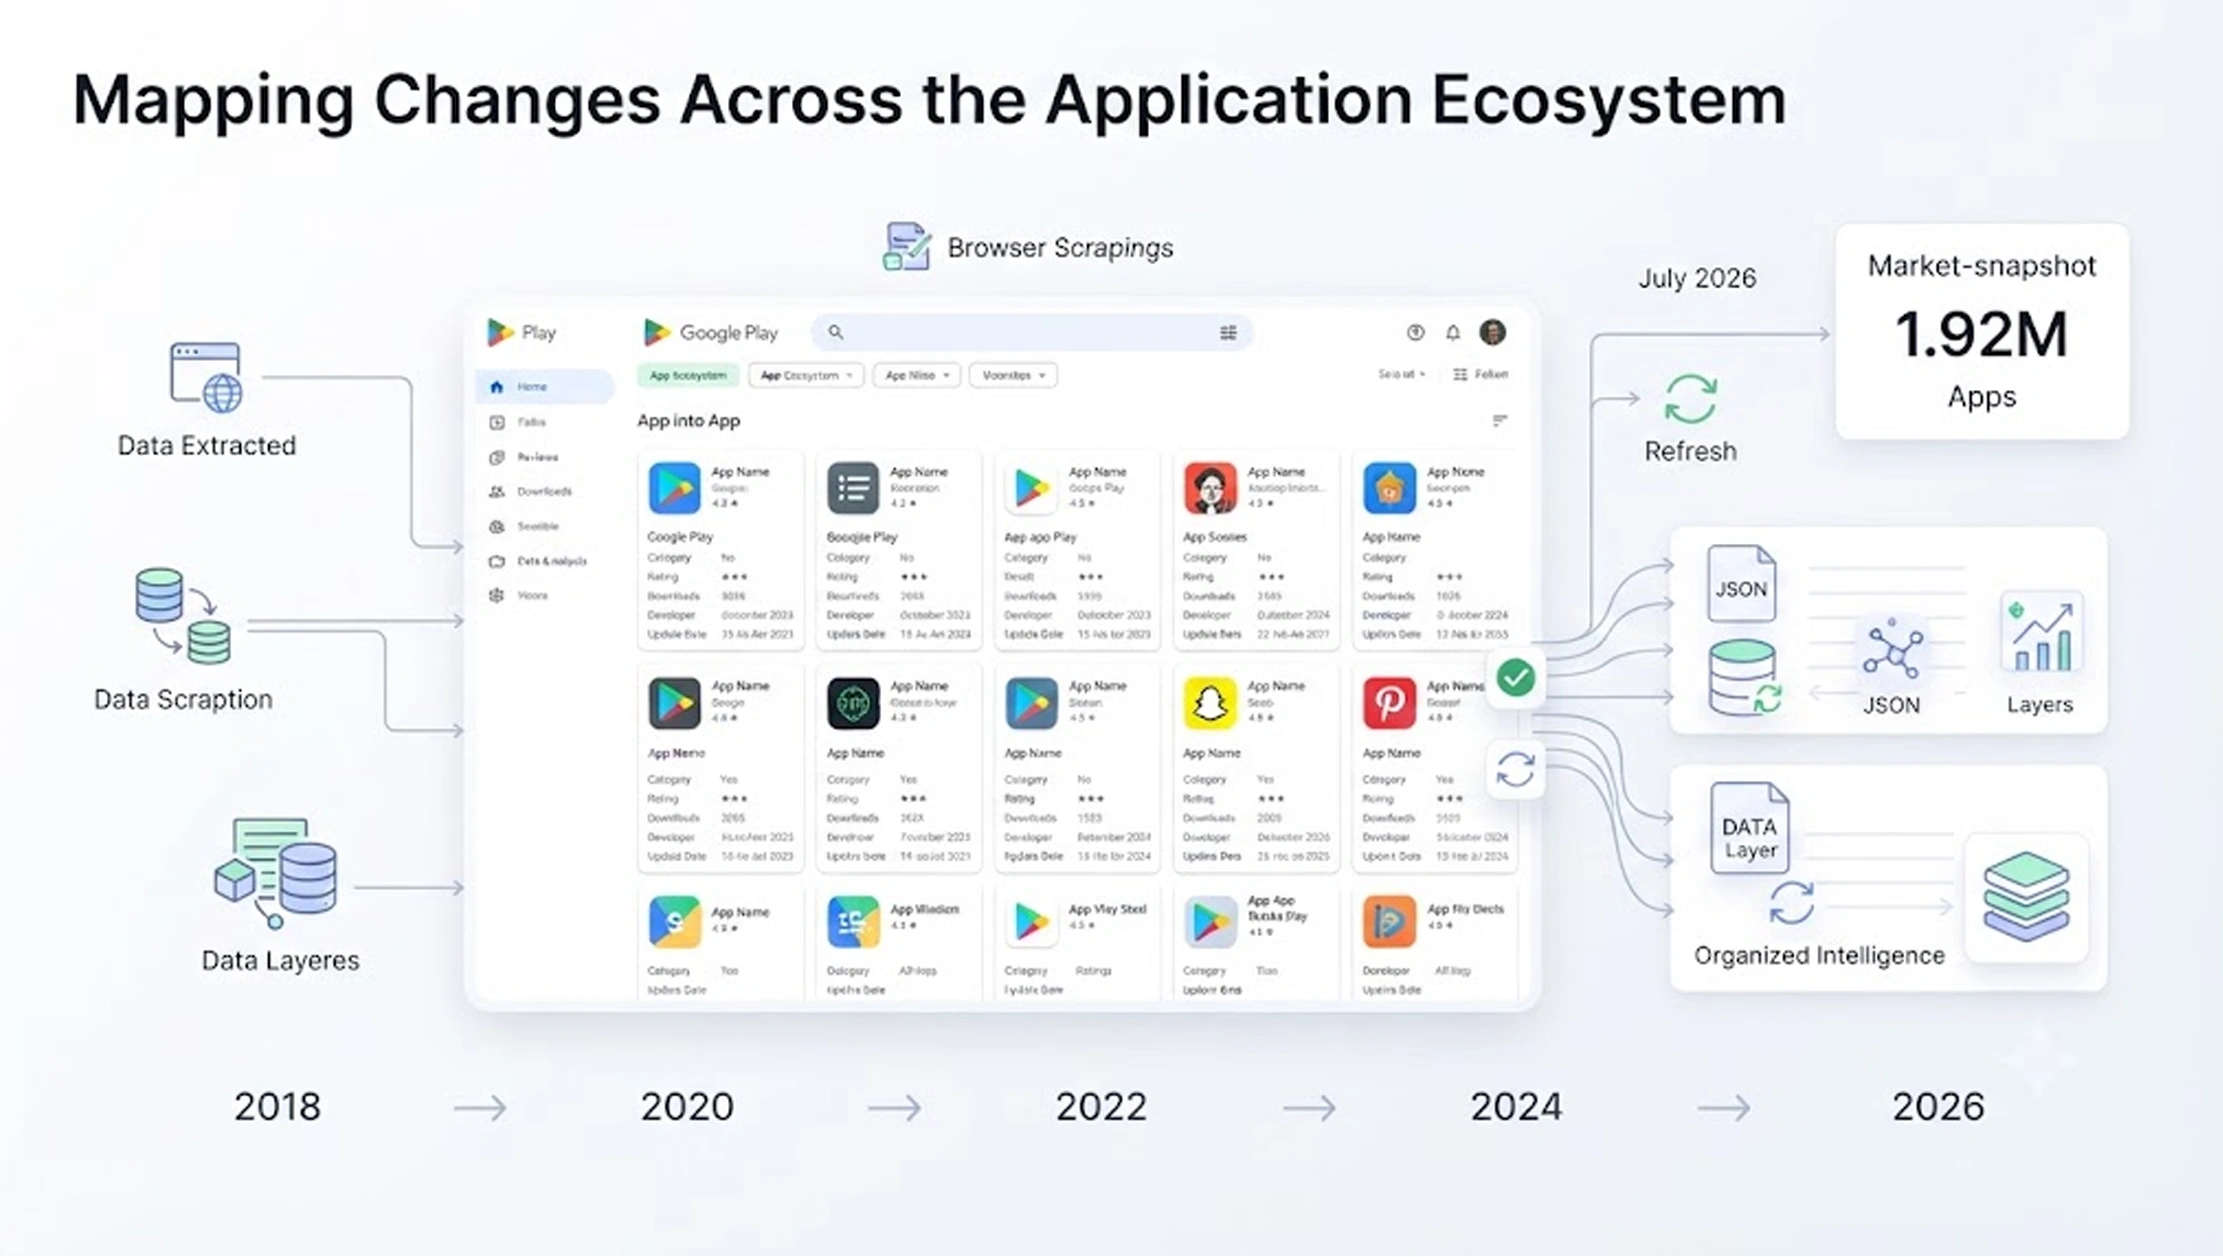
Google Play data scraping for trend analysis allows businesses to move from isolated observations to longitudinal market intelligence. By collecting app listings repeatedly, researchers can compare the number of applications, category distribution, ratings, review volume, developer activity, and other attributes across different periods.
Google Play's available-app count has changed substantially over time. Different research providers use different collection methodologies and dates, so the figures below should be interpreted as market snapshots rather than a perfectly standardized annual series. AppBrain's current July 2026 snapshot reports 1.92 million available applications. Historical AppBrain-derived figures reported by other research sources show a much larger ecosystem during earlier years.
Real Data API Analysis: Application Ecosystem Movement
| Period | Available-App Benchmark | Direction | Real Data API Interpretation |
|---|---|---|---|
| 2020 | ~3.48M | --- | High-volume competitive environment |
| 2021 | ~3.55M | Growth | App supply remained elevated |
| 2022 | ~3.55M | Stable | Market reached a high-supply phase |
| 2023 | ~2.68M | Decline | Major catalog rationalization |
| 2024 | ~2.06M | Decline | Increasing competitive filtering |
| 2025 | ~1.58M | Decline | Stronger concentration in active apps |
| 2026 | 1.92M* | Recovery | New listings indicate renewed supply |
*July 2026 AppBrain snapshot; earlier figures use historical AppBrain-derived data and should not be treated as identical-date observations.
Real Data API Insight: The analysis indicates that app-market opportunity cannot be measured simply by counting applications. The ecosystem experienced substantial contraction after the earlier high-supply period, followed by renewed activity in 2026. For businesses, this means continuous monitoring can be more valuable than relying on an annual market-size figure.
A scraping workflow can identify which categories are gaining applications, which competitors are disappearing, and which developers are repeatedly launching new products. When combined with ratings and review counts, these changes can help researchers distinguish genuine competitive growth from simple increases in app supply.
The strategic value comes from tracking direction and velocity. An application category adding thousands of new competitors may indicate strong commercial interest, while a shrinking category may indicate consolidation or changing consumer preferences.
Measuring Real-Time Changes in Competitive Activity
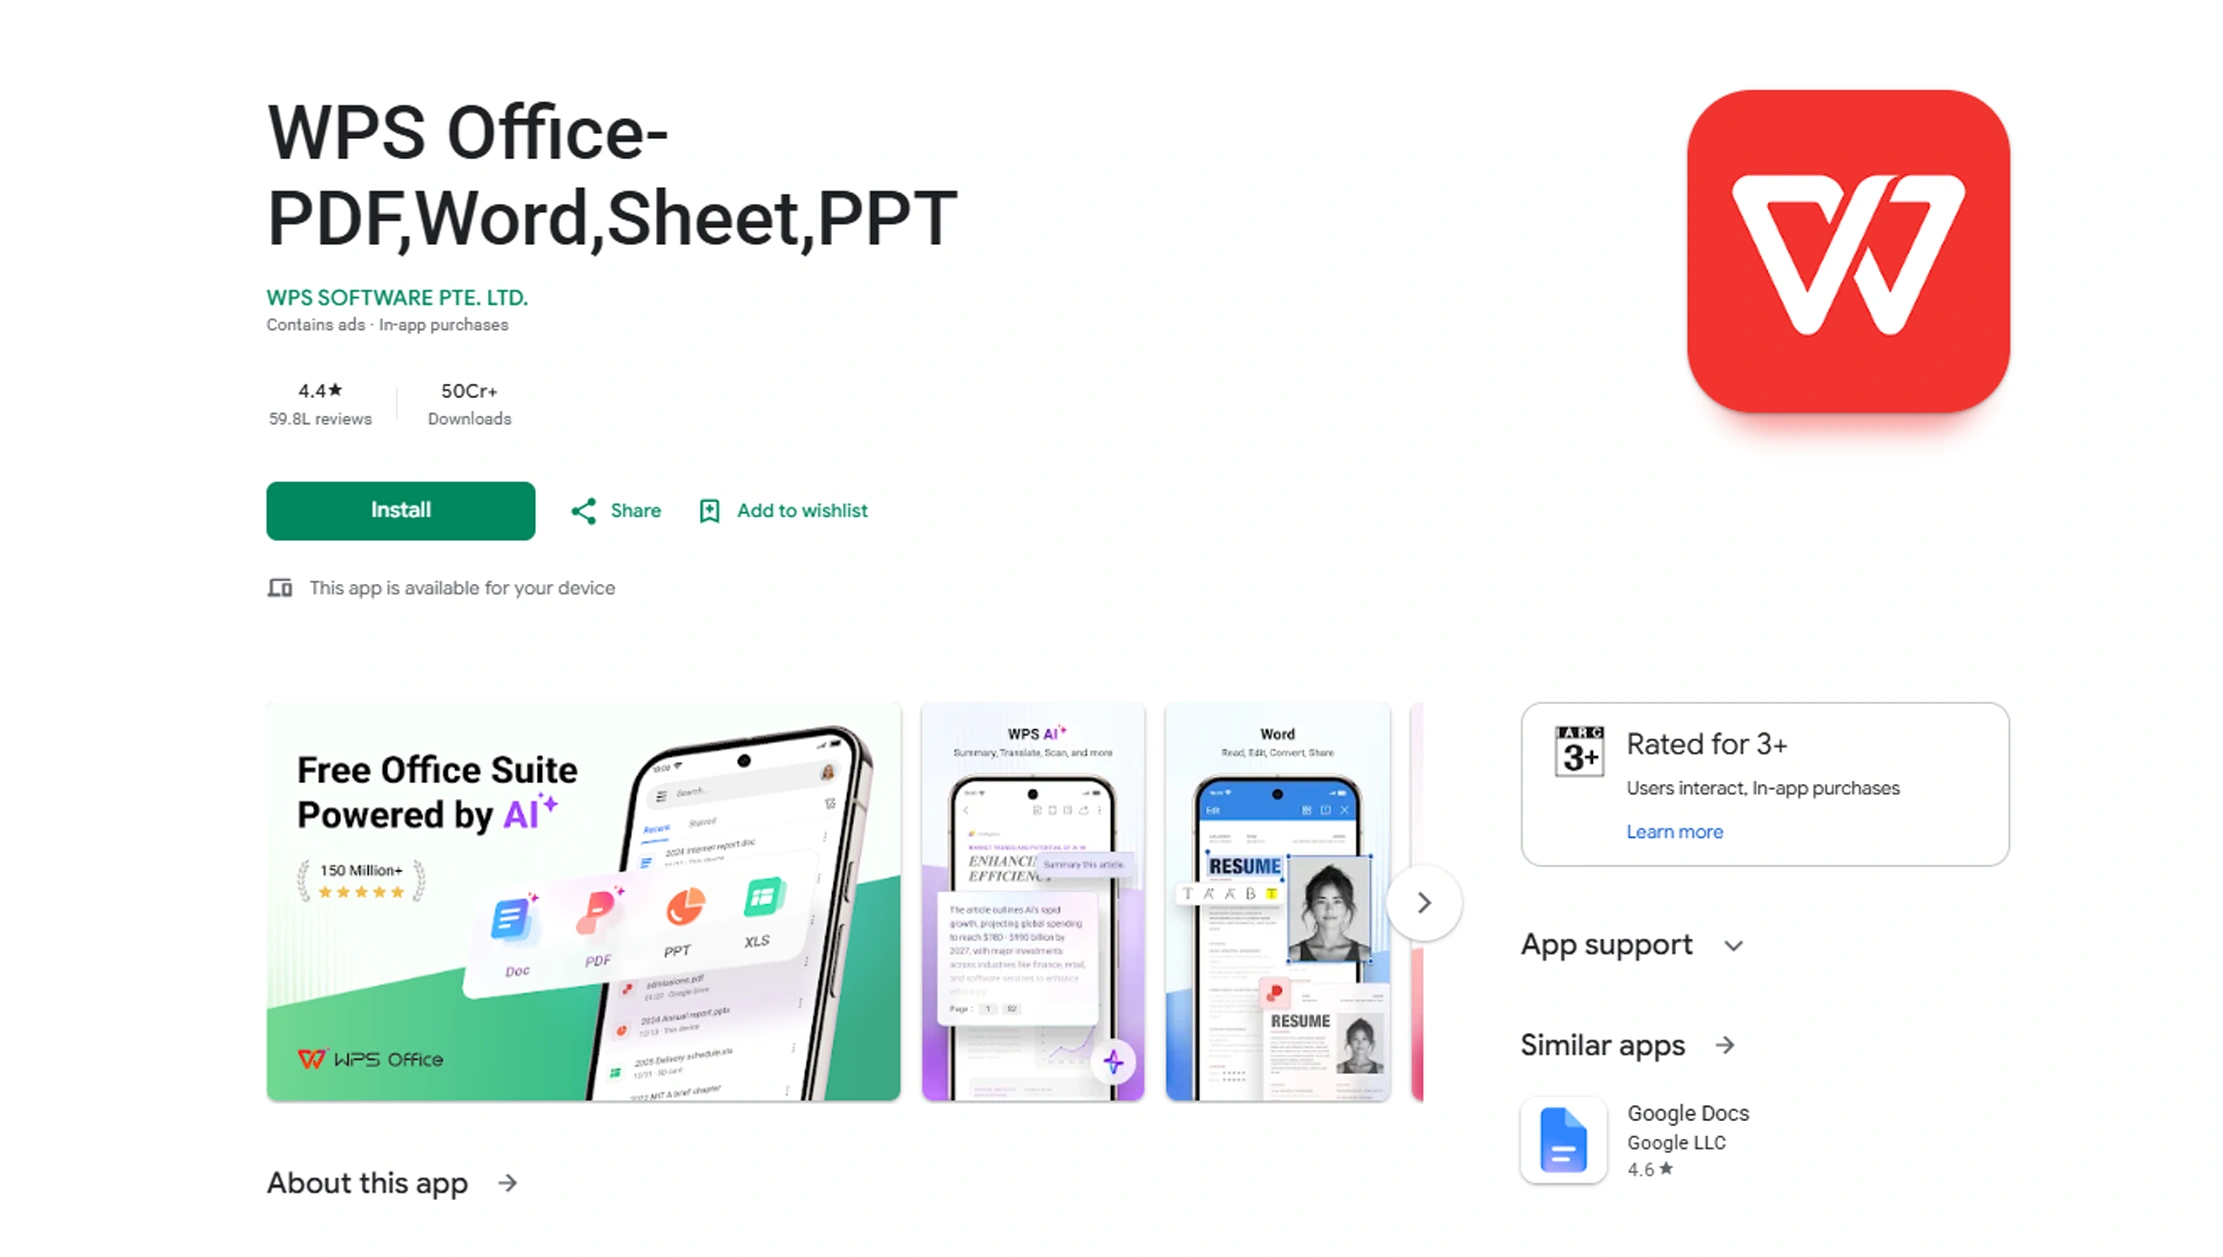
real-time Google Play data scraping can help companies identify changes in the application market as they occur. Competitors can update descriptions, change pricing, release new versions, accumulate reviews, improve ratings, or launch new applications without waiting for traditional market research reports.
The latest AppBrain data provides a useful example of how much movement can occur in a short period. In June 2026, 74.2 thousand new apps were launched on Google Play, while 35.3 thousand apps were removed. The resulting net growth was 38.9 thousand applications.
Real Data API Analysis: June 2026 Market Turnover
| Metric | June 2026 | Share/Relationship | Real Data API Interpretation |
|---|---|---|---|
| New apps launched | 74.2K | 100% | Strong developer activity |
| Apps removed | 35.3K | 47.6% of launches | High catalog turnover |
| Net app growth | 38.9K | 52.4% of launches | Positive monthly supply growth |
| Available apps, July 2026 | 1.92M | Current ecosystem | Large competitive base |
The removal-to-launch ratio is calculated from AppBrain's reported June 2026 figures.
Real Data API Insight: For every 100 new applications launched in June 2026, approximately 48 applications were removed. This suggests that app-market research should monitor both new supply and attrition. Looking only at new launches could overstate competitive expansion.
For a brand, this distinction is important. A category may appear crowded because hundreds of new apps are entering it, but if many are quickly removed, the number of durable competitors may be much lower. A structured scraping pipeline can therefore track app launches and removals alongside ratings, review growth, and listing changes.
Real-time collection can also help organizations build change-detection systems. For example, a competitor monitoring workflow could flag a sudden rating increase, a major description change, a new subscription model, or a sharp rise in review volume. Such signals can then be incorporated into competitive intelligence dashboards.
This makes data collection more actionable. Instead of asking what the app market looked like six months ago, researchers can investigate what has changed and which changes deserve immediate attention.
Turning Listings, Ratings, and Reviews Into Brand Intelligence
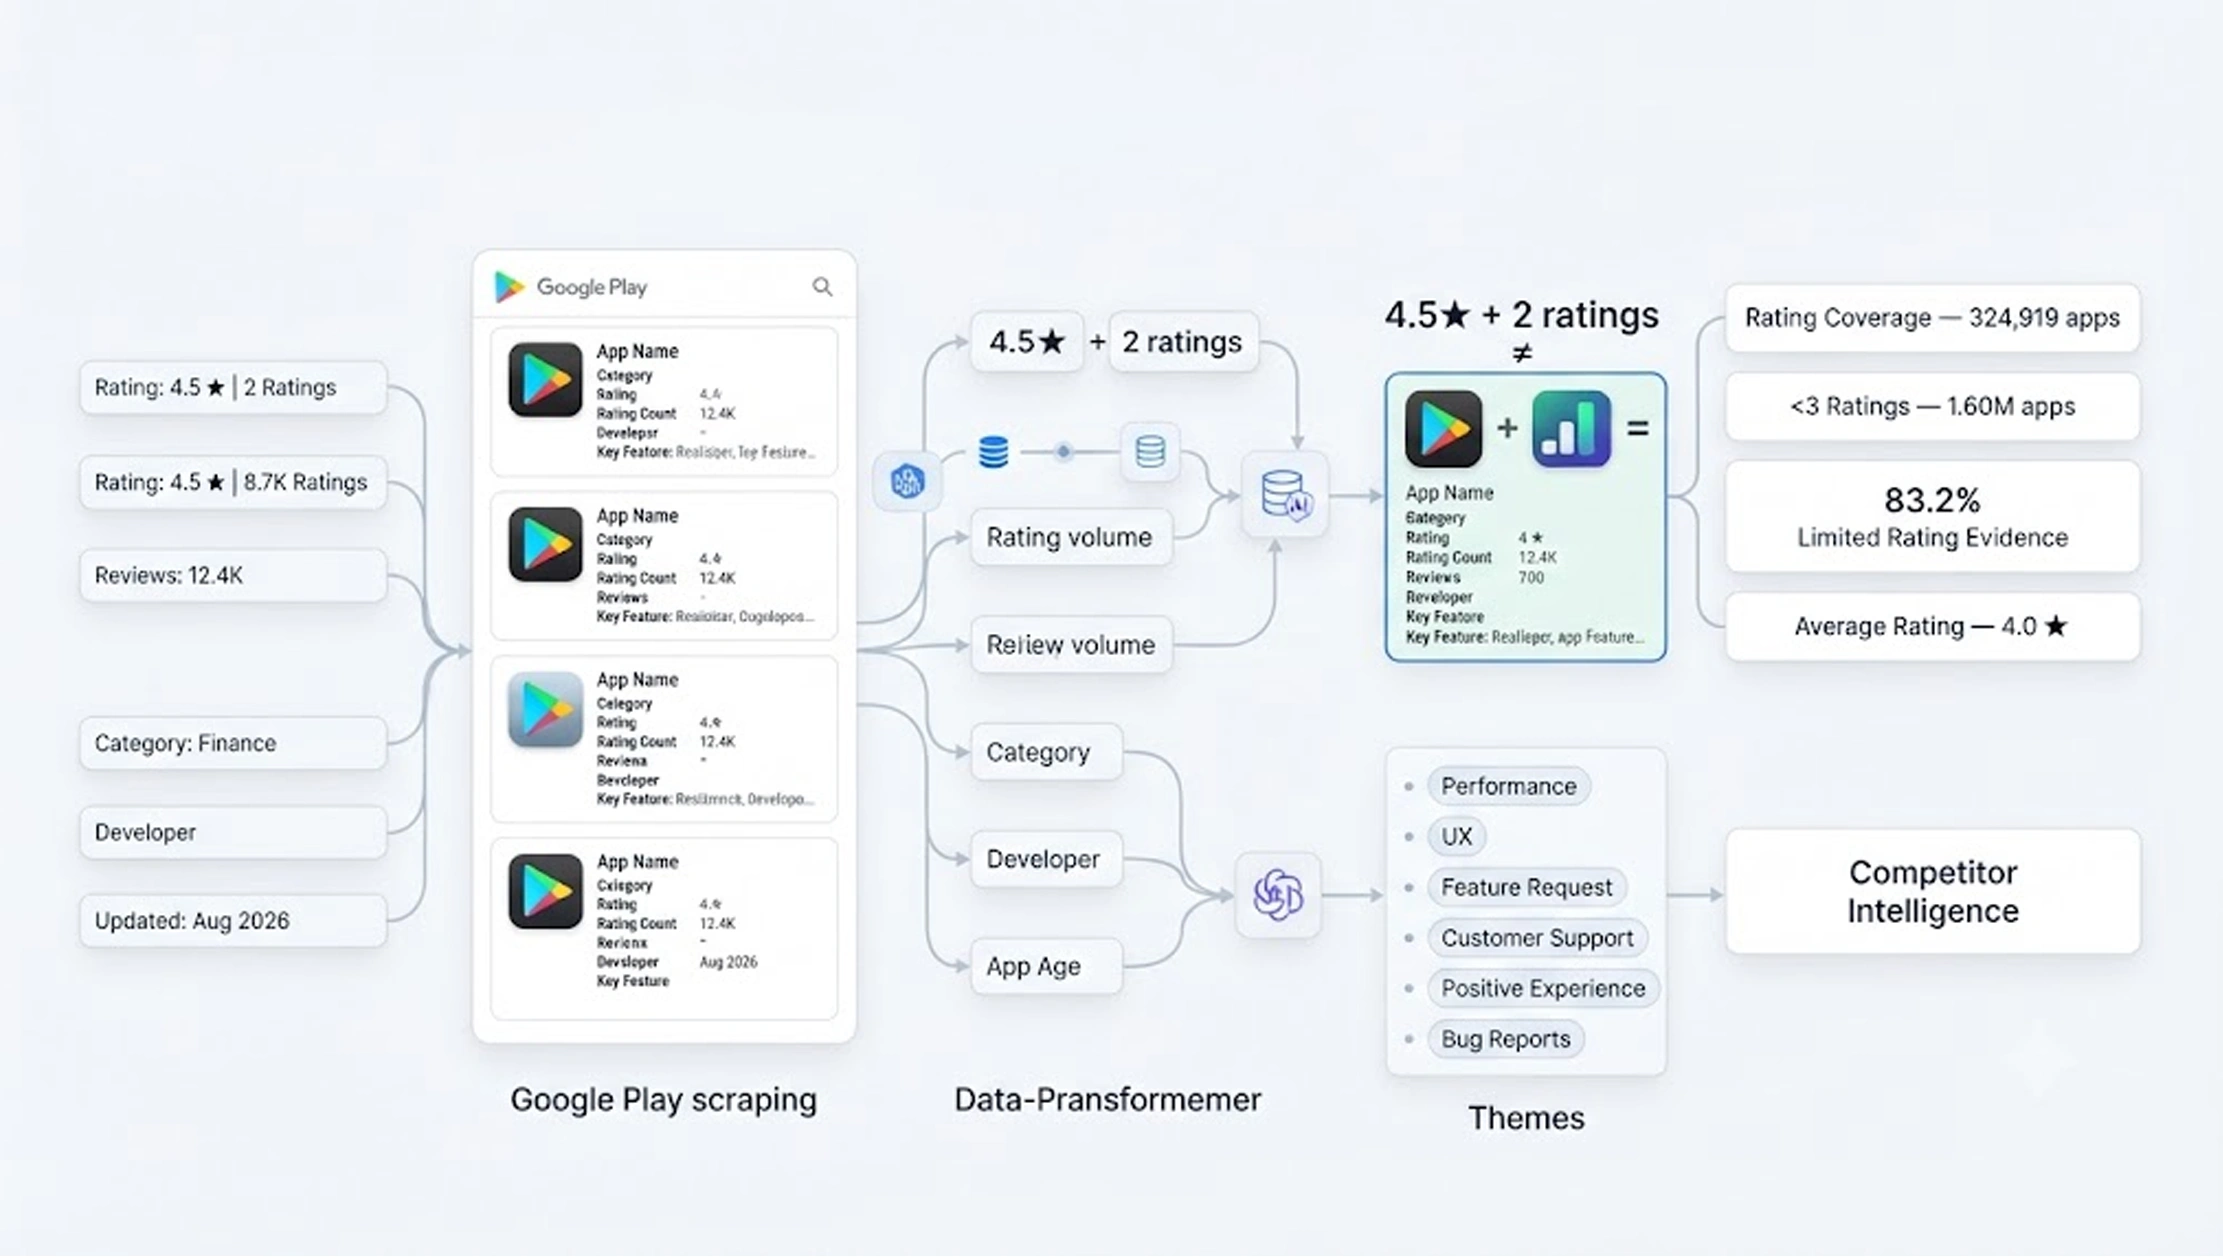
extract Google Play app data for brand research provides businesses with a structured way to examine how competing products are positioned and how users respond to them.
Ratings and reviews are particularly important because they provide a customer-generated perspective. AppBrain's August 2026 statistics show that approximately 324,919 Google Play applications had a rating, while about 1.60 million apps had fewer than three ratings. The average rating across apps was reported as 4.0 stars.
Real Data API Analysis: Rating Coverage
| Metric | Current figure | Real Data API Interpretation |
|---|---|---|
| Total Google Play apps | ~1.93M | Very large competitive universe |
| Apps with a rating | 324,919 | Only a minority have meaningful rating coverage |
| Apps with fewer than 3 ratings | 1,604,819 | Most apps have limited rating evidence |
| Share with fewer than 3 ratings | 83.2% | Rating volume is critical for comparison |
| Average rating | 4.0 stars | Aggregate rating alone is insufficient |
Figures are from AppBrain's August 2, 2026 statistics.
Real Data API Insight: The key finding is that a star rating should not be analyzed in isolation. If more than 80% of applications have fewer than three ratings, a 4.5-star application with only one or two ratings does not carry the same market signal as a 4.5-star application supported by thousands of ratings.
This creates an important opportunity for structured market research. A dataset can combine rating score with rating count, review count, category, developer, app age, and other available attributes. Researchers can then create more meaningful competitor benchmarks.
Review analysis adds another layer. Businesses can identify frequently occurring complaints, feature requests, usability problems, positive experiences, and recurring themes. These insights can help brands understand not only how users rate competitors, but also why they rate them that way.
For brand research, descriptions can also be analyzed alongside reviews. Researchers can compare the features companies promote with the features customers actually discuss. A competitor that emphasizes one feature in its listing but receives frequent complaints about another area may represent a potential market opportunity.
This combination of listing data and user-generated feedback transforms Google Play from an app directory into a source of customer and competitor intelligence.
Scaling Data Collection Through an API Architecture
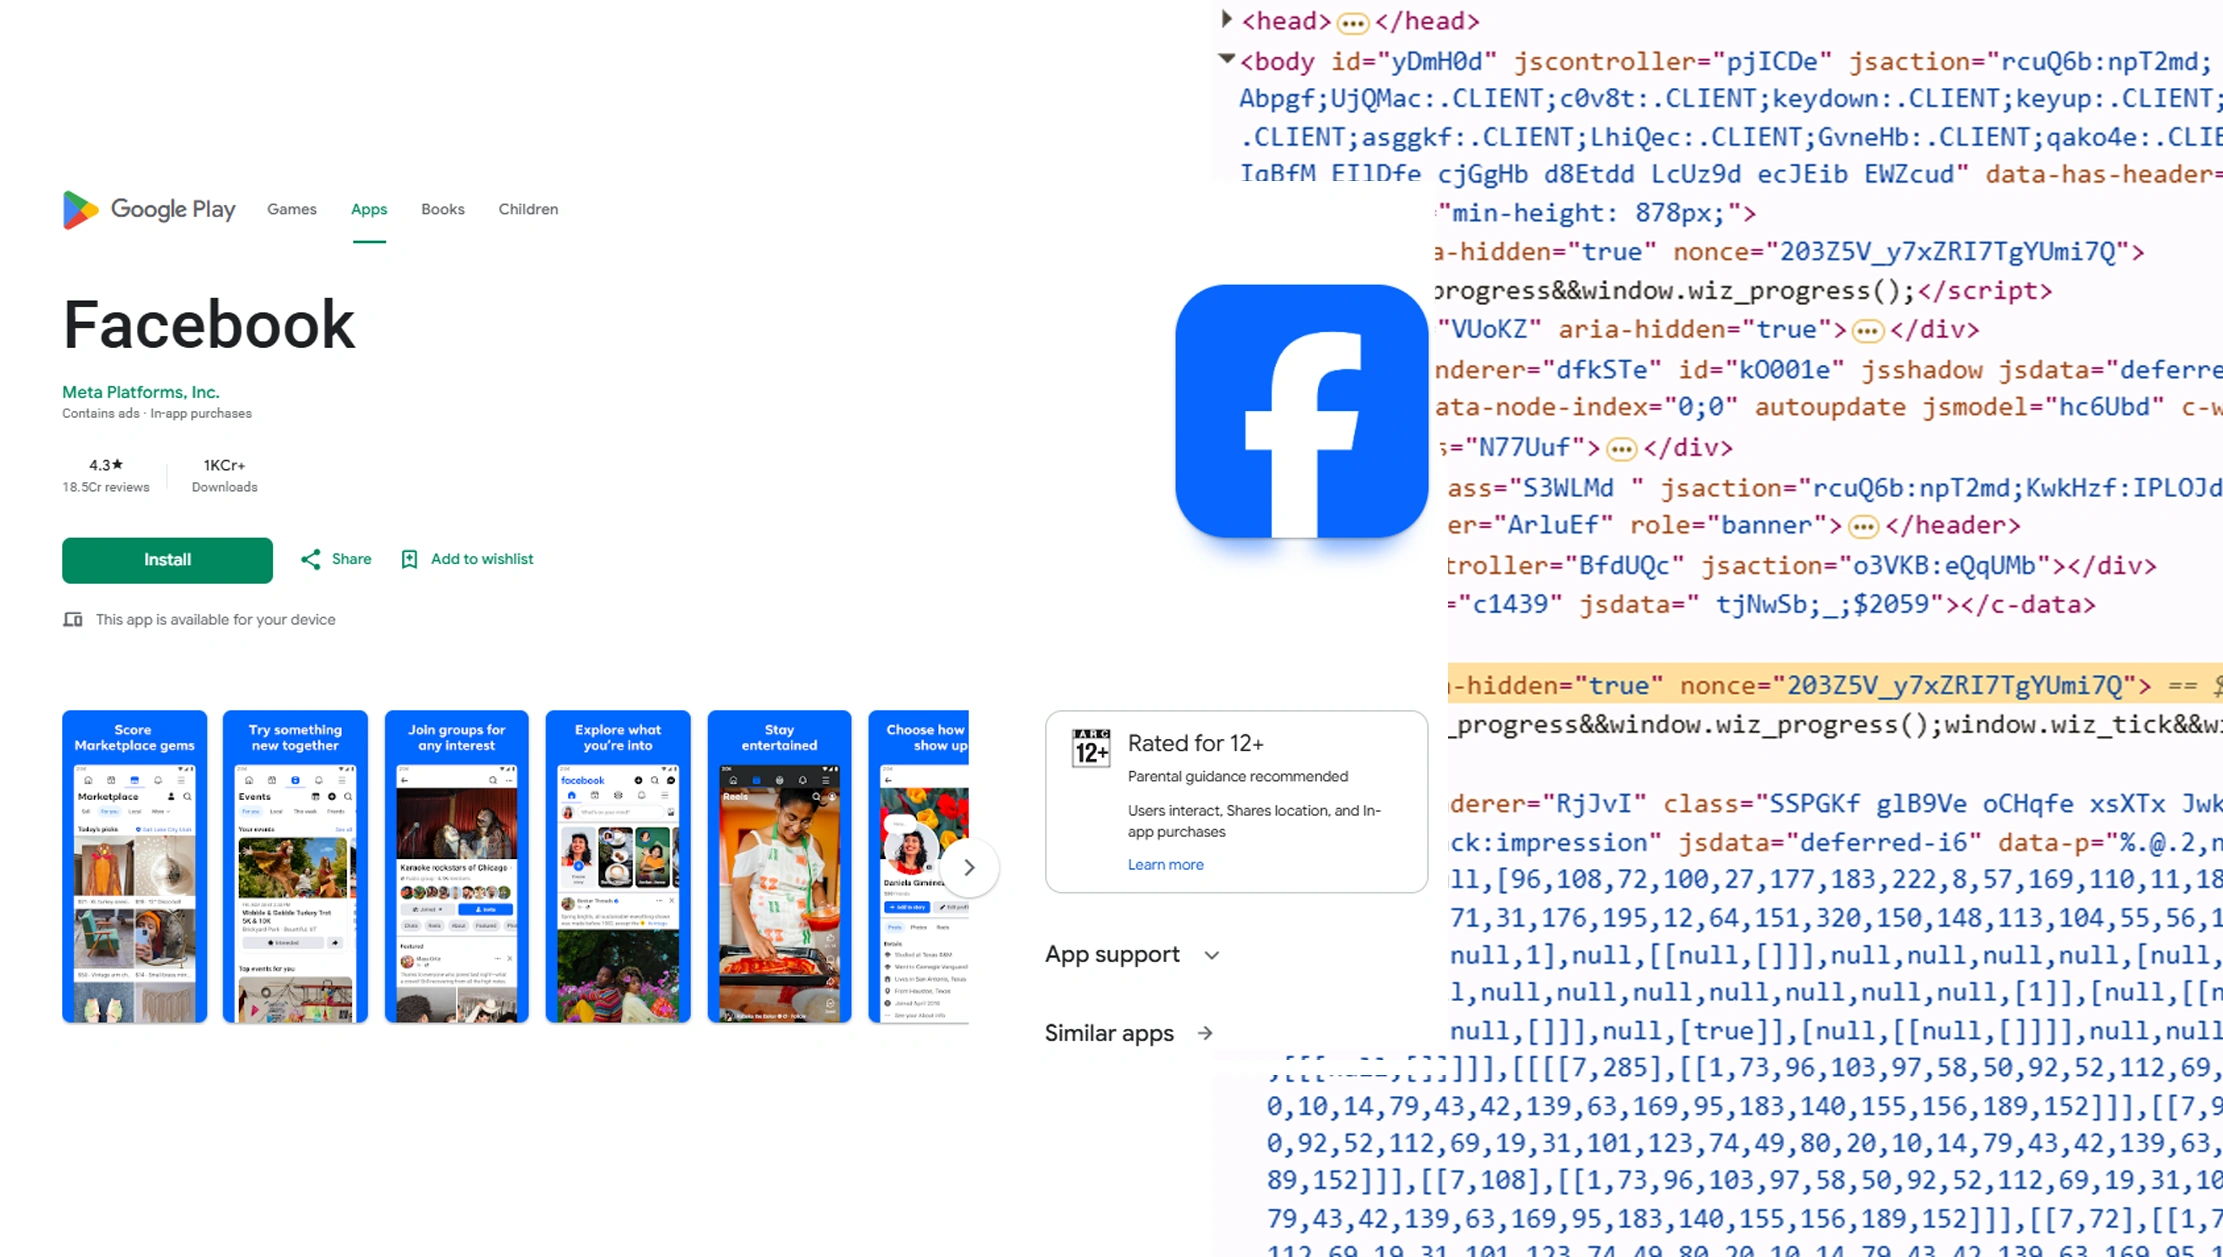
A web scraping API for Google Play app data can provide the infrastructure required to collect and organize large-scale application information. Instead of manually visiting individual pages, organizations can establish automated workflows that collect structured records according to defined research requirements.
The need for scalability becomes clearer when the current Google Play ecosystem contains nearly two million applications. AppBrain reported 1,922,006 available apps in July 2026.
Real Data API Analysis: Why Scale Matters
| Data Dimension | Example Research Metric | Business Value |
|---|---|---|
| Application | App name, URL, category | Competitor identification |
| Developer | Developer name and portfolio | Brand-level benchmarking |
| Ratings | Average rating and rating count | Product-quality comparison |
| Reviews | Review volume and themes | Customer sentiment |
| Pricing | Free/paid/subscription indicators | Monetization analysis |
| Listing | Description and metadata | Positioning analysis |
| Time | Historical snapshots | Trend detection |
Real Data API Insight: The value of API-based collection is not simply the ability to retrieve more records. It is the ability to standardize the same fields across thousands of applications and repeat the process over time.
For example, a market research team could collect a defined competitor set every week. The resulting snapshots could be compared to identify changes in rating scores, review volumes, descriptions, pricing, or availability. Over several months, these observations become a historical intelligence database.
API-driven workflows can also connect extraction with storage and analytics systems. Structured results can be transferred into databases, dashboards, spreadsheets, or business intelligence environments depending on the organization's technology stack.
Data validation remains important. Duplicate applications, missing fields, changed categories, removed listings, and inconsistent metadata should be handled before analysis. Once these controls are implemented, the resulting dataset can support recurring competitive research instead of one-time manual investigations.
The strongest approach therefore treats scraping as a data pipeline, not simply a collection script. Extraction, validation, storage, monitoring, and analysis should work together to produce consistent market intelligence.
Connecting Search Interest With App-Market Signals
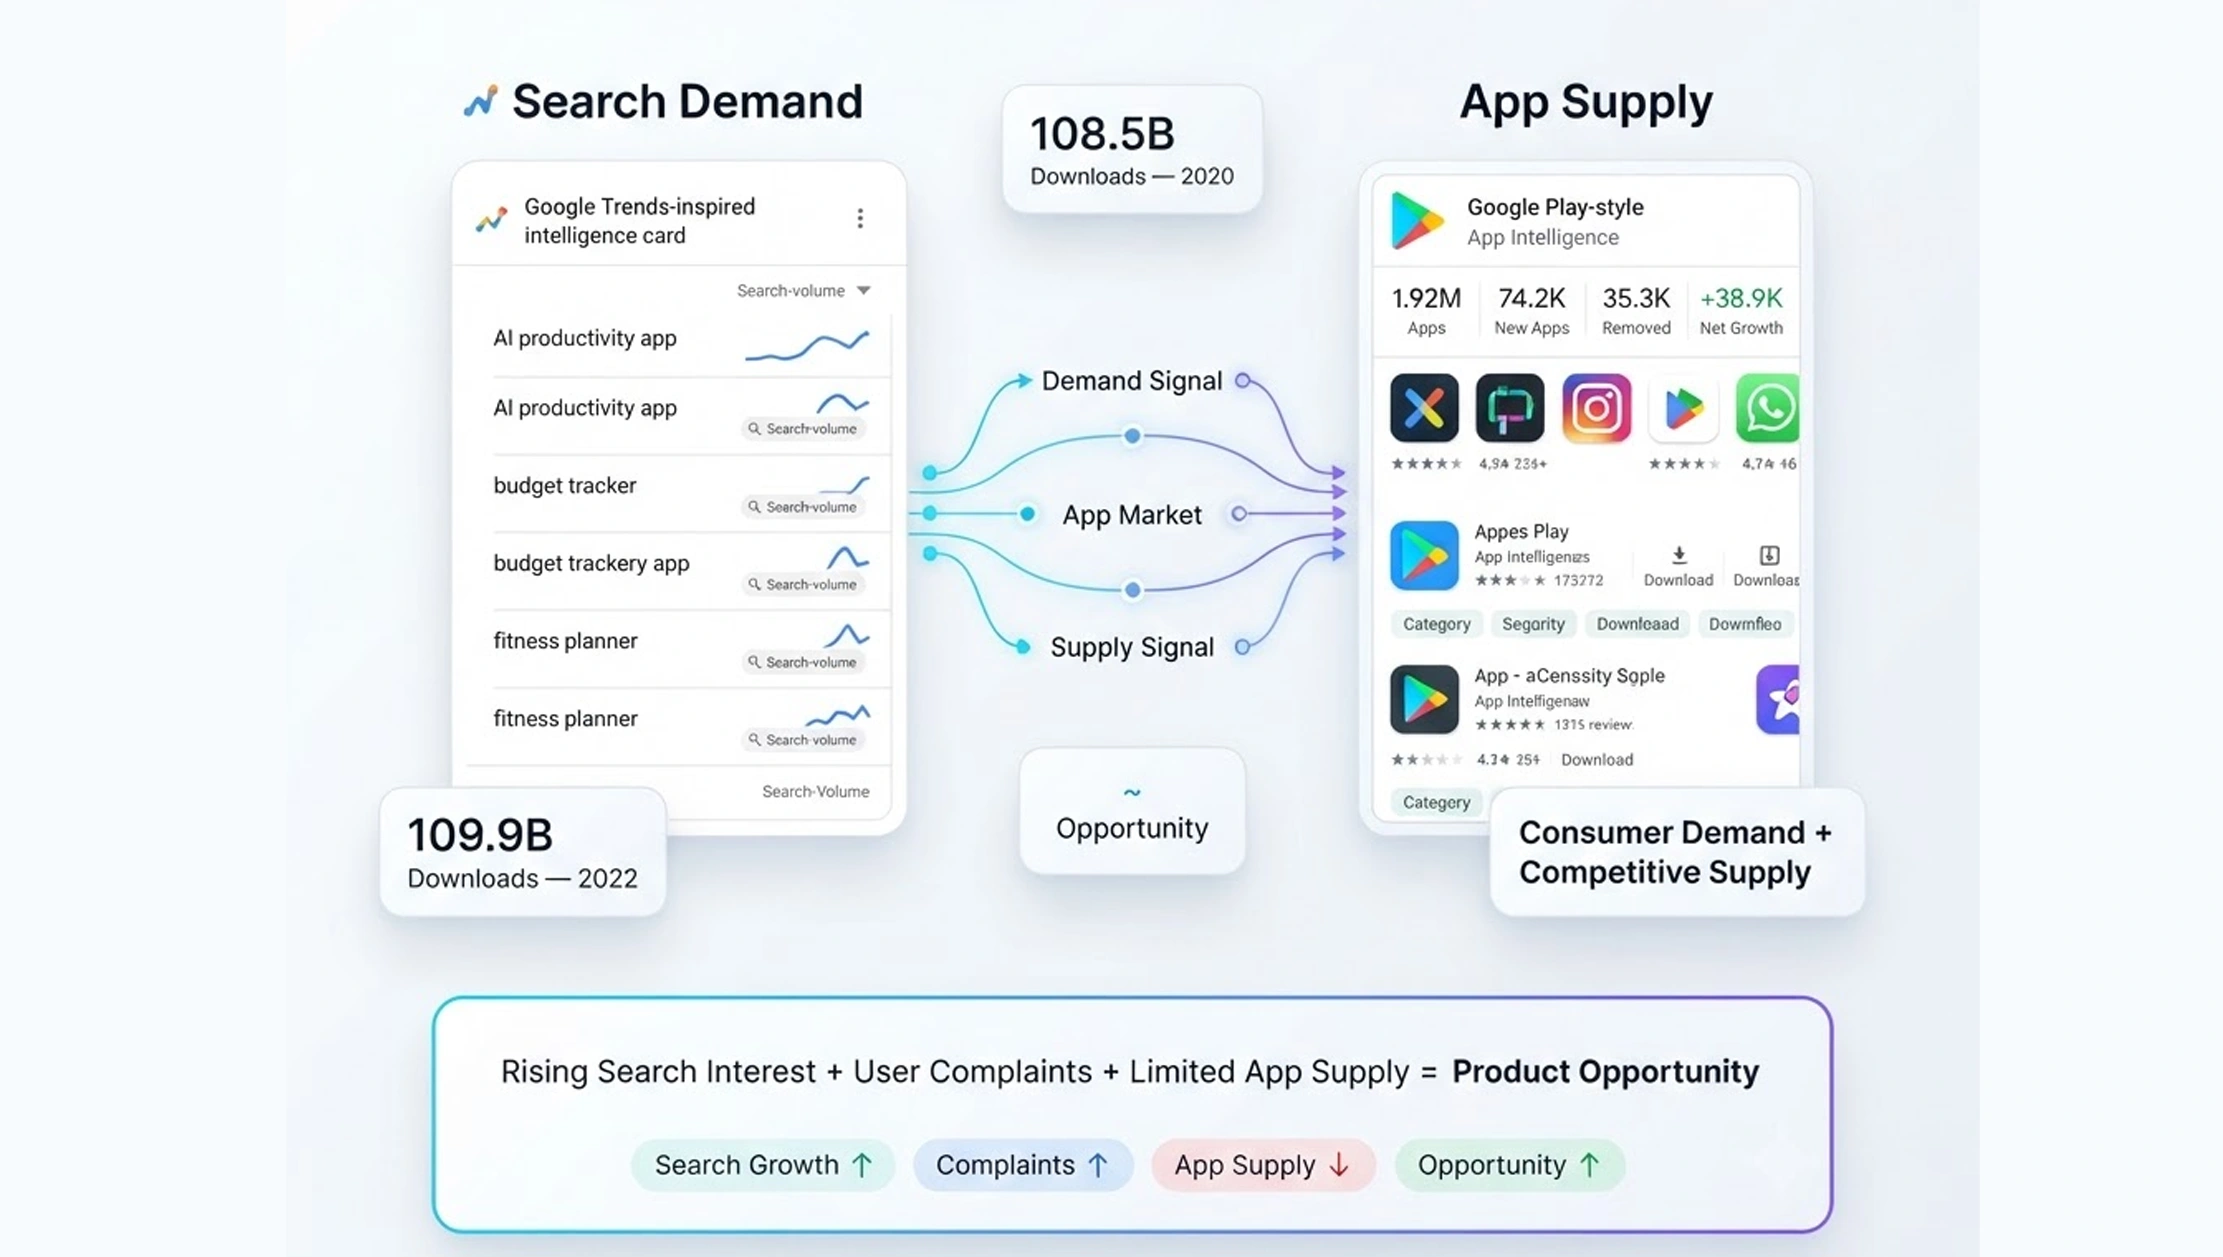
Google Trends Scraper data can complement app-store intelligence by providing a separate view of consumer search interest. Search behavior can show what people are actively looking for, while Google Play data can reveal what applications are available to satisfy that demand.
This creates a useful demand-versus-supply framework. A rising search topic combined with increasing app launches could indicate a developing market. Conversely, strong search interest with relatively limited application supply could indicate an opportunity for new product development.
Real Data API Analysis: Demand and Supply Signals
| Signal | Data Observation | Real Data API Interpretation |
|---|---|---|
| Google Play apps | 1.92M in July 2026 | Large competitive supply |
| New apps, June 2026 | 74.2K | Strong ongoing product creation |
| Apps removed, June 2026 | 35.3K | Significant competitive turnover |
| Net monthly growth | +38.9K | Overall supply expanded |
| Google Play downloads, 2020 | 108.5B | Extremely high consumer adoption |
| Google Play downloads, 2021 | 111.4B | +2.7% annual growth |
| Google Play downloads, 2022 | 109.9B | -1.3% annual movement |
Google Play download figures for 2020-2022 come from Sensor Tower's Store Intelligence data.
Real Data API Insight: Download activity remained above 100 billion annually across 2020-2022, while the number of applications available on Google Play has changed substantially. This suggests that consumer demand and app supply should be monitored as separate market indicators.
The same principle applies to search behavior. A business should not interpret rising search interest as guaranteed product demand. Instead, it should compare search activity with app launches, review growth, ratings, competitive density, and user complaints.
For example, if searches for a particular functionality are increasing while existing applications receive repeated complaints about that functionality, the combined dataset could identify a potentially attractive product opportunity.
This is where multi-source data analysis becomes valuable. Google Play data explains the competitive product landscape, while search data provides a demand-side perspective. Together, they can create a stronger market research model than either source alone.
Building a Repeatable Research and Monitoring System
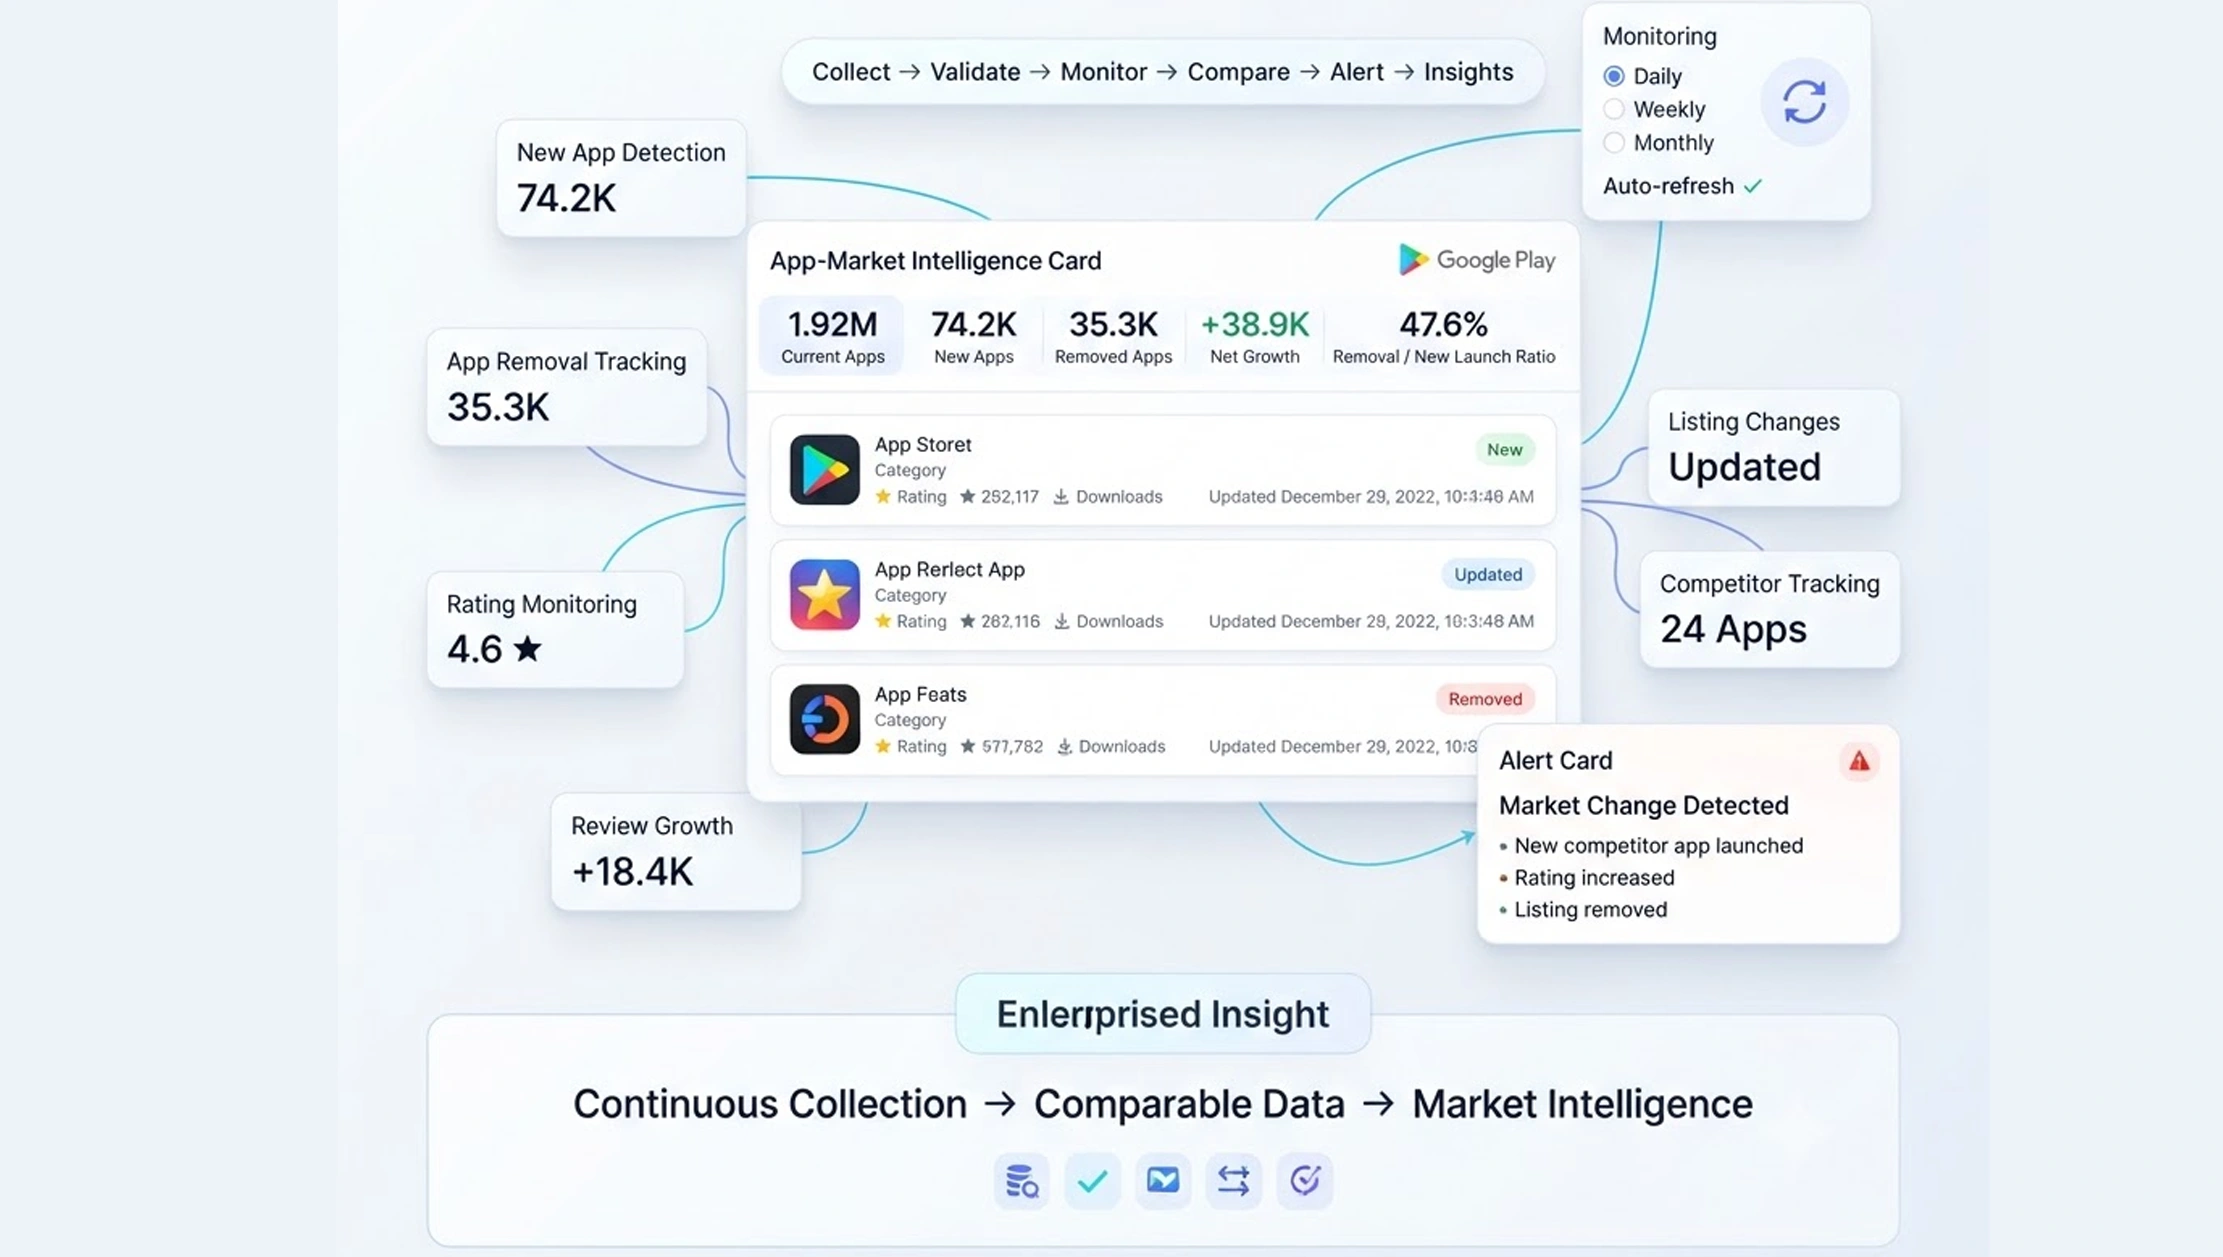
Web Scraping Services can help organizations convert application data collection into an ongoing market intelligence process. Instead of conducting research manually every few months, businesses can establish scheduled extraction and monitoring workflows.
The current ecosystem demonstrates why recurring monitoring matters. AppBrain reported 74.2 thousand new applications and 35.3 thousand removed applications in June 2026 alone.
Real Data API Analysis: Monthly Market Dynamics
| Indicator | June 2026 | What Real Data API Analysis Reveals |
|---|---|---|
| New applications | 74.2K | High developer entry activity |
| Removed applications | 35.3K | Significant market attrition |
| Net growth | +38.9K | Supply expanded overall |
| Removal/new-launch ratio | ~47.6% | Almost half as many apps were removed as launched |
| Current app base | 1.92M | Large addressable competitive landscape |
Calculations use AppBrain's June/July 2026 figures.
Real Data API Insight: The monthly figures demonstrate why static market research can become outdated quickly. In one month, tens of thousands of applications entered or left the ecosystem. A company relying on a once-a-year competitor dataset could therefore miss significant market movements.
A recurring workflow can monitor application launches, removals, ratings, review counts, listing changes, categories, and competitor portfolios. Organizations can then create alerts around the metrics most relevant to their business.
For an app publisher, this could mean monitoring competing applications. For an investor, it could mean identifying emerging categories and developer activity. For a consumer brand, it could mean analyzing applications related to a particular customer segment. For a research agency, it could mean maintaining reusable datasets for multiple clients.
The key advantage is consistency. Every collection cycle can use the same fields, filters, and validation rules. This creates comparable datasets that can support time-series analysis and reliable reporting.
Ultimately, the objective is to create a market intelligence system where raw application data is continuously transformed into business insights.
Why Choose Real Data API?
Real Data API can provide a scalable foundation for organizations that need structured web data for market research, competitive intelligence, and analytics. A data-collection solution becomes more valuable when it supports repeatable extraction, structured outputs, scalable workflows, and integration with downstream analysis.
A Scraping Browser API can support browser-based collection workflows where websites rely on dynamic rendering and changing page structures. For businesses conducting Google Play web scraping for market research, this type of infrastructure can help turn application information into structured datasets suitable for recurring analysis.
The important distinction is between simply collecting data and building an intelligence workflow. Real Data API can be positioned around the complete process: collecting relevant records, organizing the data, supporting recurring extraction, and making the output useful for market research.
This approach can help businesses monitor competitors, evaluate app categories, analyze ratings and reviews, identify emerging trends, and build historical datasets. Instead of relying on isolated manual observations, organizations can establish a repeatable data layer that supports ongoing decision-making.
Conclusion
Google Play represents a large and continuously changing source of market intelligence. Current data shows nearly two million available applications, while tens of thousands of new applications can enter the ecosystem within a single month. At the same time, substantial numbers of applications are removed, demonstrating that competitive supply is constantly changing.
The rating data also shows why deeper analysis is necessary. With the majority of applications having fewer than three ratings, businesses need to consider rating volume, reviews, categories, developer information, and other signals rather than relying on star ratings alone.
Google Play web scraping for market research gives organizations the opportunity to build structured, repeatable datasets that can support competitive intelligence, brand research, trend analysis, customer sentiment analysis, and product strategy.
The Real Data API analysis framework demonstrates how raw marketplace statistics can be transformed into actionable business observations. By combining recurring application data with ratings, reviews, competitive information, and external demand signals, organizations can develop a more complete understanding of the mobile app market.
Start building your Google Play data intelligence workflow with Real Data API and transform app listings, ratings, reviews, and market signals into actionable research insights!
Latest posts
How Myntra Fashion Dataset Solves Fashion Intelligence Challenges Across Products, Prices, Brands, and Fashion Market Trends?
How Hyatt Travel Dataset Helps Businesses Track Hotels, Room Prices, Amenities, Locations, and Travel Trends?

How Louis Vuitton Fashion Dataset Enables Better Analysis of Luxury Products, Prices, Brands, and Fashion Trends?
How Blinkit Grocery Dataset Enables Smarter Analysis of Products, Prices, Availability, and Quick-Commerce Trends?






.png)



