.gif)
.gif)
Quick Summary
- How Datasets Are Shaping the Future 2026 explains how connected, accurate information helps businesses identify market changes, understand customers, and make better decisions.
- Learn how structured collection, validation, and integration turn scattered online information into useful business intelligence.
- Explore practical applications, verified industry statistics, and ways to build a reliable data pipeline using a Web Scraping API.
Introduction
How Datasets Are Shaping the Future 2026 comes down to one business priority: turning scattered information into reliable insights that support faster, more confident decisions. Companies often collect product prices, stock levels, customer preferences, competitor activity, and market signals from separate websites and platforms. When these records use different formats or update schedules, teams struggle to compare them and may act on incomplete information.
A well-designed data strategy brings these sources into a consistent structure. It helps analysts compare products, monitor changing prices, identify demand patterns, and understand how competitors position their offerings. A Web Scraping API can support this process by collecting publicly accessible website information in a structured format, subject to applicable website terms, access controls, and legal requirements.
The real value is not simply collecting more information. It is ensuring that records are accurate, traceable, timely, and relevant to a specific business question. For retailers, marketplaces, manufacturers, and research teams, this can mean fewer manual spreadsheets and a clearer view of market conditions.
How can businesses collect information from multiple online sources?
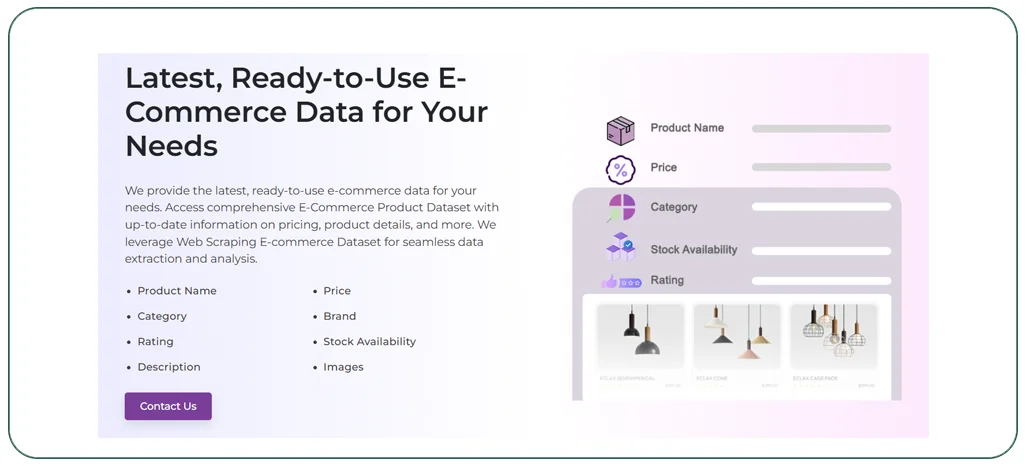
Businesses can extract datasets from websites to monitor product details, pricing, availability, property listings, travel rates, and other market signals. The challenge is that every source may organize information differently. One retailer may display a price with a currency symbol, another may separate currency and amount, while a third may show promotional pricing alongside the standard price. Without normalization, comparisons can become unreliable.
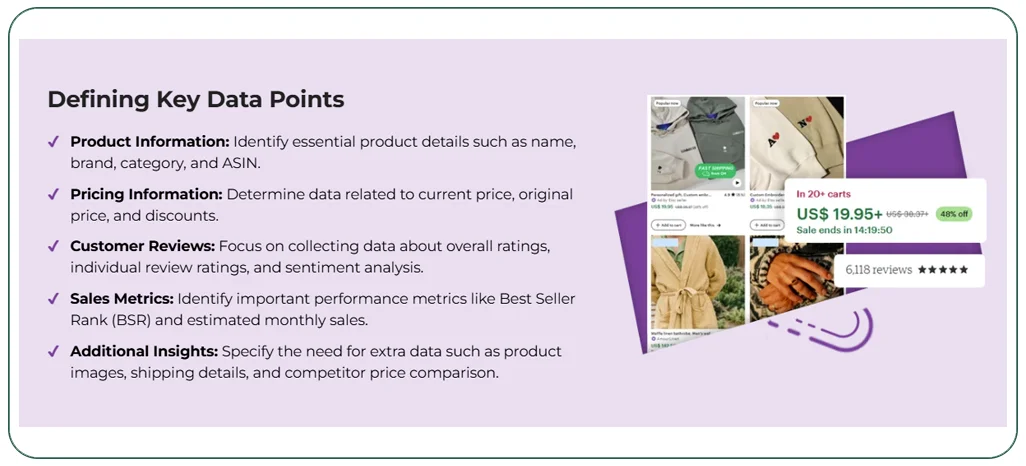
A practical collection workflow starts by defining the business question and the exact fields required. For a retail comparison project, these might include product name, brand, model number, price, currency, stock status, seller, product URL, and collection timestamp. The next step is to map each source field to a common schema, validate the extracted values, and retain source references for auditing.
The wider adoption of digital commerce makes this work increasingly relevant. The U.S. Census Bureau’s annual data show that U.S. retail trade e-commerce sales increased from approximately $784.6 billion in 2020 to $1.183 trillion in 2024. These figures measure sales, not scraping activity, but they demonstrate the growing scale of online retail information that businesses may need to interpret.
How Datasets Are Shaping the Future 2026 is reflected in this shift from isolated web records to reusable, structured information. Collection alone is not enough: teams need validation rules, update schedules, and clear documentation.
| Reference year | U.S. retail trade e-commerce sales |
|---|---|
| 2020 | $784.6 billion |
| 2021 | $916.4 billion |
| 2022 | $972.3 billion |
| 2023 | $1.083 trillion |
| 2024 | $1.183 trillion |
| 2025 | Not included in this annual series |
| 2026 | Not included in this annual series |
Source: U.S. Census Bureau annual data, distributed through FRED. Figures are annual and not seasonally adjusted. The 2025 and 2026 annual values are omitted rather than estimated.
For decision-makers, the actionable lesson is to prioritize a small set of high-value fields, establish consistent definitions, and measure missing or invalid records before expanding collection.
Why are connected market signals important for competitive decisions?
Real-time marketplace datasets help businesses understand what is changing across sellers, categories, and regions. A retailer may need to know whether a competitor has reduced a product price, whether an item has gone out of stock, or whether a new seller has entered a category. A manufacturer may track assortment changes and the frequency of product launches. These signals become more useful when they can be compared across sources and over time.
However, “real time” should be defined according to the business decision. A fast-moving product category may require hourly checks, while a property market research project may need daily or weekly updates. Collecting information more frequently than necessary can increase cost without improving the decision.
A connected dataset should preserve the timestamp of each observation. This allows analysts to distinguish a current price from an older record and to identify how long a listing remained available. It should also retain currency, location, seller identity, and product identifiers where available. Without those details, two records that appear similar may refer to different products or market conditions.
The business value comes from comparing consistent observations, not simply accumulating rows. Teams can use change histories to investigate price movements, identify recurring stock gaps, and examine whether assortment changes coincide with shifts in demand. These analyses should be treated as evidence for investigation rather than automatic proof of cause and effect.
The European Commission’s 2026 Digital Decade reporting states that the share of EU enterprises using data analytics increased from 33.25% in 2023 to 39.85% in 2025. This indicates wider business use of analytics, while also showing that adoption is not yet universal.
For competitive intelligence teams, the practical priority is to establish comparable definitions across sellers and markets before drawing conclusions from apparent differences.
How does an API make information easier to use?
A real-time datasets API can deliver structured records to internal dashboards, analytics platforms, data warehouses, and business applications. Instead of repeatedly downloading files and manually combining them, teams can connect collection workflows to the systems where decisions are made.
A typical pipeline includes source discovery, page retrieval, parsing, field normalization, validation, storage, and delivery. Each stage should have a clear purpose. Parsing identifies the relevant fields; normalization converts values into consistent formats; validation checks for missing or implausible records; and storage preserves both current values and historical observations.
How Datasets Are Shaping the Future 2026 also involves making information accessible to the people and systems that need it. An API can help standardize delivery through predictable endpoints, response formats, authentication, pagination, and error handling. For example, a dashboard could request product records for a defined category, while a warehouse pipeline could retrieve incremental changes since its previous update.
API design should account for rate limits, retries, duplicate records, schema changes, and source outages. Monitoring should report not only whether a request succeeded, but also whether the returned data passed quality checks. A successful HTTP response does not automatically mean the extracted information is complete or correct.
The OECD reported that 20.2% of firms across OECD countries with available data used AI in 2025, compared with 14.2% in 2024 and 8.7% in 2023. This is a measure of AI use by firms, not API adoption, but it illustrates the growing relevance of structured information to technology-enabled business processes.
Want to connect fragmented sources to a consistent data workflow? Define the fields and update frequency your team needs before selecting a collection and delivery approach.
Get Insights Now!What makes collected information reliable enough for analysis?
Web scraping datasets are useful only when businesses can assess their accuracy, coverage, freshness, and consistency. A large collection can still produce poor decisions if it contains duplicate products, outdated prices, mismatched identifiers, or missing location details.
Quality control should begin with field-level rules. Product prices should be numeric and paired with a currency. Dates should use a consistent time zone and format. Stock status should follow a defined vocabulary, such as “in stock,” “out of stock,” or “unknown.” Product matching should use stable identifiers where available, supported by attributes such as brand, model, size, and variant. Similar names alone are not enough to confirm that two listings represent the same item.
A useful quality framework includes:
- Completeness: Measure the proportion of records containing required fields.
- Validity: Check whether values match expected formats and allowed ranges.
- Consistency: Confirm that units, currencies, categories, and naming conventions align.
- Freshness: Record when each item was last observed and define acceptable data age.
- Uniqueness: Detect repeated records and distinguish duplicates from legitimate variants.
- Traceability: Retain source URLs, timestamps, and processing history.
Businesses should also maintain a record of failed pages and extraction exceptions. This helps distinguish a genuine absence of information from a technical collection failure. When source pages change, monitoring can detect sudden drops in field coverage or unexpected shifts in record counts.
A reliable quality process does not mean every source will always provide complete information. It means limitations are visible, measurable, and considered before analysis. Teams can then exclude uncertain records, flag them for review, or report confidence levels alongside results.
How can organizations turn disconnected records into a shared business asset?
Datasets become more valuable when teams can combine information from different sources without losing its meaning. A retailer, for example, may maintain separate systems for product catalogs, supplier information, competitor prices, and inventory. If each system uses different product names, identifiers, or category structures, analysts may struggle to create a dependable view of the market.
The first step is to define a common data model. This model should specify field names, formats, allowed values, identifiers, and relationships between records. A product master can then connect listings from different sellers to a standardized product identity, while retaining each seller’s own listing details. This approach makes it possible to compare equivalent products without discarding source-level differences.
The second step is to establish data ownership and update rules. Teams should know which system is authoritative for each field, how conflicts are resolved, and how historical changes are retained. For example, a product description may be maintained in a catalog system, while observed seller prices are stored as time-stamped market records.
The EU’s 2025 enterprise statistics show that 39.85% of enterprises used data analytics, either through their own employees or an external provider. The same reporting found a significant size gap: 78.84% of large enterprises performed analytics using their own employees, compared with 27.86% of small enterprises.
These figures highlight why organizations should make data processes repeatable and accessible, rather than relying only on specialist knowledge held by a few employees.
How Datasets Are Shaping the Future 2026 is not simply about collecting more information. It is about making records interoperable, governed, and useful across business functions. A shared data foundation helps commercial, operations, and research teams work from consistent definitions.
How can structured information improve business research?
Market Research becomes more actionable when analysts can compare evidence across companies, channels, products, and time periods. Traditional research may combine surveys, interviews, public reports, and manually gathered online information. Structured web data can complement these methods by providing observable details about listings, prices, product attributes, availability, and changes in online assortments.
For a retail research team, this can support category comparisons and help identify gaps in product coverage. For a travel company, it may support route and fare observations across booking channels. For real estate analysts, structured listing information can help compare asking prices, property characteristics, and geographic patterns. In each case, the dataset must clearly identify what it measures. An advertised price, for instance, should not automatically be interpreted as a completed transaction price.
A strong research process should document the collection date, geographic coverage, source selection, field definitions, exclusions, and known limitations. Analysts should also separate observed facts from interpretations. If prices change during a period, the data can show the movement; additional evidence is needed to explain why it happened.
The U.S. Census Bureau’s e-commerce statistics provide one example of how official time series can support market context. Its quarterly retail e-commerce release reported that online sales represented 16.3% of total U.S. retail sales in the second quarter of 2025. This is an official estimate for a defined period and geography, not a universal measure of global online commerce.
For research teams, the key is to combine structured observations with credible contextual sources and transparent methodology. This makes findings easier to verify, reproduce, and communicate to business stakeholders.
Why Choose Real Data API?
Businesses need more than raw information. They need a repeatable approach to collecting, organizing, validating, and delivering records that support specific decisions. A capable data partner should understand the business question first, then design the extraction and delivery process around the required sources, fields, coverage, and update schedule.
Key Use Cases can include competitor price monitoring, product catalog comparison, seller and assortment tracking, inventory observation, property listing analysis, and travel market monitoring. Each use case requires its own data model and quality checks. Product matching is important for retail comparisons, while location normalization and property attributes may be more important for real estate research.
How Datasets Are Shaping the Future 2026 also highlights the need for flexible data infrastructure. Businesses may begin with a focused collection project and later expand to additional websites, categories, regions, or delivery formats. A scalable workflow should therefore support structured outputs, consistent field definitions, source tracking, and clear error reporting.
A practical evaluation checklist for a data provider includes:
- Source coverage: Can the provider work with the relevant public sources and required regions?
- Field mapping: Are requested fields defined and delivered consistently?
- Data validation: Are missing, duplicated, and malformed records identified?
- Update frequency: Can the schedule match the pace of the business decision?
- Integration: Can the output connect to existing databases, dashboards, or analytics tools?
- Transparency: Are collection limitations, timestamps, and source references documented?
The right approach is one that makes data dependable and useful, while respecting source restrictions, privacy requirements, and applicable laws.
Conclusion
How Datasets Are Shaping the Future 2026 is ultimately about converting scattered information into a reliable foundation for business decisions. As online markets expand and analytics becomes more widely used, companies need consistent methods to collect, validate, connect, and interpret information from multiple sources.
The most effective strategy begins with a clear business question, a defined data schema, measurable quality checks, and an update schedule that reflects real operational needs. Businesses should also preserve source details and timestamps so that findings can be audited and interpreted correctly.
For organizations looking to reduce manual collection and build structured market intelligence, Real Data API can support a data workflow designed around relevant sources, required fields, and practical delivery needs.
Ready to turn fragmented online information into actionable market insights? Contact Real Data API to discuss your data requirements and build a structured collection approach for your business!
FAQs
1. How Datasets Are Shaping the Future 2026 in business decision-making?
They help organizations combine reliable information, identify patterns, monitor changes, improve forecasting, and make informed decisions using consistent evidence rather than disconnected records and assumptions.
2. How does a Web Scraping API support business intelligence?
A Web Scraping API collects accessible website information and delivers structured records that businesses can validate, organize, analyze, and integrate into their internal systems.
3. Why do companies extract datasets from websites?
Companies collect online product, pricing, availability, and listing information to understand competitors, monitor market changes, compare offerings, and support research with observable evidence.
4. What are the benefits of real-time marketplace datasets?
They help businesses monitor changing prices, product availability, seller activity, and assortment updates, supporting timely comparisons and better-informed commercial decisions across online marketplaces.
5. How can Real Data API deliver a real-time datasets API solution?
Real Data API can help define source coverage, required fields, validation rules, update schedules, and structured delivery formats based on a business's specific data requirements.
Latest posts
How to Extract Real Estate Datasets from Property Websites 2026 to Solve Property Price Inconsistencies
How Datasets Are Shaping the Future 2026 - Turning Fragmented Business Data into Actionable Market Insights
How Fashion Datasets Are Driving Market Intelligence in 2026 to Identify Consumer Trends and Emerging Fashion Brands
Etsy Product Data Scraping for the USA




.png)


