Quick Summary
- Netflix dataset analysis for streaming content trends helps streaming businesses understand catalog composition, genre distribution, release patterns, regional representation, and content availability to support informed programming decisions.
- A structured Netflix Web Scraping Service can organize publicly accessible content information into research-ready datasets, helping analysts identify catalog gaps, benchmark competitors, and evaluate changes in streaming libraries.
- Historical analysis from 2020–2026 provides a framework for understanding content strategy shifts and developing evidence-based recommendations for acquisition, localization, and catalog planning.
Introduction
Netflix dataset analysis for streaming content trends helps streaming businesses understand how catalogs evolve, which genres receive attention, and where content opportunities may exist. For OTT executives, content acquisition managers, market researchers, and data analysts, structured streaming data offers a practical foundation for examining release patterns, language distribution, movie and series availability, and shifts in catalog composition.
Netflix operates in a rapidly evolving global entertainment market. The company reported approximately 302 million paid memberships at the end of 2024, illustrating the scale of its international audience. By the end of 2025, Netflix reported more than 325 million paid memberships. These figures highlight why content decisions require systematic analysis rather than relying exclusively on intuition. Netflix publishes information about its business and viewing performance, while third-party datasets can provide additional catalog-level information for research.
A reliable Netflix Web Scraping Service can organize permitted, publicly accessible listing information into structured records for historical comparisons and market research. Depending on availability, those records may include titles, genres, release years, country labels, content classifications, durations, and listing URLs. Analysts can then use the data to compare catalog composition, study regional differences, identify underrepresented categories, and develop stronger content strategies.
The central objective is not to assume that catalog size alone predicts success. It is to combine consistent data collection with clear research questions, appropriate metrics, and reliable evidence to understand how content choices align with audience and business objectives.
How can catalog composition reveal content opportunities?
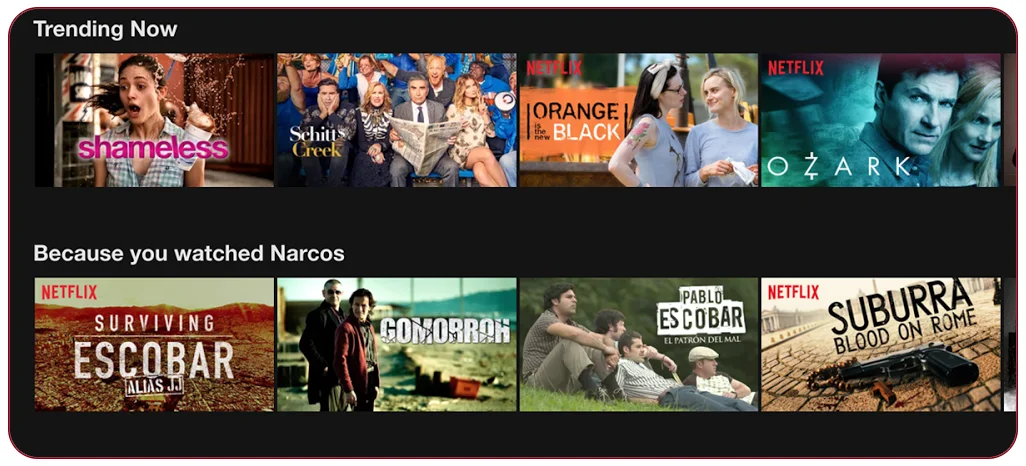
Netflix OTT catalog data scraping helps researchers examine the composition of a streaming library across genres, countries, languages, release years, and content formats. For streaming businesses, this information can reveal catalog concentration, underrepresented categories, and changes in the balance between movies and television series.
A useful analysis starts with a consistent dataset containing title, content type, genre, release year, country, language where available, maturity rating, runtime, and collection date. Analysts can group titles by year or genre to understand how the available catalog changes over time. They can also compare regional catalogs where the necessary information is available.
Practical catalog analysis metrics
| Metric | What it helps identify |
|---|---|
| Genre share | Categories occupying the largest portion of a catalog |
| Movie-to-series ratio | Balance between films and episodic content |
| Release-year distribution | Older titles versus newer releases |
| Country representation | Geographic diversity of available content |
| Language coverage | Opportunities for localized programming |
| Catalog change rate | How quickly the observed library changes |
2020–2026 research context
Netflix's published viewing reports offer real-world evidence that catalog analysis should consider audience engagement, not just title counts. In the second half of 2025, viewers watched approximately 96 billion hours of Netflix content. Non-English-language titles represented more than one-third of total viewing, with Korean, Spanish, and Japanese productions among the prominent categories.
This evidence illustrates why researchers should compare catalog representation with actual viewing performance wherever comparable data is available. A large number of titles in a category does not automatically mean that the category receives the most viewing. Similarly, a smaller regional catalog may include titles that perform strongly with specific audiences.
For 2020–2026 studies, businesses should distinguish between catalog snapshots and continuous historical records. A current catalog cannot reliably reconstruct which titles were available in every earlier year. Dated observations, archived records, and official engagement reports provide a stronger basis for evaluating catalog evolution. Combining these sources helps content teams identify possible acquisition opportunities without treating catalog gaps as proof of unmet demand.
How can television series data improve programming decisions?
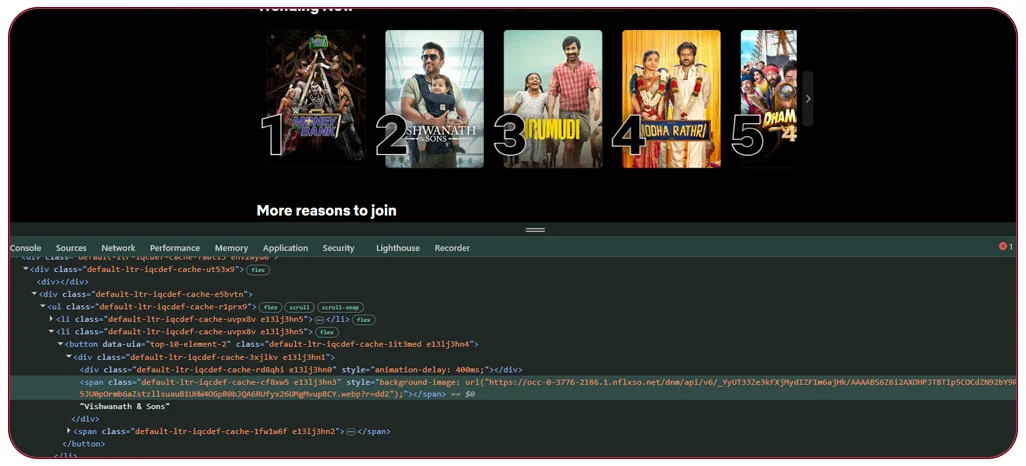
Netflix TV series dataset for analytics gives researchers a way to study episodic content separately from films. This distinction matters because a television series may attract viewers over multiple seasons, while a movie usually has a single primary runtime and release event.
A well-organized series dataset can include show title, season count where available, release year, genre, language, country of origin, episode count, episode duration, maturity classification, and available viewing metrics. Analysts can use these attributes to compare limited series, long-running franchises, new releases, and returning seasons.
For example, a content strategist may investigate whether series with several seasons contribute to sustained engagement or whether newer limited series provide stronger short-term viewing. To answer such questions reliably, the dataset must distinguish title-level records from season-level and episode-level records. Otherwise, a multi-season show may be counted as one title in one analysis and several records in another.
Useful series performance indicators
| Indicator | Analytical value |
|---|---|
| Seasons per series | Measures franchise depth |
| Episodes per season | Helps compare format structures |
| Release interval | Examines the timing of new seasons |
| Genre and language | Supports audience-segment comparisons |
| Viewing hours or views | Indicates observed engagement when available |
| Renewal status | Provides context for programming decisions |
2020–2026 research context
Netflix's second-half 2025 engagement report showed the continuing importance of returning series. All five seasons of Stranger Things ranked among the platform's 15 most-watched shows during that reporting period, with a combined 275 million views. Season 5 alone recorded 94 million views in the same half-year report.
These results demonstrate why series analysis should consider the entire franchise rather than evaluating only the newest season. However, they do not establish that every returning series will perform similarly. A sound research model should compare series with similar release timing, genre, season structure, and availability of viewing data.
From 2020 through 2026, streaming analysts can use these methods to examine franchise longevity, season-release patterns, and the balance between new programming and established titles. Historical comparisons should document changes in measurement definitions and reporting windows so that results remain meaningful across different years.
How can streaming performance data reveal audience preferences?
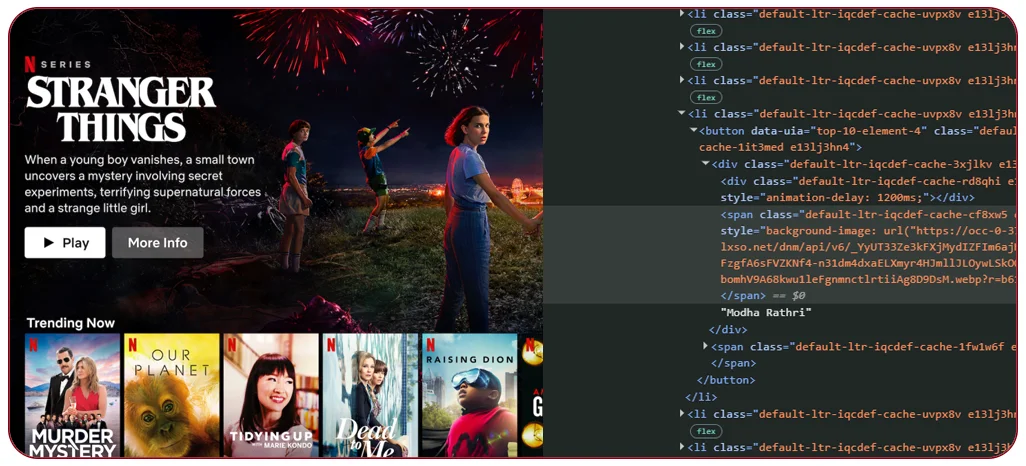
A Netflix streaming content data API can help authorized data workflows integrate available content and engagement information into analytics systems. For research teams, the key benefit is the ability to compare structured records across time periods and connect them to dashboards, statistical models, and reporting tools.
However, catalog metadata and audience behavior are different types of information. A listing's genre, release year, and language can be used to describe the content, but those attributes do not prove how many people watched it. Viewing hours, title views, completion rates, and audience retention require separate, reliable sources where those metrics are available.
Metrics that strengthen audience research
| Metric | What it measures | Research application |
|---|---|---|
| Hours viewed | Total viewing time | Compare engagement volume |
| Views | Viewing hours divided by runtime, under Netflix's published definition | Compare titles of different lengths |
| Genre share | Proportion of viewing by genre | Examine category preferences |
| Language share | Viewing distribution across languages | Study international content |
| Release age | Time since a title premiered | Examine catalog longevity |
| Repeat-period performance | Engagement across reporting periods | Identify titles with lasting interest |
Real-world evidence from 2020–2026
Netflix's first What We Watched engagement report, published in December 2023, covered more than 18,000 titles and nearly 100 billion viewing hours for January–June 2023. It represented approximately 99% of viewing on the service during that period. The report also noted that non-English-language titles generated 30% of viewing.
In the second half of 2025, Netflix reported 96 billion hours watched, while non-English-language content accounted for more than one-third of viewing.
These are real reported engagement figures, not estimates derived from catalog counts.
For businesses, the lesson is to combine descriptive data with verified performance indicators wherever possible. Analysts should document reporting periods, metric definitions, and the difference between global and regional measurements. This approach makes audience research more defensible and reduces the risk of mistaking content availability for actual consumer preference.
Turn streaming information into actionable audience insights with a structured, research-ready data workflow.
Get Insights Now!How can consistent data collection improve historical comparisons?
Netflix content data collection services can help research teams establish repeatable processes for gathering, validating, and organizing permitted content information. This matters because a catalog is not static. Titles are added and removed, metadata changes, and regional availability can vary.
A useful historical dataset should record not only the content attributes but also when each observation was collected. Without timestamps, a researcher may mistakenly interpret a current listing as evidence that a title was available in an earlier year.
Recommended data collection framework
| Data component | Why it matters |
|---|---|
| Stable title identifier | Helps match records across snapshots |
| Title and content type | Distinguishes movies from series |
| Genre and language | Supports segmentation |
| Release and premiere dates | Enables timeline analysis |
| Country or region | Captures market differences |
| Observation timestamp | Shows when a listing was recorded |
| Availability status | Helps identify catalog changes |
| Source and validation status | Improves traceability |
2020–2026 perspective
Netflix's published annual reports show how dramatically its business expanded during the early part of this period. The company ended 2020 with approximately 203.7 million paid memberships, compared with 221.8 million in 2021 and 230.7 million in 2022.
The company later introduced more comprehensive engagement reporting in 2023, giving researchers additional information about viewing hours, premiere dates, and global availability.
These milestones provide context for studying the evolution of streaming analytics. Membership figures describe business scale, while engagement reports describe viewing behavior; neither should be treated as a direct measurement of catalog size.
For 2020–2026 research, businesses should combine dated catalog snapshots with published company reports and clearly label missing years or unavailable observations. This enables more reliable comparisons of catalog change, content longevity, language representation, and the relationship between releases and reported engagement.
How can a structured dataset support content acquisition decisions?
A Netflix OTT Dataset can provide a consistent foundation for comparing titles, genres, release periods, countries, and languages. For streaming businesses, the goal is to use this information to generate testable hypotheses about content gaps and audience opportunities rather than treating any one attribute as a guaranteed predictor of success.
For example, a content acquisition team might discover that a genre has relatively few titles in a particular regional catalog. That observation can justify further research into local demand, competitor availability, licensing costs, and audience demographics. It does not, on its own, prove that acquiring more titles in that genre will increase subscriptions.
From data to acquisition strategy
| Research question | Suggested analysis | Business application |
|---|---|---|
| Which genres are underrepresented? | Calculate genre share by region | Explore potential catalog gaps |
| Which languages have limited coverage? | Compare language counts | Assess localization opportunities |
| Are older titles still relevant? | Compare historical engagement reports | Evaluate catalog longevity |
| Which release formats perform well? | Segment movies, series, and seasons | Inform content mix |
| How does the catalog differ by region? | Compare regional availability | Support localization planning |
2020–2026 perspective
Netflix's engagement reports show that viewing is distributed across new releases, returning franchises, and older titles. In the second half of 2023, Netflix reported nearly 200 million views across all eight seasons of Cocomelon and nearly 100 million views for the first three parts of Lupin. The same report highlighted continued viewing for licensed titles and non-English-language productions.
This evidence illustrates why acquisition teams should consider both new content and catalog longevity. A strategy based solely on release year may overlook titles that continue attracting audiences long after launch.
From 2020 through 2026, research teams can use historical metadata and published viewing figures to build comparable content segments. The most useful analysis combines market context, viewing behavior, rights availability, production or licensing costs, and strategic objectives. It should also clearly distinguish measured outcomes from hypotheses that require further testing.
How can automation make streaming research more scalable?
A Netflix Scraper can automate the collection of permitted, publicly accessible listing information and organize it into a structured format for research. When appropriately designed, an automated workflow reduces repetitive manual work and helps analysts apply consistent validation rules across larger catalogs.
Automation is particularly useful when teams need repeated observations across different categories or regions. It can standardize fields, flag missing metadata, detect duplicate records, and preserve timestamps for historical comparison. It cannot, by itself, reveal private viewing histories or internal recommendation-system data.
Example of a scalable research pipeline
- Define the research scope: Specify regions, categories, fields, and permitted sources.
- Collect and validate records: Check completeness, consistency, duplicates, and timestamps.
- Store historical snapshots: Preserve dated observations for reproducible comparisons.
- Analyze and report: Create trend dashboards, catalog comparisons, and research summaries.
2020–2026 perspective
Netflix's reporting practices demonstrate the growing availability of structured streaming performance information. The company introduced its comprehensive engagement report in 2023, covering more than 18,000 titles and almost 100 billion viewing hours for the first half of that year. In 2025, its two half-year reports recorded more than 95 billion hours watched in the first half and 96 billion in the second half.
These figures show the scale of the activity that streaming analytics may need to summarize. They do not mean a third-party collection tool can access every viewing metric. Catalog metadata, official engagement reports, and licensed datasets have different levels of availability and should be integrated only where permitted.
Between 2020 and 2026, a scalable research approach increasingly depends on consistent data definitions, historical records, and repeatable analysis. Automation can help teams work more efficiently, while analyst review ensures that observed patterns are interpreted in the proper business context.
Why Choose Real Data API?
A reliable streaming research solution should provide organized data, clear field definitions, consistent delivery, and a workflow aligned with the customer's analytical goals. Real Data API can help businesses plan structured data projects for content research and streaming market intelligence, subject to source availability and applicable access permissions.
What should streaming businesses look for?
- Structured delivery: Consistent fields for titles, genres, release dates, and other available metadata.
- Data quality checks: Validation to identify incomplete or duplicate records.
- Historical readiness: Timestamps and repeatable collection processes for tracking catalog changes.
- Research flexibility: A dataset scope aligned with selected genres, markets, languages, or content types.
- Analytics compatibility: Formats that can be used in spreadsheets, databases, and business intelligence tools.
- Responsible collection: Respect for applicable laws, platform terms, and data-use restrictions.
The right approach connects data collection to a specific business question. A content acquisition team may need regional genre comparisons, while a research firm may prioritize historical catalog changes. Defining the use case first helps ensure the resulting dataset is useful rather than simply large.
The Netflix API should not be assumed to offer unrestricted access to catalog or private engagement information. Businesses should verify the availability, permitted use, and scope of any official or third-party interface before building a production workflow.
Conclusion
Netflix dataset analysis for streaming content trends helps streaming businesses understand catalog composition, compare genres and languages, evaluate release patterns, and interpret audience engagement when reliable viewing data is available.
Real-world Netflix reports demonstrate the value of this approach: the company reported nearly 100 billion viewing hours for the first half of 2023 and 96 billion hours for the second half of 2025. Non-English-language content accounted for approximately 30% of viewing in the first half of 2023 and more than one-third in the second half of 2025.
For OTT decision-makers, these findings reinforce the importance of examining content diversity, franchise longevity, regional preferences, and measurable engagement together. Catalog counts alone cannot establish audience demand, but well-organized historical data can help teams formulate stronger research questions and test strategic assumptions.
Ready to turn streaming data into actionable content intelligence? Contact Real Data API to discuss a structured data solution tailored to your research goals, market coverage, and analytics requirements.
FAQs
1. What is Netflix dataset analysis for streaming content trends?
Netflix dataset analysis for streaming content trends examines genres, languages, release years, catalog composition, and available engagement metrics to support content planning, market research, and informed acquisition decisions.
2. How does a Netflix Web Scraping Service help researchers?
A Netflix Web Scraping Service organizes permitted public listing information into structured records, helping researchers compare catalog attributes, identify changes, and prepare datasets for analytics.
3. What is Netflix OTT catalog data scraping used for?
Netflix OTT catalog data scraping helps researchers evaluate content availability, genre representation, release periods, language diversity, and potential catalog gaps across observed regions and time periods.
4. How can Netflix TV series dataset for analytics support planning?
A Netflix TV series dataset for analytics enables comparisons of seasons, genres, release patterns, and available engagement metrics, helping content teams evaluate franchise longevity and programming opportunities.
5. Can Netflix streaming content data API provide audience insights?
A Netflix streaming content data API may support integration where authorized data is available. Real Data API can help businesses plan structured workflows while respecting access restrictions.
Latest posts
Using Flipkart API for e-commerce competitor benchmarking to Monitor Competitors Across Online Marketplaces

How Myntra scraper for online fashion retail analytics Helps Track Trends, Prices, and Product Demand
Web scraping services for real-time market insights - How Businesses Can Track Trends and Competitors

How to Use a Meesho ecommerce scraper 2026 to Analyze Product Listings, Pricing, and Market Opportunities



.png)


