.gif)
.png)

Quick Summary
- Noon API for e-commerce business analytics helps businesses understand marketplace data workflows, pricing operations, and product performance.
- Noon Food Scraper can support food-category research when relevant product information is accessible and collection is permitted.
- Historical price records, competitor comparisons, and structured datasets help e-commerce teams make more informed pricing decisions.
Introduction
The Noon API for e-commerce business analytics can help sellers and technology partners organize marketplace operations, product information, and pricing workflows. For businesses seeking broader market intelligence, product data collection and historical price analysis can reveal useful patterns in product positioning, discounts, and competitive activity. Noon’s official API documentation describes integrations for catalog management, marketplace pricing, inventory synchronization, and product offers. These capabilities are primarily designed for authorized seller and partner workflows, so they should not automatically be treated as public competitor-data endpoints. Source: Noon API documentation.
For e-commerce businesses, the goal is to convert accessible, reliable data into decisions. Retailers need to understand whether a price is competitive, how a product performs across relevant categories, and when a pricing change deserves investigation. A structured data strategy can connect product records with reporting tools, allowing teams to evaluate changes instead of relying on occasional manual checks.
A Noon Food Scraper is a separate data collection approach focused on accessible food and grocery listings, such as product names, displayed prices, and category information where available. Food retail analysis can benefit from structured data because packaged goods, household essentials, and grocery products may require frequent price comparisons. Any collection workflow should respect the source's access controls, applicable terms, and data protection requirements.
How Do You Turn Product Listings Into Reliable Pricing Data?
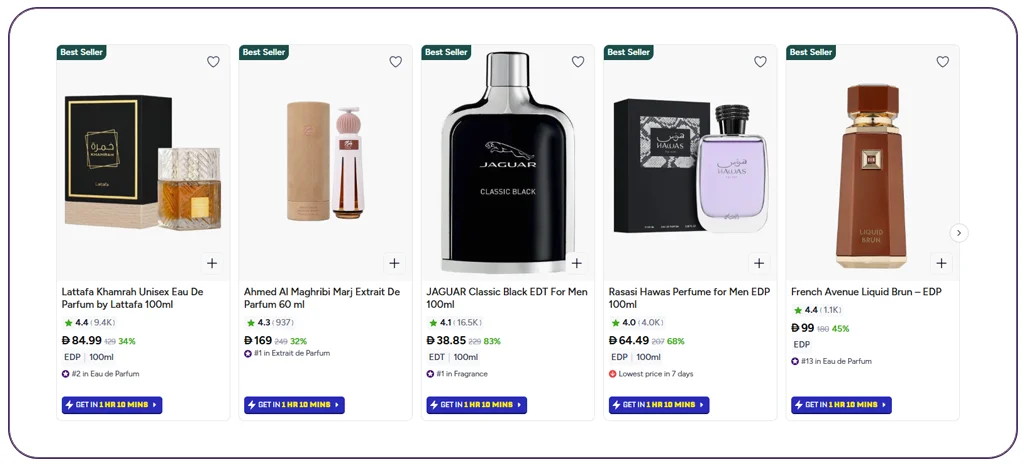
Product price analysis starts with a consistent record of what is being sold, where it is listed, and the price observed at a particular time. Noon API data extraction for product price analysis should begin by identifying the fields needed for the business question, rather than collecting every available attribute without a clear purpose.
For an authorized seller integration, Noon documents catalog and pricing capabilities that support managing product listings and marketplace offers. Its pricing API documentation describes marketplace-level price management, while the product listing help center explains that seller listings include customer-visible prices and product identifiers. These are useful operational capabilities, but access to seller data does not necessarily grant access to competing sellers' private records.
A practical data model should store the product identifier, title, category, seller or offer identifier when accessible, currency, displayed price, discount information, availability, source URL, and observation timestamp. A timestamp is particularly important because a price without a collection date cannot establish when it was valid.
The business should also distinguish between a product's listed price and its final payable cost. Delivery fees, coupons, taxes, and seller-specific offers can affect the price a customer actually pays. Where those values are unavailable, reports should clearly state that the comparison uses displayed prices only.
What does the market data tell us?
The following figures show the wider e-commerce environment in which pricing intelligence operates.
| Year | MENA e-commerce market value | Data status |
|---|---|---|
| 2020 | US$20.2 billion | Reported historical estimate |
| 2021 | US$23.1 billion | Reported historical estimate |
| 2022 | US$27.4 billion | Reported historical estimate |
| 2023 | US$30.4 billion | Reported historical estimate |
| 2024 | US$34.5 billion | Reported market estimate |
| 2025 | US$38.1 billion | Report estimate |
| 2026 | US$42.2 billion | Report forecast |
Source: EZDubai and Euromonitor, E-Commerce Report in the MENA Region 2025. Values are in US dollars and represent the report's regional market series; 2025 and 2026 figures are estimates or forecasts, not verified final outcomes.
This growth makes data quality more important, not less. An expanding marketplace creates more products, sellers, and pricing observations to compare. Businesses should begin with a clearly defined product scope, preserve historical snapshots, and validate each record before using it in pricing decisions.
How Can Businesses Track Prices Over Time?
A single price observation shows what a product costs at one moment. Repeated observations help reveal whether the price has increased, decreased, or remained stable. Noon web data scraper for product price tracking describes a workflow for gathering accessible listing information at defined intervals and storing each observation for later comparison.
An effective tracker first establishes a product-matching method. Product identifiers are preferable when available. Otherwise, a combination of brand, model, variant, size, and product title may help identify comparable listings. Matching only on similar names can create errors when products differ in quantity, specifications, or packaging.
Next, the system records the displayed price and timestamp. The collection frequency should match the business need and the source's permitted access conditions. Daily observations may be sufficient for routine category research, while rapidly changing promotions may justify a different schedule if the source allows it. Missing observations should remain missing rather than being silently replaced with assumed prices.
A price history can then support several calculations. The percentage price change between two observations is:
Price change (%) = ((New price − Old price) / Old price) × 100
For example, a change from AED 100 to AED 90 represents a 10% decrease. This is a mathematical illustration, not a claim about an actual Noon listing. Businesses should also retain the original currency and distinguish promotional prices from regular displayed prices whenever that information is available.
What should a price-tracking dashboard display?
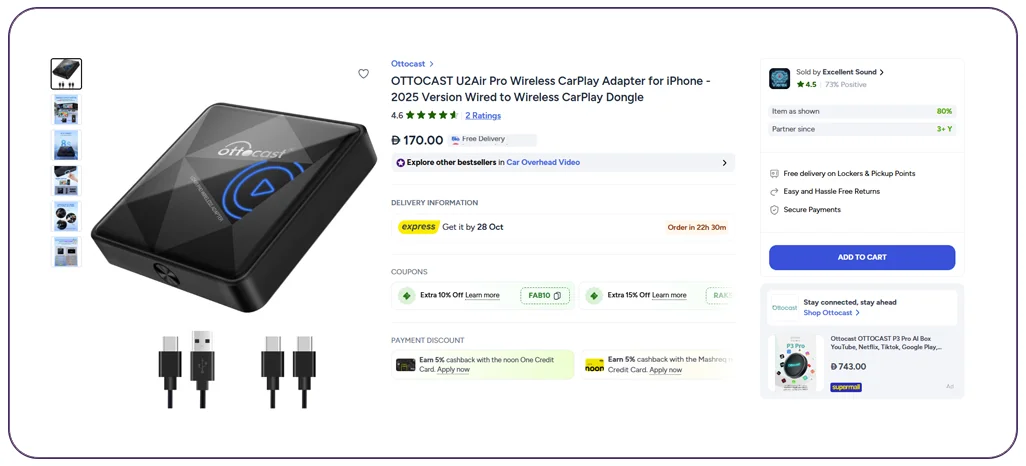
A useful dashboard includes the current observed price, previous observed price, absolute and percentage change, last observation time, and the number of successful observations. Alerts can be triggered when a verified price change crosses a business-defined threshold.
Price history should not be confused with continuous monitoring. A system that collects data once per day cannot reliably establish what happened between collection times. Reports should identify their observation intervals and avoid presenting sampled data as a complete record of every price change.
For context, Amazon's explanation of price history describes 30-, 90-, and 365-day history views introduced for customers in supported markets in 2026. This illustrates the practical value of historical context in online shopping, although it is an Amazon feature rather than a Noon capability.
The most useful tracking system combines consistent product matching, timestamped observations, transparent calculations, and clear limits on what the data can prove.
How Does Competitor Analysis Support Better Pricing?

Competitor analysis helps businesses understand how their offers compare with similar products in the same market. Noon data collection services for competitor analysis can support this work when the relevant listing information is publicly accessible or otherwise authorized for collection.
The first step is to define a fair comparison group. Products should match on meaningful attributes, including brand, model, size, quantity, and specifications. Comparing a single premium product with a lower-priced substitute may create a misleading picture of market positioning. Similarly, a promotional offer should not automatically be treated as the competitor's standard price.
A competitive pricing report can include the lowest observed comparable price, median observed price, price range, number of comparable offers, and date of collection. The median is often useful because an unusually high or low listing can distort the average. Each report should identify the products included and disclose missing or unmatched records.
What regional market evidence matters?
The UAE's online retail market provides useful context for businesses operating in the region. According to Dubai South's report on the 2024 e-commerce market, UAE e-commerce reached AED 32.3 billion in 2024, equivalent to approximately US$8.8 billion. The report also identified apparel and footwear, consumer electronics, and home care among the country's leading e-commerce categories by value.
These figures describe the broader market, not Noon-specific sales or seller performance. They indicate why category selection matters: the most useful competitor set depends on the products a business sells and the audience it serves.
| Analysis area | Data to compare | Business question |
|---|---|---|
| Price position | Comparable listed prices | Is our offer above or below the market range? |
| Promotions | Displayed discounts and offer periods | Are price differences temporary? |
| Product coverage | Models, variants, and categories | Are important products missing from our assortment? |
| Availability | Accessible stock or listing status | Are observed offers currently available? |
| Historical movement | Timestamped price observations | Are competitors changing prices over time? |
The next step is to turn observations into decisions. A lower competitor price does not automatically mean a business should reduce its own price. Margin, supplier costs, fulfilment expenses, product differentiation, return rates, and customer expectations all affect the decision.
A strong competitive intelligence process identifies a pricing gap, checks that the products are genuinely comparable, evaluates profitability, and recommends an action for human review. This produces more useful insights than simply ranking competitors from cheapest to most expensive.
Want to build a more structured marketplace intelligence workflow? Explore how Real Data API can help your team plan product data collection, organize pricing observations, and prepare data for actionable e-commerce reporting.
How Can Automated Collection Fit Into Existing Business Systems?
Manual product research can become difficult to maintain when a team needs to review many listings repeatedly. Noon API integration for automated product data collection focuses on connecting authorized data sources with the systems that process, store, and analyze product information.
The first requirement is to distinguish between operational API integration and external market research. Noon’s official API platform documentation describes services for catalog management, orders, fulfilment, and event notifications. Its catalog documentation also covers product and pricing operations. Businesses should use the endpoints and permissions applicable to their account instead of assuming that seller APIs expose the complete marketplace or competitors' private information.
An integration generally needs four components: an authorized source, a data transformation process, a storage layer, and an analytical destination. Source responses are mapped into a consistent internal schema. Validation rules check identifiers, currencies, timestamps, and required fields before records enter reporting tables.
For seller operations, the workflow may synchronize product attributes, prices, or stock information with internal systems where the relevant API permissions support those actions. For permitted market research, a separate collection process may capture accessible listing information and retain historical observations. These workflows should remain distinct where their access rights or intended uses differ.
What should an automated data pipeline include?
| Component | Purpose | Recommended control |
|---|---|---|
| Source connection | Retrieves authorized data | Credential security and permission checks |
| Transformation | Standardizes fields | Schema and currency validation |
| Storage | Preserves records and history | Timestamped records and backups |
| Monitoring | Identifies failures | Error logs and missing-data alerts |
| Reporting | Makes results accessible | Defined metrics and documented limitations |
Automation does not eliminate data quality problems. APIs can return errors, fields can change, and records may be missing or delayed. Teams should monitor failed requests, avoid creating duplicate observations during retries, and document the time of the last successful update.
Security is equally important. Credentials should be stored securely, permissions should follow the principle of least privilege, and access should be limited to authorized personnel. Request limits, applicable contractual conditions, and data retention requirements must be considered when designing the workflow.
A well-integrated pipeline reduces repetitive work and improves consistency, but its business value depends on reliable source access, clear ownership, and ongoing maintenance. Automated reports should show when the underlying information was last refreshed so decision-makers can judge whether it is current enough for their needs.
Which Metrics Make Marketplace Analytics More Useful?
An analytics program becomes valuable when its metrics connect collected information with a specific commercial decision. noon API can refer to the platform's authorized integration capabilities, while a broader marketplace analytics workflow may combine permitted source data with a retailer's internal costs, sales, and inventory information.
The most useful metrics depend on the business model. A retailer concerned with competitive pricing may prioritize price differences and historical movements. A seller managing its own listings may focus on catalog completeness, stock synchronization, and the consistency of displayed prices. An analyst studying product assortment may look at category coverage and the availability of comparable offers.
Which metrics should teams prioritize?
| Metric | Calculation or definition | Why it matters |
|---|---|---|
| Observed price change | Current observation minus previous observation | Identifies price movement |
| Percentage price change | Price change divided by previous price, multiplied by 100 | Makes changes comparable across price levels |
| Competitive price gap | Your comparable price minus competitor price | Shows relative positioning |
| Product coverage | Matched products divided by target products | Indicates how much of the intended assortment is represented |
| Data freshness | Time since the latest successful observation | Shows whether the information is recent |
| Data completeness | Records containing required fields divided by all records | Helps assess analytical reliability |
The definitions must remain consistent across reports. For example, a competitive price gap is meaningful only if the two products are comparable and use the same currency. Where conversion is necessary, the exchange-rate source and conversion date should be recorded.
Business teams should also distinguish descriptive metrics from performance outcomes. Observing a price reduction does not prove that demand increased. Establishing that relationship requires additional evidence, such as sales volumes, traffic, conversion data, and a suitable comparison method. Likewise, listing availability is not the same as actual inventory across every fulfilment location.
A useful reporting cycle starts with a commercial question, selects the smallest reliable set of metrics needed to answer it, and records the assumptions behind the analysis. Teams can then review the findings, take an appropriate action, and measure what happened afterward using their own business results.
This approach prevents dashboards from becoming collections of disconnected numbers. It also makes recommendations easier to explain to pricing managers, merchandising teams, and senior decision-makers.
How Can Grocery Product Data Reveal Category-Level Opportunities?
Grocery and daily essentials have different pricing characteristics from durable goods. Pack sizes, unit prices, promotions, and regional availability can make comparisons more complicated. Noon Daily Grocery Data Scraping describes a collection approach for accessible grocery listings, subject to applicable permissions and source restrictions.
A useful grocery dataset may include product names, brands, package sizes, displayed prices, unit measurements, category labels, promotional information, and timestamps where available. The inclusion of package size is particularly important. A 1-litre product and a 500-millilitre product cannot be compared fairly using their displayed prices alone.
Where quantities and units are available, analysts can calculate a normalized unit price:
Unit price = Displayed price / Product quantity
For instance, comparing prices per kilogram or litre can reveal differences hidden by package sizes. Any calculation must use compatible units and clearly state whether the displayed price includes applicable discounts.
Grocery price analysis can also benefit from tracking products across collection periods. Historical records may reveal when displayed prices changed or when a listing became unavailable. However, those observations do not independently establish sales volume, customer demand, or inventory levels beyond what the source explicitly reports.
What do grocery trends look like in the wider market?
The Dubai Chamber analysis published by Dubai's government media office reported that the UAE retail e-commerce market reached US$3.9 billion in 2020, rising 53% year over year. Food and drink accounted for 11% of the market, or US$400 million, in that analysis.
These are historical figures for the UAE retail e-commerce market, not current Noon grocery statistics. They provide context for why online food and drink categories can be relevant to marketplace research, but they should not be used to claim present-day category shares.
A practical grocery analysis workflow groups comparable products, standardizes units, records observation dates, and flags promotions separately from ordinary prices. Analysts can then investigate price ranges and category coverage without confusing a displayed listing with a confirmed transaction.
For businesses serving multiple locations, regional comparisons also require care. Different pack sizes, availability, taxes, fulfilment costs, and promotional terms may explain observed differences. Documenting these factors helps prevent misleading conclusions and supports more defensible decisions about product assortment and pricing.
Why Choose Real Data API?
Real Data API can help businesses plan structured data workflows for product research, pricing intelligence, and e-commerce analytics. The right approach depends on whether a company needs to manage its own marketplace listings, compare accessible competitor offers, or analyze historical changes in a product category. These objectives require different data sources, permissions, and validation methods.
A well-designed Noon Food Dataset can organize relevant food and grocery product information into a consistent format for analysis, provided the underlying records are accessible and their collection is authorized. Useful fields may include product identifiers, names, category labels, displayed prices, package sizes, and observation timestamps. The actual schema depends on the available source data.
For e-commerce teams, a dependable workflow should prioritize data quality over volume. Clear product matching reduces misleading comparisons, while timestamps help analysts understand when an observation was collected. Validation checks identify missing fields and duplicates before they affect reports. Documented currency and unit conventions make the resulting metrics easier to interpret.
Businesses should also consider integration requirements, update frequency, security, and the cost of maintaining a data pipeline. The best solution is one that supports a defined business objective without collecting unnecessary information. Before implementation, teams should confirm source access, available fields, permitted uses, and any technical limits.
With a clear scope and an appropriate collection strategy, organizations can turn marketplace records into structured analytical resources that support more consistent research and informed pricing decisions.
Conclusion
Marketplace analytics is most effective when product information, historical observations, and business metrics work together. Structured pricing data helps retailers understand where their products sit in the market, investigate changes in competitor offers, and identify opportunities for further analysis. However, reliable decisions require comparable products, consistent collection methods, and clear distinctions between observed prices and actual transaction outcomes.
The Noon API for e-commerce business analytics can support authorized marketplace operations and data integration, while complementary data collection workflows can help businesses research accessible product listings. The right approach depends on the intended use, the permissions available, and the quality of the source information.
For best results, begin with a focused product category, define the fields needed for analysis, retain timestamped observations, and measure data completeness before expanding. Use pricing insights alongside margins, fulfilment expenses, inventory information, and sales performance rather than treating competitor prices as the only decision factor.
Ready to improve your e-commerce intelligence workflow? Contact Real Data API to discuss your product data requirements, explore suitable collection options, and build a structured foundation for price analysis, tracking, and competitor research!
Frequently Asked Questions
1. What is a Noon API for e-commerce business analytics?
A Noon API for e-commerce business analytics supports authorized marketplace integrations involving catalog, pricing, inventory, and order workflows. Available functions depend on account permissions and documented endpoints.
2. What is a Noon Food Scraper used for?
A Noon Food Scraper can organize accessible food product listings, prices, categories, and package information for grocery research, subject to source access permissions and data availability.
3. How does Noon API data extraction for product price analysis work?
Noon API data extraction for product price analysis organizes authorized or otherwise permitted product records into consistent fields, allowing businesses to compare displayed prices and examine historical observations.
4. What is a Noon web data scraper for product price tracking?
A Noon web data scraper for product price tracking collects permitted listing observations at defined intervals, records timestamps, and helps analysts identify price changes across comparable products.
5. How do Noon data collection services for competitor analysis help retailers?
Noon data collection services for competitor analysis help retailers compare accessible product offers, identify pricing gaps, and evaluate competitive positioning. Real Data API can help businesses plan suitable data workflows.
Latest posts
A Complete Guide to Extract authorized Total Wine Scraper for Retail Data Analysis and Competitive Intelligence
How Noon API for e-commerce business analytics Enables Smarter Product Price Analysis and Price Tracking

MakeMyTrip API Integration for Travel Data Analytics - Solutions for Smarter Travel Insights
Keeta scraper for monitoring food marketplace trends - Identify Discount Changes and Emerging Customer Demand



.png)


