.gif)
.jpg)
Introduction
Grocery inflation is felt locally. Rents, wages, taxes and competition differ between cities, and so do the prices on the shelf. For a researcher, retailer, journalist or app developer who focuses on the Philadelphia area, national grocery data is too coarse. What is needed is reliable Philadelphia grocery price data, collected from the stores that local shoppers actually use: Walmart, Costco and Whole Foods.
This article explains how local grocery scraping api and local grocery price tracking work for a metro area like Philadelphia, which data fields are collected, how stores and ZIP codes are chosen, and what you can learn from the results.
Why A Metro-Level Price Dataset Is Valuable
A metro-level dataset answers questions that national numbers cannot:
- How much does a standard basket cost in Philadelphia compared with surrounding suburbs?
- Which retailer is cheapest for staples, and which is cheapest for fresh produce?
- How do prices change during holidays and promotions?
- Where does bulk shopping at Costco actually save money after unit-price adjustment?
- How do premium retailers like Whole Foods position themselves on private label and organic ranges, and how does Whole Foods price data help reveal those differences?
Defining The Geography
The Philadelphia area is more than the city itself. A useful scope may include:
- Philadelphia city ZIP codes, from Center City to the Northeast and South Philadelphia
- Inner suburbs in Delaware, Montgomery and Bucks counties
- Nearby New Jersey locations across the river, if your analysis requires it
For each retailer, the scraper identifies stores that serve these ZIP codes. This store- level price scraping uses store-specific context to ensure that the price recorded is the price a local shopper sees.
The Basket Approach
Tracking every product is possible, but many projects use a defined basket of common items, which makes comparisons easy and keeps costs manageable. A basket might contain 50 to 200 items across categories:
- Dairy and eggs: milk, eggs, butter, yogurt and cheese
- Bakery and grains: bread, rice, pasta, cereal and flour
- Produce: bananas, apples, potatoes, onions and tomatoes
- Meat and seafood: chicken, ground beef and fish
- Pantry: oil, sugar, canned goods and sauces
- Household basics: paper towels and cleaning supplies
To compare retailers fairly, the basket should be defined by product type and size, then matched to the closest equivalent at each retailer. Private-label and national-brand versions can be tracked separately.
Data Fields Collected
- Retailer, store ID, store address and ZIP code
- Product title, brand, UPC or GTIN where available and size
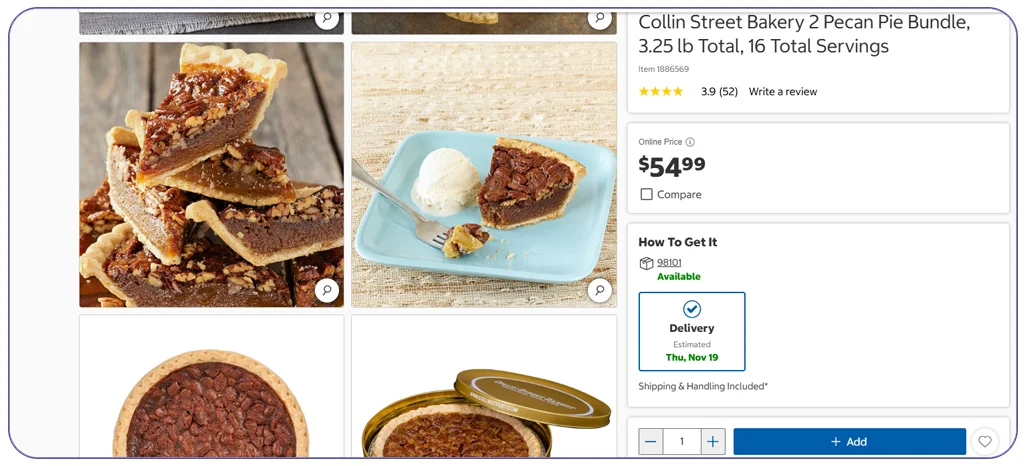
- Regular price, current price and promotion description
- Unit price and unit of measure
- Availability and fulfilment options
- Category and sub-category
- Date and time of collection
- Product URL
How The Philadelphia Scraping Project Works
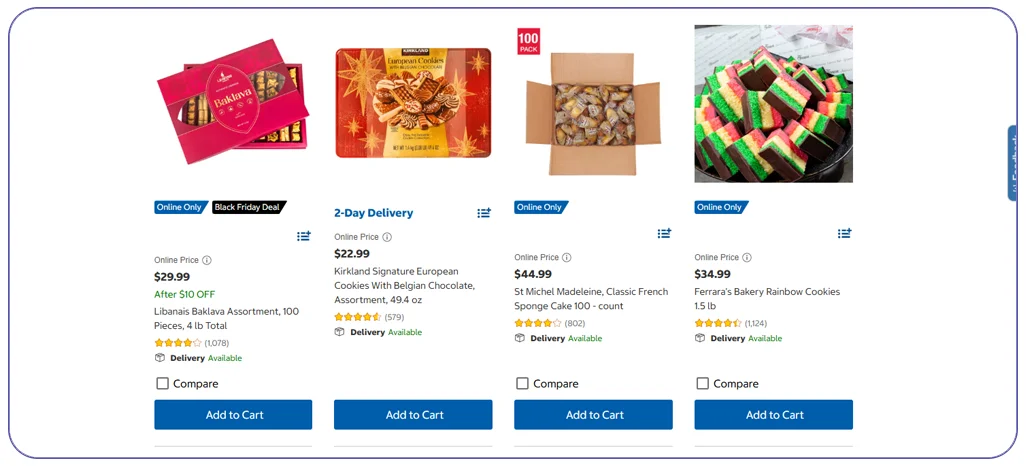
- Identify stores. For each target ZIP code, find the Walmart, Costco and Whole Foods stores that serve it. Walmart price scraping can then capture the local catalogue and availability for the selected store.
- Build the basket and mapping. Define items and map each to one or more retailer products.
- Set location and store. The scraper selects the store or ZIP code before loading product pages.
- Collect prices. Each product page or category list is read, and the price, size and promotion are captured.
- Standardise. Units are converted to a common basis, such as price per ounce, per pound or per count.
- Quality check. Outliers and missing prices are flagged for review.
- Schedule. Weekly collection is common for price tracking, with extra runs around holidays and during promotions.
- Report. Indexes and charts are produced from the data.
Technical Challenges
- Fresh produce and weighted items: prices may be per pound, and package weights vary. Normalisation must handle this.
- Membership pricing at Costco: Costco price data may be limited to information displayed publicly, so membership-only prices may not always be available.
- Different catalogue structures: each retailer uses different product naming. A mapping table or fuzzy matching links equivalent items.
- Out-of-stock items: an item might be unavailable, and its price may not be displayed. The dataset should record availability explicitly.
- Promotions: multi-buy and coupon deals complicate the real price. Capture both the shelf price and the promotion text.
What You Can Learn From The Data
- A basket price index for each retailer and for the whole metro
- The price gap between city and suburb stores
- The categories where Costco's unit price beats Walmart's, and where it does not
- How often each retailer promotes common items
- How fast prices change after supply shocks or seasonal peaks
Use Cases
- Local journalism and research: publish a transparent, reproducible local food-price index.
- Community and nonprofit groups: identify the most affordable stores for low-income neighbourhoods and find food-access gaps.
- Retailers and CPG brands: benchmark local pricing and promotions against competitors.
- Consumer apps: show Philadelphia shoppers the cheapest store for their shopping list.
- Economists and analysts: study local inflation using real shelf prices.
Example: Finding The Cheapest Basket
A community organisation wants to help families save money. It defines a basket of 80 items, selects 15 ZIP codes across Philadelphia and tracks Walmart, Costco and Whole Foods weekly for a quarter. The results show that Walmart is cheapest for most staples, Costco is cheapest per unit on several bulk items but requires larger upfront spending, and Whole Foods is higher on average but competitive on some private-label products. The organisation shares a simple guide with local residents.
Presenting The Results
Clear presentation builds trust. Good practice is to publish the basket list, the dates and the method, show prices per unit, and note limitations such as missing items or membership-only prices.
Delivery Formats
Data can be delivered as weekly CSV or Excel files, a JSON API for dashboards or a database load. Many clients also request a summary report with charts, built on top of the raw data.
Responsible Data Collection
Collect only publicly visible price data, respect terms of use, keep request volumes reasonable and avoid personal data. When publishing results, describe the method and any limits.
Why Choose Real Data Api For Local Grocery Price Scraping
Real Data API sets up store-aware scrapers for Walmart, Costco and Whole Foods, standardises units and delivers a clean, comparable dataset for your chosen area, whether Philadelphia or any other metro. We monitor and maintain the scrapers to keep the series consistent over time. A pilot with 30 items and a handful of stores is a good way to begin.
Conclusion
Local grocery price scraping for Philadelphia turns the shelf prices at Walmart, Costco and Whole Foods into a reliable local dataset. With a clear basket, store-level collection and consistent unit prices, you can measure inflation, compare retailers and help shoppers make better decisions.
Need local grocery price data? Real Data API can build a pilot for Philadelphia or any other metro area.
FAQs
1. Can you cover the whole Philadelphia metro area?
Yes. The scope depends on how many ZIP codes and stores you want. The project can include suburbs and nearby New Jersey locations.
2. How often should prices be collected?
Weekly works for most price indexes. Daily collection is better for studying promotions.
3. How do you compare items across retailers fairly?
Items are matched by product type and size, and prices are converted to unit prices.
4. Can I get historical prices?
Historical data starts from the first collection date. A long-running schedule builds your own history.
5. Can the dataset include other retailers later?
Yes. Additional retailers can be added to the same schema.
Latest posts
How to Find Verified Suppliers and Reduce B2B Lead Generation Time Using IndiaMART data scraper API
How to Identify Retail Pricing Trends and Improve Assortment Planning Using Biedronka API for product information
How to Track Competitor Odds and Improve Sportsbook Pricing Accuracy Through Live Betting Data Extraction
How KAYAK API Integration for Flight Search Helps Travel Businesses Compare Airfares and Find Better Deals



.png)


