TL;DR
- Pull & Bear fashion dataset can help fashion brands and retailers organize product, price, category, availability, and assortment information for competitive and trend analysis.
- Pull & Bear fashion data scraping can automate recurring collection, making it easier to compare products, pricing, discounts, and catalog changes over time.
- Historical and current records can help merchandising and strategy teams identify assortment shifts, pricing movements, and emerging apparel patterns without relying only on manual research.
Introduction
Fashion intelligence depends on knowing what is available, how products are priced, which categories are expanding, and how collections change over time. Pull & Bear fashion dataset workflows can convert publicly accessible catalog information into structured records, while Pull & Bear fashion data scraping can support recurring collection for competitive research, pricing analysis, assortment planning, and trend monitoring.
Pull&Bear describes itself as a brand focused on young-minded consumers and casual, comfortable fashion, with clothing supported by footwear and accessory categories. Its official brand history also states that product lines are continually updated and that stores receive new merchandise twice a week. (Pull&Bear)
For fashion retailers, this product-refresh orientation creates a practical data challenge: a catalog snapshot can become outdated quickly. Teams need structured records that allow them to compare products and prices today with observations from previous collection cycles.
The core question is straightforward: How can businesses turn changing fashion catalog information into usable intelligence?
The answer is a repeatable data workflow covering product discovery, extraction, normalization, validation, historical storage, and analysis.
How can automated collection improve fashion market intelligence?
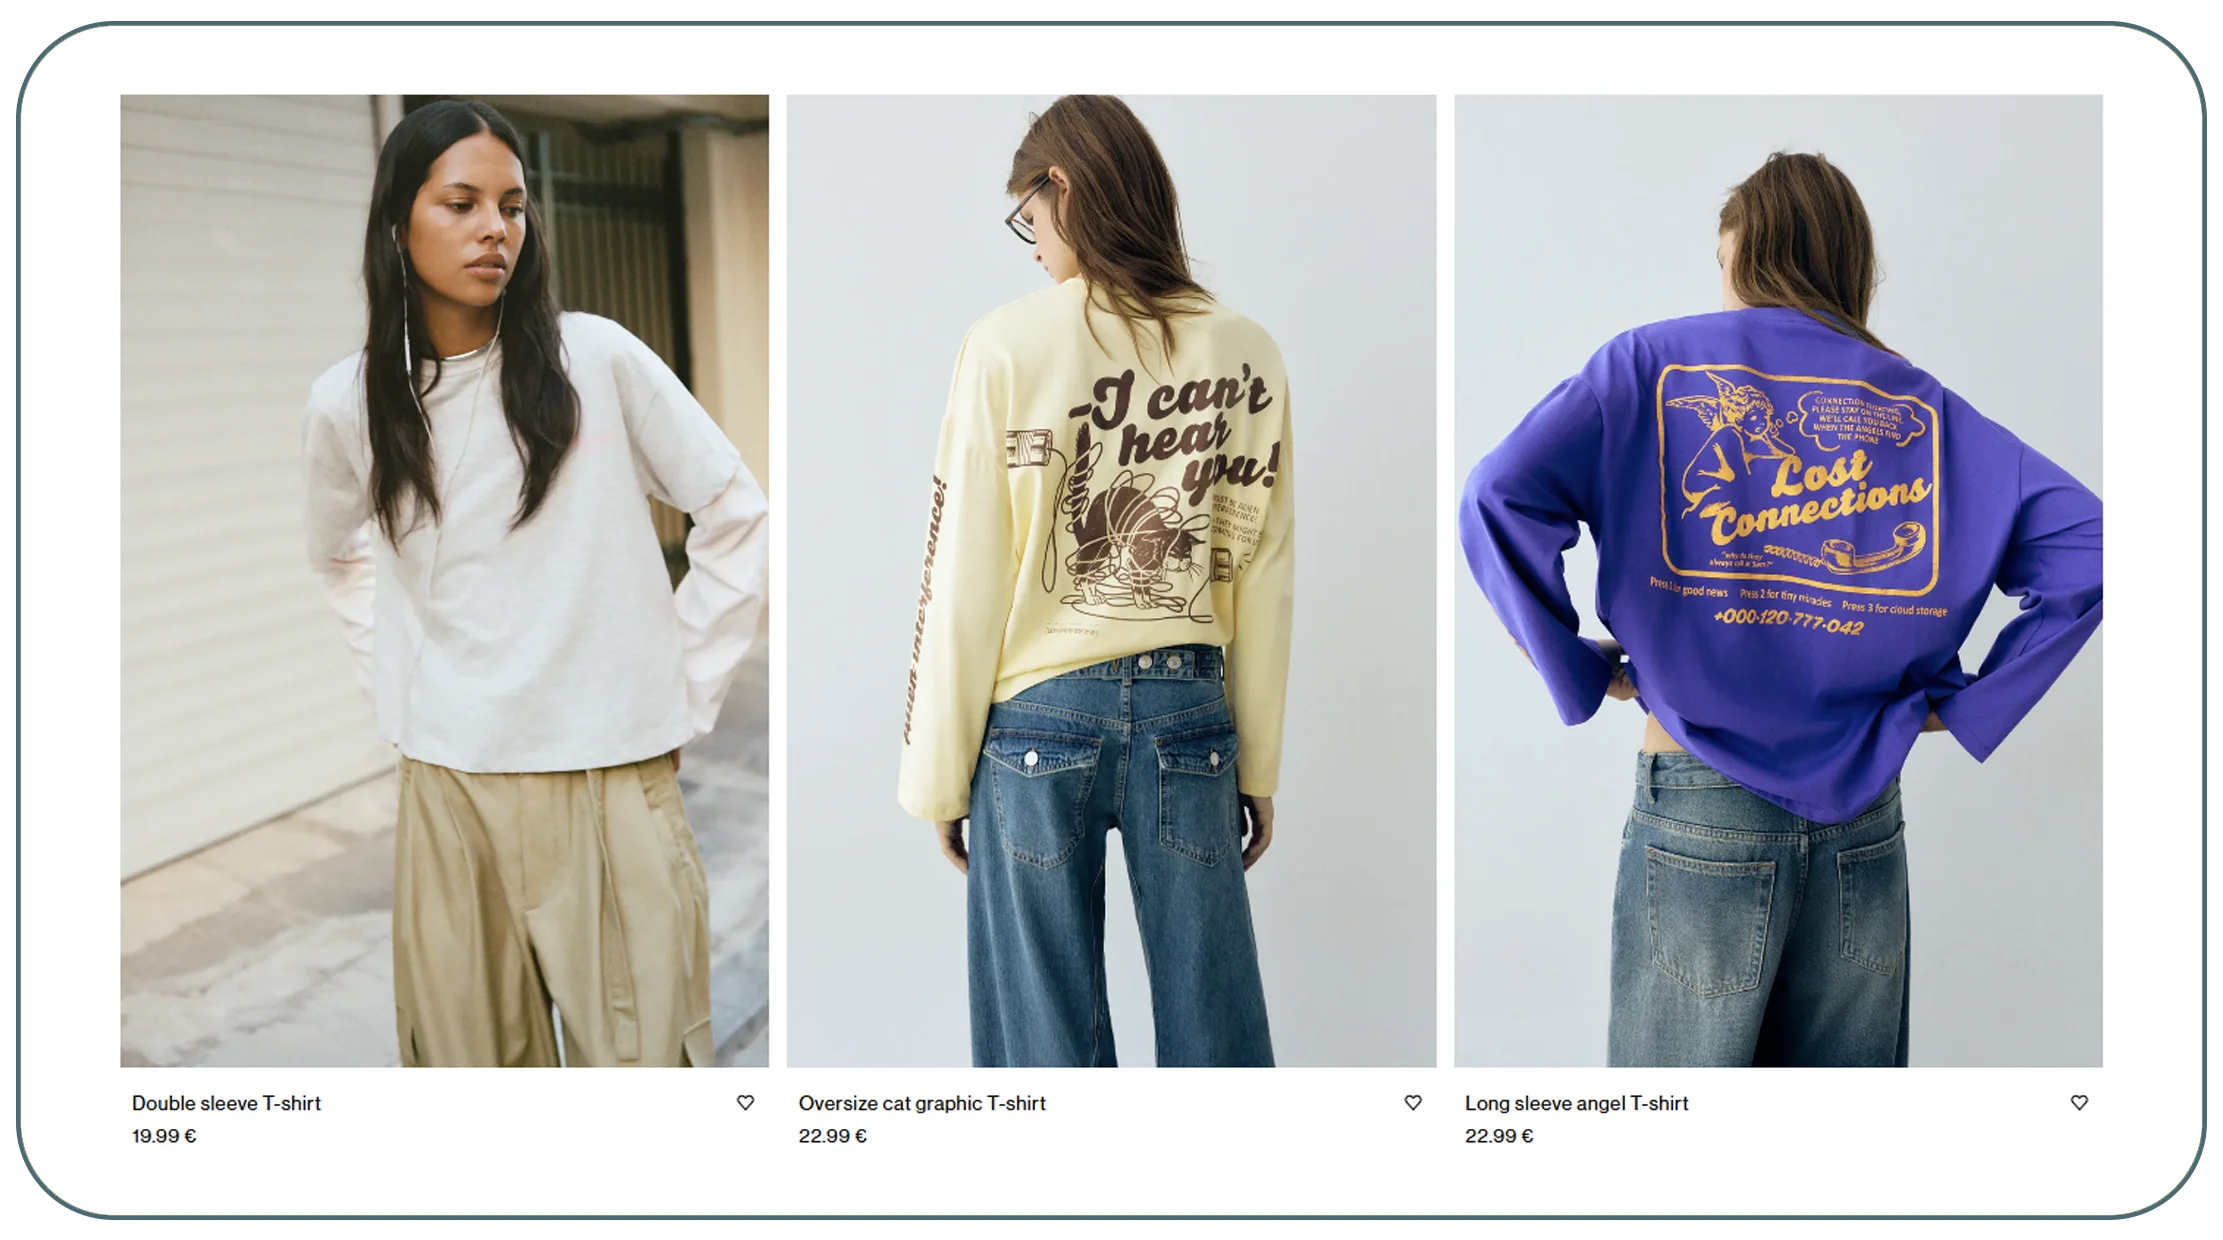
Pull & Bear fashion data scraping can help brands, retailers, agencies, and market researchers collect structured product information at scale instead of manually reviewing individual pages.
The information collected can be organized around business objectives. A pricing team may prioritize MRP, selling price, and discounts. A merchandising team may focus on category, product type, color, size, and availability. A market researcher may require brand, assortment, product descriptions, and historical observations.
What information can be monitored?
| Data Attribute | Business Application |
|---|---|
| Product name | Catalog comparison |
| Category | Category analysis |
| Product type | Assortment mapping |
| MRP | Price positioning |
| Selling price | Competitive benchmarking |
| Discount | Promotion analysis |
| Availability | Stock monitoring |
| Product URL | Product identification |
| Images | Visual catalog research |
| Timestamp | Historical analysis |
The value increases when the same attributes are collected consistently.
For example, suppose a retailer wants to understand casualwear competition. Instead of manually recording a few products, it can establish a defined product universe and periodically capture prices, categories, availability, and other accessible attributes.
The resulting data can answer questions such as:
- Which categories contain the most products?
- Which price bands are most common?
- How frequently do prices change?
- Which products disappear from the catalog?
- Which categories receive new products?
- How does assortment evolve over time?
Why consistency matters
Raw marketplace information is rarely analysis-ready. Product names may follow different formats, prices can contain currency symbols or formatting differences, and category labels may require normalization.
A professional workflow therefore includes:
- Product discovery
- Data extraction
- Field normalization
- Duplicate removal
- Validation
- Timestamping
- Storage
- Delivery
This transforms individual observations into a repeatable market-intelligence resource.
2020–2026 market evolution
Between 2020 and 2026, fashion intelligence increasingly shifted from occasional catalog research toward continuous digital observation. The acceleration of online shopping and the increasing frequency of product launches, promotions, and assortment changes made static research less useful for many commercial teams. Fashion retailers needed more granular information about products and prices, while category managers increasingly wanted historical records to distinguish temporary promotional activity from longer-term changes. Pull&Bear's own brand positioning emphasizes adapting international trends into casual, accessible collections, and its official history describes frequent merchandise updates. (Pull&Bear) This makes recurring observation particularly relevant for researchers studying assortment evolution. By 2026, automated collection could support a broader workflow in which product records are captured, standardized, timestamped, and compared across collection periods. The important change was not simply greater data volume. It was the ability to connect product-level information with pricing, category, availability, and historical context, creating a more useful evidence base for merchandising, competitive analysis, and market research.
How can product-level records improve assortment analysis?
When businesses scrape Pull & Bear product data, they can create a structured catalog view containing product-level attributes that support deeper assortment comparisons. A Pull & Bear fashion dataset can then preserve these observations for historical analysis.
This is particularly useful for retailers that need to understand how competitors structure their digital assortment.
Example assortment schema
| Field | Example | Business Use |
|---|---|---|
| Product ID | Product matching | Product matching |
| Product name | Catalog identification | Catalog identification |
| Category | Category mapping | Category mapping |
| Subcategory | Detailed assortment analysis | Detailed assortment analysis |
| Price | Price comparison | Price comparison |
| Discount | Promotion tracking | Promotion tracking |
| Color | Variant analysis | Variant analysis |
| Size availability | Availability monitoring | Availability monitoring |
| Product URL | Reference | Reference |
| Collection date | Historical tracking | Historical tracking |
Once records are normalized, analysts can calculate metrics such as:
- Number of products by category
- Average selling price
- Median price
- Discount distribution
- Products added over time
- Products removed over time
- Category share
- Price-band distribution
Example analytical table
| Category | SKU Count | Average Price | Discounted SKUs |
|---|---|---|---|
| T-Shirts | 500* | ¥1,699* | 140* |
| Jeans | 350* | ¥2,799* | 95* |
| Jackets | 220* | ¥3,499* | 80* |
| Footwear | 180* | ¥2,499* | 55* |
This distinction matters. A structured dataset should make clear which numbers are collected observations and which are analytical examples.
Assortment intelligence for buyers
A buyer can use these records to compare category breadth. A pricing manager can identify where competitor prices cluster. A merchandising team can examine whether a competitor is introducing more products in a particular segment.
Historical records also make it possible to identify catalog turnover.
If a category contains 500 products during one observation and 550 during another, that does not automatically mean demand increased. It may reflect seasonal assortment changes, product launches, discontinued items, or other merchandising decisions. Additional signals are required before interpreting the cause.
2020–2026 market evolution
From 2020 through 2026, digital fashion catalogs became increasingly important sources of observable market intelligence. Product-level analysis moved beyond simple catalog counting towards understanding assortment structure, price bands, promotional intensity, and product turnover. This was especially relevant for brands with frequent collection updates, where a static list could quickly become outdated. Pull&Bear's official materials describe collections as continuously updated and highlight multiple clothing and accessory lines, reinforcing why category-level and product-level monitoring can provide useful context. (Pull&Bear) Over this period, fashion businesses also became more interested in comparing historical catalog states. Rather than asking only how many products are available today, analysts could investigate which products were introduced, which disappeared, and how price positioning changed. This created a more detailed approach to assortment intelligence. By 2026, a structured product dataset could therefore support category managers, buyers, researchers, and strategy teams by connecting individual product records with price, category, availability, and collection-date information.
How can current pricing signals strengthen competitive analysis?
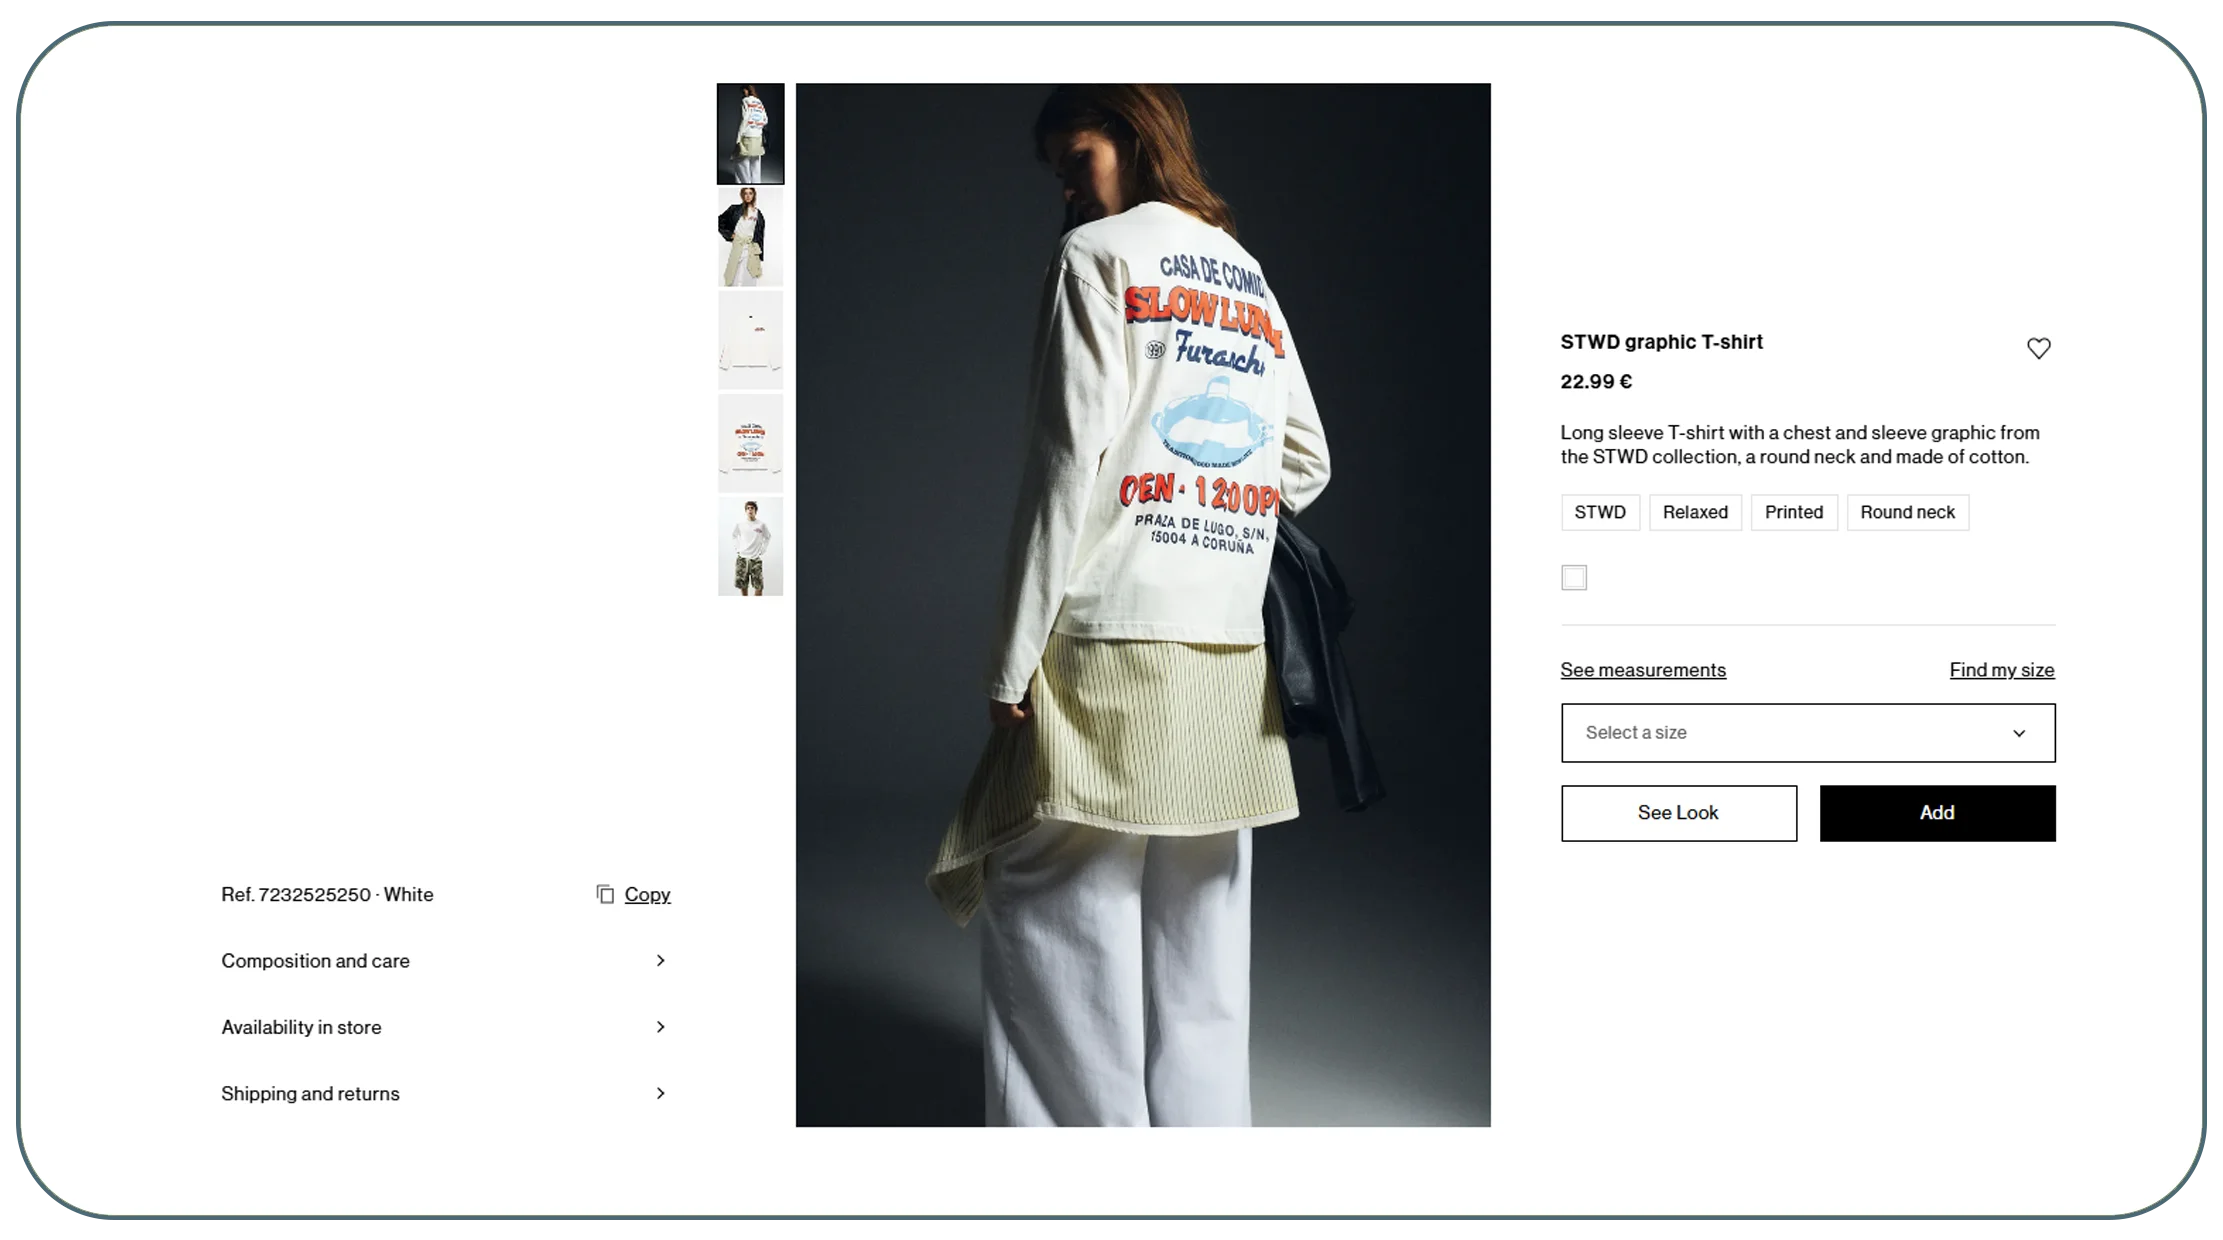
Real-time Pull & Bear product price analysis can help businesses monitor price movements instead of relying on outdated benchmarks.
Fashion pricing is dynamic. Products can move between full-price and promotional states, while new collections can introduce different price points.
Key pricing metrics
| Metric | Purpose |
|---|---|
| MRP | Reference price |
| Selling price | Current market price |
| Promotion | Discount measurement |
| Price change | Movement detection |
| Price band | Assortment positioning |
| Category average | Category benchmark |
| Historical price | Trend analysis |
A business can create a competitor watchlist containing selected products and monitor those products at defined intervals.
The resulting analysis could identify:
- Price increases
- Price reductions
- New promotional activity
- Products entering sale
- Changes in category-level price distribution
- Persistent price differences
- Changes in promotional frequency
Why historical price matters
One price observation answers only one question: What is the price now?
A historical dataset can answer:
- What was the price last week?
- Has the discount appeared repeatedly?
- Is this a seasonal promotion?
- Which categories experience greater price movement?
- Are competing products moving in the same direction?
This makes historical data more valuable for strategic analysis.
Practical use case
A fashion retailer could define 200 competitor products across jeans, tops, jackets, and footwear. The workflow could collect product prices daily or weekly, depending on the business requirement.
After several weeks, analysts could calculate:
Price Change = Current Price - Previous Price
and
Discount Rate = (MRP - Selling Price) ÷ MRP × 100
These metrics can then be grouped by category or product type.
2020–2026 market evolution
Between 2020 and 2026, online fashion pricing became increasingly observable and dynamic. Promotions, seasonal collections, product launches, and inventory conditions could all affect the displayed price of individual products. This increased the value of historical price monitoring. A single price snapshot could show the current position but could not explain whether the price represented a normal level, a temporary promotion, or a recent change. Recurring collection allowed analysts to build price histories and examine changes at SKU and category levels. By 2026, the most useful pricing intelligence increasingly combined current values with historical context. This helped businesses distinguish isolated price changes from repeated promotional patterns. It also enabled more structured comparisons between price bands, categories, and competing products. Importantly, observed online prices should be interpreted as marketplace signals rather than complete evidence of a company's broader pricing strategy. When combined with internal sales, inventory, and promotional information, however, historical marketplace observations can provide a stronger foundation for competitive pricing analysis.
Need recurring product and price intelligence? Talk to Real Data API about building a customized fashion data workflow around your target categories, products, and competitive benchmarks.
Get Insights Now!How can API-based delivery make fashion intelligence easier to use?
A Pull & Bear fashion data API can help businesses integrate structured marketplace information with internal dashboards, databases, analytics tools, or other applications. A Pull & Bear fashion dataset can serve as the underlying data layer for those workflows.
API delivery is useful when teams need data repeatedly rather than as a one-time spreadsheet.
Example delivery architecture
| Stage | Output |
|---|---|
| Collection | Raw product records |
| Processing | Normalized fields |
| Validation | Quality-controlled records |
| Storage | Historical database |
| API access | Machine-readable |
| Dashboard | Business visualization |
| Alerts | Change notifications |
For example, a pricing team could consume structured price records through an API and connect them to an internal competitive-pricing dashboard. A merchandising team could use the same underlying dataset to monitor product additions and removals.
Data fields can include
- Product name
- Product identifier
- Category
- Subcategory
- Price
- Discount
- Availability
- Color
- Size
- Product URL
- Collection timestamp
The exact schema should be determined by the business use case.
2020–2026 market evolution
From 2020 to 2026, e-commerce data increasingly moved from isolated research files into integrated business systems. Fashion organizations wanted marketplace information to feed dashboards, analytics platforms, pricing workflows, and historical databases. This increased the importance of structured delivery formats and consistent schemas. An API-based approach can make recurring information easier for downstream systems to consume without repeatedly preparing manual spreadsheets. The underlying data still requires collection, validation, normalization, and quality controls, but the delivery layer can make that information more accessible across departments. By 2026, this approach supports a broader model of fashion intelligence in which marketplace observations become part of regular decision-making rather than a separate research exercise. For buyers, this can mean faster assortment comparisons. For pricing teams, it can mean more accessible benchmarks. For strategy teams, it can mean easier historical analysis. The central benefit is operational continuity: data can move from collection into established business workflows with less manual intervention.
How can historical records reveal assortment and market patterns?
Pull & Bear Fashion Datasets can provide a structured foundation for historical analysis when records are collected consistently.
The key advantage of historical data is that it helps analysts move from snapshots to patterns.
Useful historical indicators
| Indicator | Potential Insight |
|---|---|
| New SKU count | Product launch activity |
| Removed SKU count | Assortment turnover |
| Average price | Price positioning |
| Median price | Typical price level |
| Discount frequency | Promotional activity |
| Category share | Assortment focus |
| Availability changes | Stock movement |
| Product age | Catalog lifecycle |
For example, analysts can compare category composition month by month.
If denim products represent 20% of the tracked assortment in one period and 25% later, the change is measurable. However, the reason requires additional investigation.
It could result from:
- New product launches
- Seasonal demand
- Category strategy
- Product discontinuation
- Promotional activity
- Data-collection differences
This is why good fashion intelligence combines multiple indicators rather than relying on one metric.
Building a trend dataset
A useful historical structure can look like:
Date → Product → Category → Price → Discount → Availability → Brand → URL
With repeated observations, analysts can calculate changes across time.
2020–2026 market evolution
Fashion trend analysis became increasingly data-oriented between 2020 and 2026 as digital catalogs offered more observable signals about product introductions, category structures, prices, and availability. The growth of online fashion research created an opportunity to complement traditional trend reports with direct marketplace observations. However, marketplace data should not be treated as a complete measure of consumer demand. Product visibility, stock availability, and pricing are observable signals, while actual sales volumes may remain unavailable. Historical records are nevertheless useful because they reveal how the digital assortment changes. Analysts can identify recurring seasonal patterns, product turnover, price movements, and category expansion. Pull&Bear's current online catalog also actively presents new arrivals and seasonal trend collections, demonstrating how digital merchandising itself can be a source of observable trend information. (Pull&Bear) By 2026, the strongest analytical workflows increasingly combined marketplace observations with internal sales, consumer research, and broader market information to create a more complete view of fashion trends.
How can automated collection support apparel trend discovery?
Fashion Data Scraping can help researchers identify observable changes across product categories, pricing, assortment, and product attributes. A Pull & Bear fashion dataset can then organize these observations into a consistent historical structure.
Trend discovery can examine:
- Product categories
- Product types
- Colors
- Materials where available
- Price bands
- Discount patterns
- New-arrival frequency
- Assortment depth
- Product availability
- Seasonal changes
Pull&Bear's official website currently presents seasonal collections and trend-focused product groupings. For example, its U.S. women's collection highlights products such as wide-leg trousers, knitwear, jackets, coats, and accessories, while its new-arrivals content emphasizes changing seasonal styles. (Pull&Bear)
This type of public catalog information can be structured into a trend-monitoring framework.
Example trend framework
| Signal | Measurement |
|---|---|
| New arrivals | New SKU count |
| Category growth | Category SKU change |
| Price movement | Average/median price change |
| Color frequency | Color occurrence |
| Product type | Type-level share |
| Discounts | Discount frequency |
| Availability | In-stock ratio |
The data should be interpreted carefully. A product appearing frequently in a catalog does not necessarily mean it is a top-selling product. Similarly, a growing SKU count does not automatically indicate consumer demand.
Instead, these signals can identify what is changing in the digital assortment, which can then be combined with other evidence.
2020–2026 market evolution
Between 2020 and 2026, digital fashion trend research increasingly benefited from structured product observations. Traditional trend analysis often relied on runway reports, social media, surveys, editorial coverage, and consumer research. Marketplace data added another layer by showing what products brands actually make visible to shoppers at particular points in time. This enabled researchers to track changes in categories, product types, prices, colors, and assortment depth. The limitation is important: online catalog visibility does not equal consumer demand. A rigorous trend study should therefore combine marketplace signals with sales information, search trends, social signals, surveys, or other relevant evidence when available. By 2026, the strongest approach was not to replace traditional fashion research with scraping but to connect digital assortment observations with other sources. For retailers, this can help identify emerging product themes earlier, monitor competitive assortment decisions, and understand how fashion positioning changes across collection periods. Structured historical records make those comparisons easier because analysts can measure changes rather than relying entirely on subjective visual inspection.
Why Choose Real Data API?
Real Data API can help businesses build customized fashion-data workflows around specific products, categories, brands, pricing fields, and monitoring schedules.
The objective is to provide Fashion Datasets that are structured for actual business use rather than simply delivering large volumes of unorganized records.
Key capabilities
- Product data collection
- Category-level monitoring
- Price tracking
- Discount monitoring
- Availability tracking
- Historical datasets
- Product-level benchmarking
- Data normalization
- Data validation
- Scheduled collection
- API-ready delivery
- Custom data schemas
Who can benefit?
Fashion brands: Monitor competitors and assortment changes.
Retailers: Benchmark prices and category structures.
Market researchers: Build historical datasets for trend studies.
Pricing teams: Track product-level price movements.
Merchandising teams: Compare assortment breadth and product mix.
E-commerce agencies: Build recurring client intelligence workflows.
The most effective project starts with clearly defined business questions. Which categories matter? Which products should be tracked? How frequently should data be collected? Which fields are required? How should the output be delivered?
Once those requirements are established, the collection and delivery workflow can be designed around them.
Conclusion
Fashion intelligence becomes more useful when businesses can compare products, prices, categories, availability, and assortment changes over time rather than relying on isolated marketplace observations.
A structured Pull & Bear fashion dataset can support competitive benchmarking, pricing research, assortment analysis, and observable apparel-trend monitoring. Automated collection can reduce repetitive manual work, while historical records can provide context for interpreting changes.
For buyers and merchandising teams, this means faster category comparisons. For pricing teams, it means more structured competitive benchmarks. For market researchers, it means a repeatable evidence base for studying digital fashion assortments.
The most important principle is to connect data collection with a specific commercial question and validate the resulting data before using it for decisions.
Contact Real Data API to build a customized fashion data solution for product monitoring, price intelligence, assortment analysis, competitive research, and apparel trend tracking!
FAQs
What can a Pull & Bear fashion dataset contain?
A Pull & Bear fashion dataset can include product names, categories, prices, discounts, availability, URLs, attributes, and timestamps, depending on the required collection scope and accessible information.
Why use Pull & Bear fashion data scraping?
Pull & Bear fashion data scraping can automate recurring collection, helping businesses monitor product catalogs, pricing, availability, assortment changes, and competitive marketplace activity more efficiently.
How can businesses scrape Pull & Bear product data?
Businesses can scrape Pull & Bear product data through a structured workflow that identifies relevant pages, extracts required fields, validates records, normalizes values, and delivers analysis-ready datasets.
What is real-time Pull & Bear product price analysis?
Real-time Pull & Bear product price analysis focuses on frequently collected pricing observations, helping teams identify price changes, discounts, category-level movements, and competitive pricing signals.
How can Real Data API support fashion intelligence?
Real Data API can support customized fashion data workflows by providing structured collection, validation, historical storage, and delivery designed around specific products, categories, prices, and research requirements.
Latest posts
How Levi's Fashion Dataset Improves Fashion Intelligence Across Products, Prices, Categories, and Denim Market Trends?
How Myntra Fashion Dataset Solves Fashion Intelligence Challenges Across Products, Prices, Brands, and Fashion Market Trends?
How Hyatt Travel Dataset Helps Businesses Track Hotels, Room Prices, Amenities, Locations, and Travel Trends?

How Louis Vuitton Fashion Dataset Enables Better Analysis of Luxury Products, Prices, Brands, and Fashion Trends?






.png)



