Quick Summary
- Real estate data scraping helps investors evaluate property prices, rental potential, market demand, and competing listings to make more informed investment decisions.
- Structured property information supports location comparisons, investment screening, and trend analysis while reducing manual research.
- From 2020 to 2026, digital property research has become increasingly important, but investors should validate listing accuracy, timestamps, and data coverage before acting on insights.
Introduction
Real Estate Data Scraping Help Maximize Investment Opportunities by transforming online property listings, asking prices, rental information, and location-specific market signals into structured data that investors can compare and analyze. Investors, brokers, asset managers, and property research teams can use these insights to identify potential deals, evaluate local competition, and prioritize properties for further due diligence.
Real estate decisions often require information from multiple listing portals, agency websites, developer pages, and market sources. Collecting this information manually can be time-consuming, especially when prices, availability, property features, and rental estimates change frequently. Automated data collection helps organize these details into consistent records for analysis.
Using Web Scraping Helps Real Estate Businesses Increase Qualified Leads by revealing which locations, property types, price ranges, and listing characteristics align with a target buyer's or renter's requirements. When businesses combine listing intelligence with appropriate lead qualification processes, they can focus outreach on more relevant prospects rather than relying on broad assumptions.
For investment teams, the goal is not simply to collect more listings. It is to build a dependable view of the market, identify opportunities worth investigating, and support decisions with traceable evidence. Data should be checked for duplicate listings, outdated prices, missing fields, and differences between asking prices and completed transaction prices. Scraped listing information is a research input, not a guarantee of returns or a substitute for legal, financial, and property due diligence.
How can investors compare property prices across different locations?
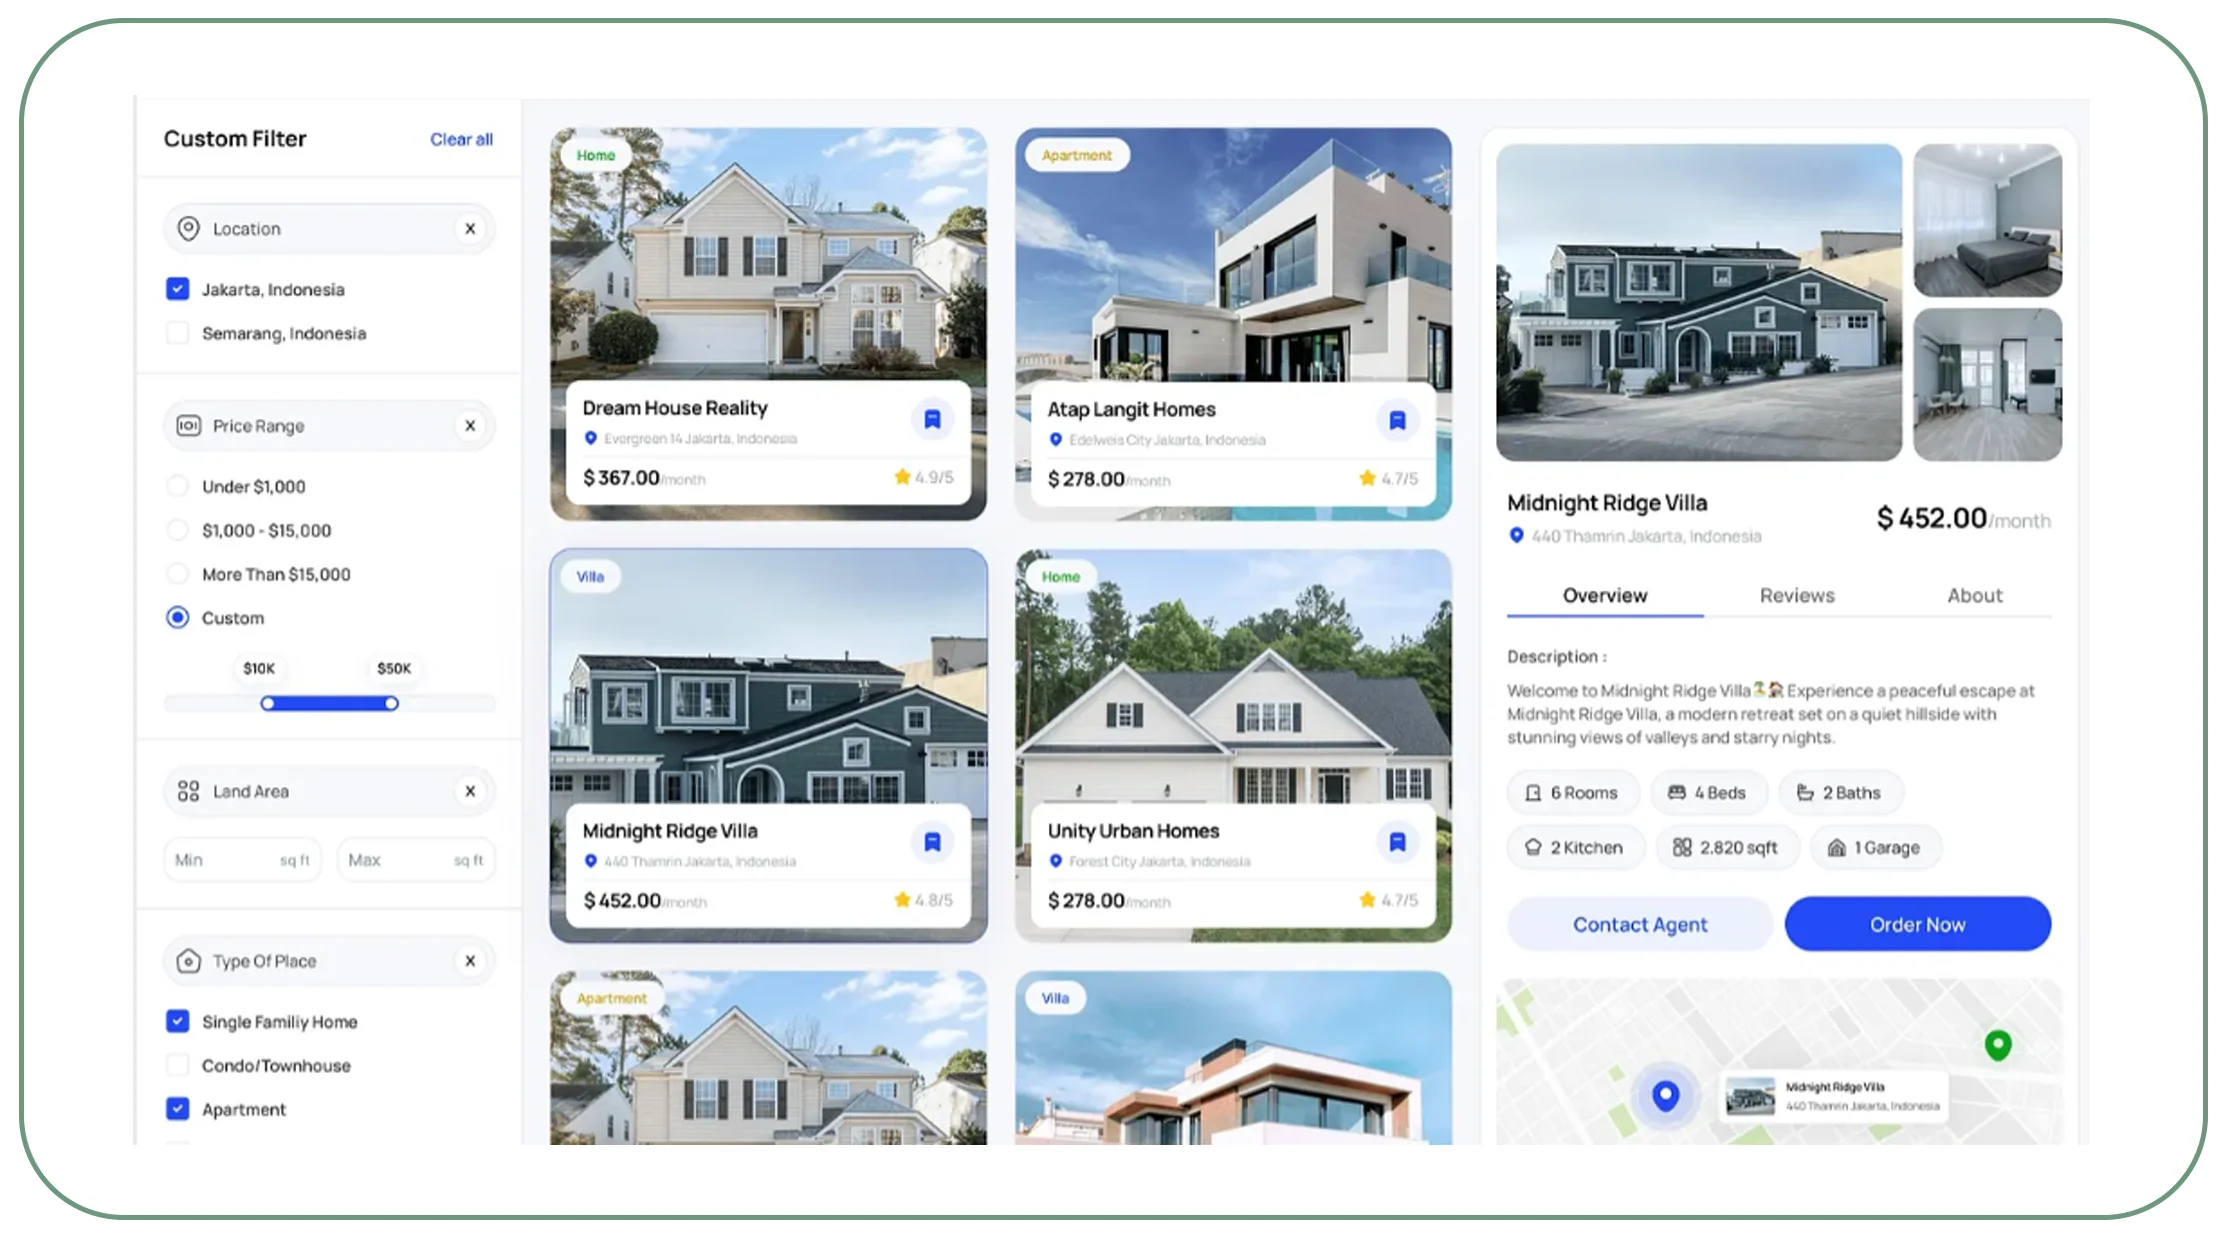
A property may look attractive in isolation but offer weaker value than a similar listing nearby. Investors need comparable data on asking price, property size, bedrooms, condition, neighborhood, listing date, and price changes. A real estate price web data scraper can gather publicly available listing details into a consistent dataset, making it easier to compare properties across neighborhoods, cities, and property categories. Real Estate Data Scraping helps organize this information for property comparison, market research, and investment analysis.
The process starts by defining a comparison group. For example, an investor evaluating two-bedroom apartments should avoid comparing them directly with luxury penthouses or properties in entirely different locations. Normalize prices by square foot or square meter, account for property condition where data is available, and separate asking prices from verified transaction prices.
What do real housing-market figures reveal?
The U.S. housing market demonstrates why tracking conditions over time matters. The National Association of Realtors reported that existing-home sales fell from approximately 6.12 million in 2021 to 4.09 million in 2023, before remaining near 4.06 million in 2024. These are national figures, not a prediction for an individual neighborhood.
| Year | U.S. existing-home sales | Practical research implication |
|---|---|---|
| 2020 | Approximately 5.64 million | Establish a pre-peak comparison baseline |
| 2021 | 6.12 million | Identify areas with heightened transaction activity |
| 2022 | 5.03 million | Compare demand with changing financing conditions |
| 2023 | 4.09 million | Review liquidity and time-to-sell indicators |
| 2024 | 4.06 million | Continue monitoring local supply and buyer activity |
Source: National Association of Realtors and Freddie Mac's 2024 reporting. Rounded figures; U.S. existing-home sales are used here as real-world market context, not as scraped listing data.
Real Estate Data Scraping Help Maximize Investment Opportunities when it allows investors to compare like-for-like listings, spot unusual price differences, and shortlist properties for independent valuation. Before drawing conclusions, remove duplicates, record the source and capture date, and verify whether the listing remains active.
How can online listings reveal promising investment opportunities?
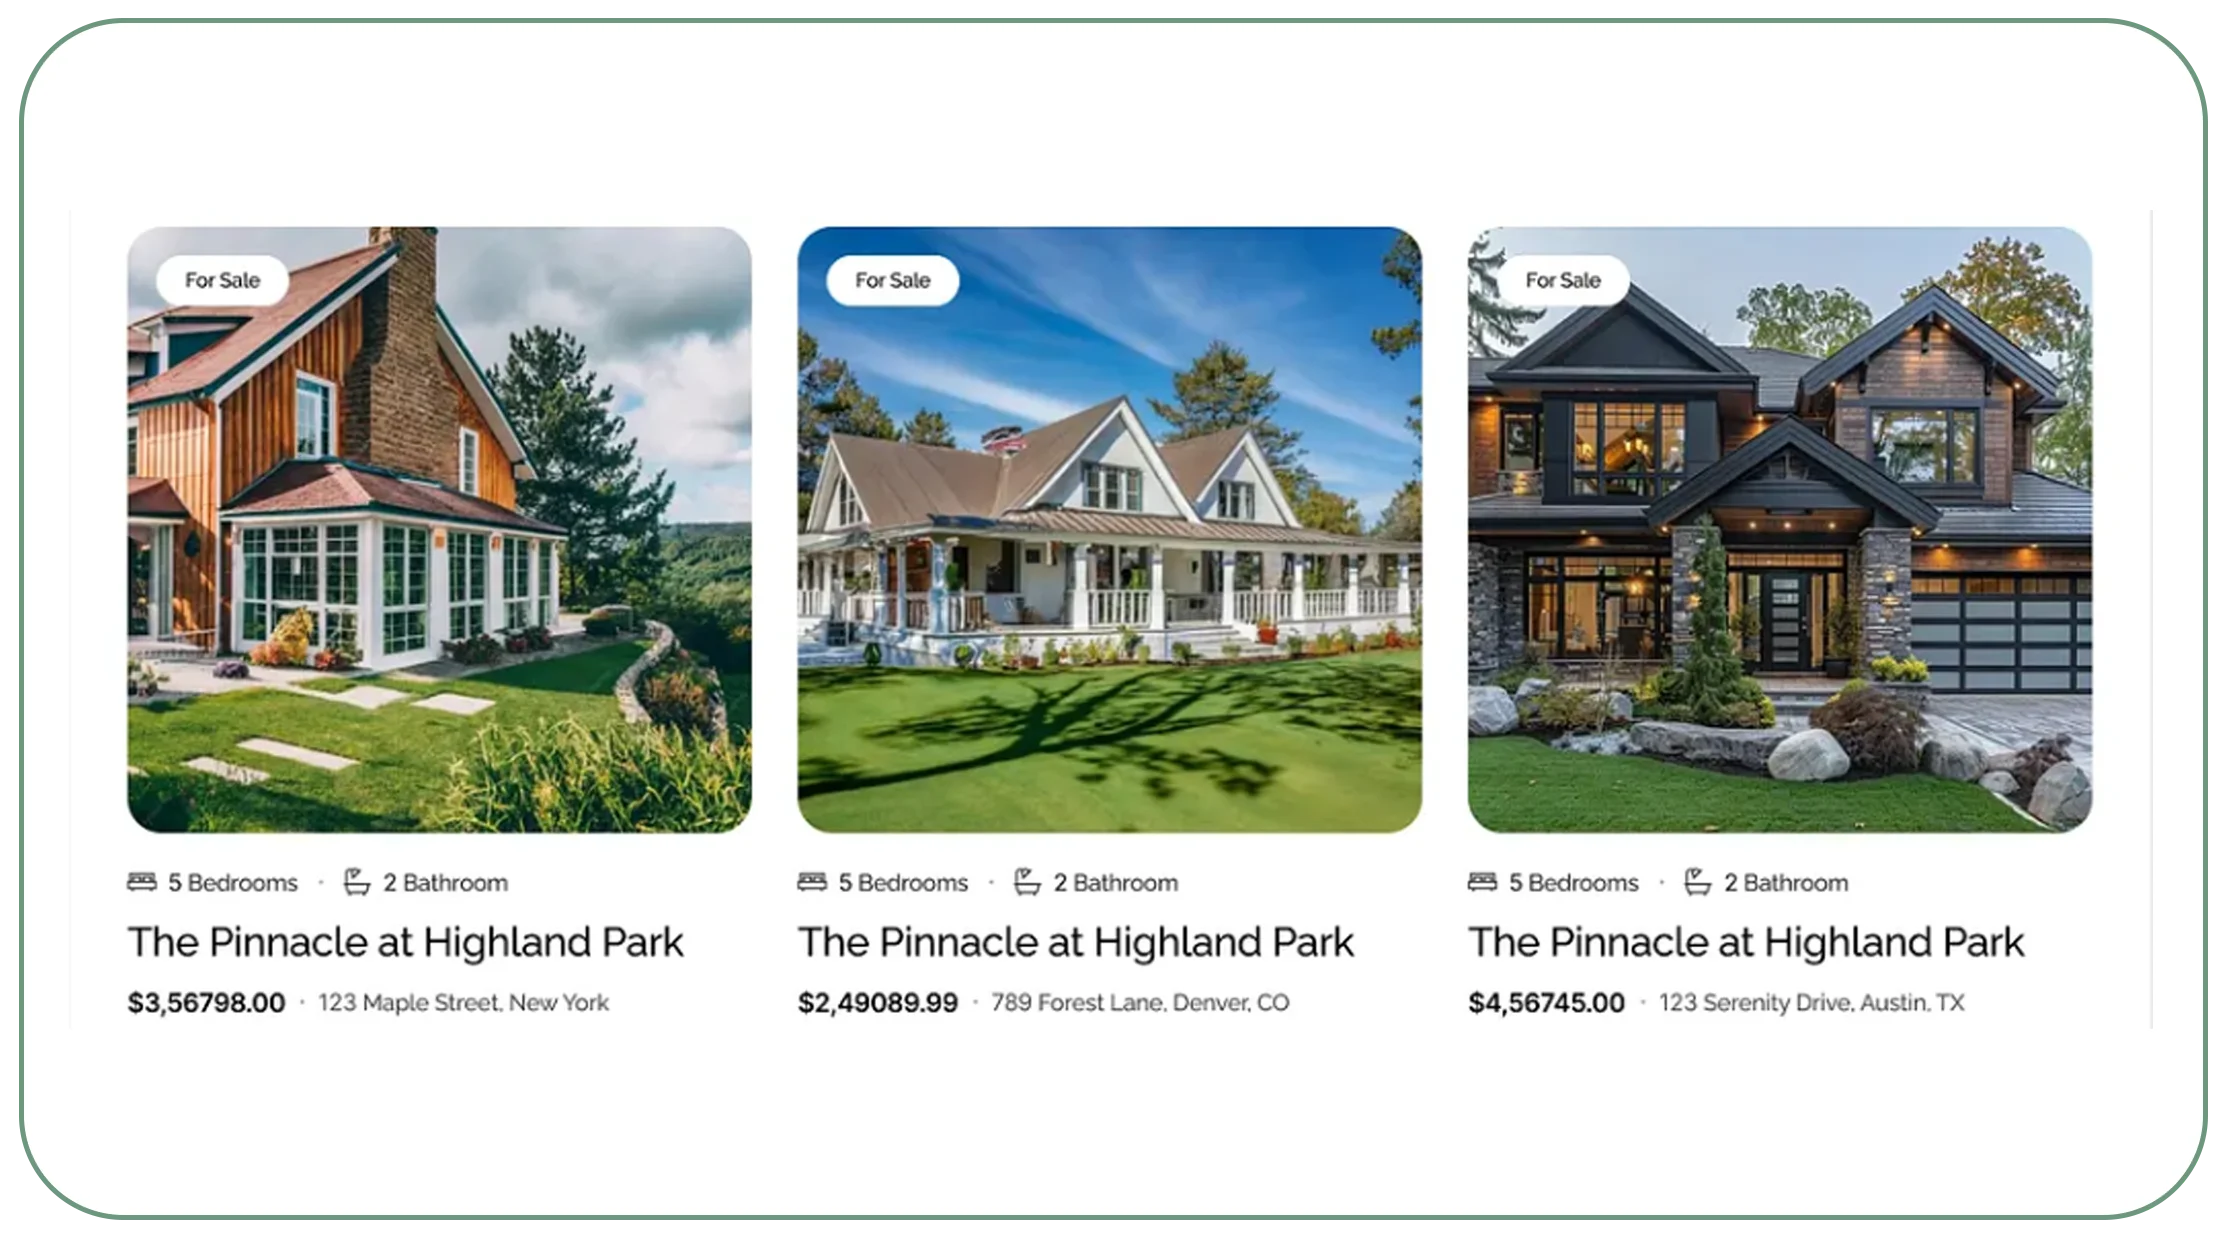
Investors can scrape real estate investment data to evaluate potential properties against a defined strategy rather than relying on scattered searches. Useful fields include asking price, property type, location, floor area, listing age, advertised rent, fees where disclosed, and price-change history. Additional sources may provide planning information, local economic indicators, population trends, or public transaction records, subject to availability and permitted use.
A practical screening workflow has four steps:
- Set investment criteria. Define budget, target locations, property type, expected holding period, and minimum acceptable yield.
- Collect comparable records. Gather current and historical listing information from relevant permitted sources.
- Calculate screening metrics. Compare asking price per unit area, gross rental yield where reliable rent data exists, and listing duration.
- Validate the shortlist. Confirm property status, comparable transactions, taxes, maintenance costs, financing, and legal conditions before making an offer.
A useful distinction is between a market signal and a verified opportunity. A property listed below the local asking-price median may be attractively priced, but it could also require major repairs, have legal restrictions, or be in a less desirable micro-location. Scraped listings help identify candidates; they do not establish fair market value by themselves.
Which indicators should investors track?
| Indicator | What it can show | What to verify |
|---|---|---|
| Asking price per square foot or meter | Relative listing price | Comparable size, condition, and location |
| Advertised rent | Potential rental income | Actual achievable rent and vacancy |
| Price reductions | Seller repricing or changing expectations | Original price and date of each change |
| Listing age | How long a property has been advertised | Whether relisting resets the displayed date |
| Active listing count | Visible supply in a selected segment | Duplicates and portal coverage |
| Property features | Fit with target tenant or buyer needs | Accuracy and completeness of descriptions |
How should trends from 2020 to 2026 be interpreted?
The 2020–2021 period provides a useful historical baseline for studying the effects of unusually low U.S. mortgage rates and strong housing activity. In subsequent years, higher borrowing costs changed affordability calculations. Freddie Mac's annual-average 30-year fixed mortgage rate rose from 2.96% in 2021 to 6.81% in 2023, before averaging 6.72% in 2024.
For 2025 and 2026, investors should add the latest available data from their own target market instead of assuming past patterns will continue. Use a consistent date range, label partial-year figures, and distinguish asking-price movement from completed-sale movement. This approach helps investment teams separate short-lived listing changes from more persistent market shifts.
How can connected data feeds make investment research more efficient?
A real estate investment data API can help teams access structured property information through a repeatable workflow rather than manually collecting individual records. Depending on the provider and permitted sources, an API-based feed may return listing identifiers, prices, addresses or geographic areas, property attributes, availability status, and capture timestamps. Coverage varies by market and source, so buyers should confirm supported fields, refresh frequency, historical depth, and delivery format before selecting a solution.
This is especially valuable for investment firms comparing multiple markets or managing a large acquisition pipeline. Standardized fields allow analysts to combine property listings with internal models, mapping tools, financial spreadsheets, and business intelligence dashboards. Stable identifiers and timestamps are important because a single property may appear on multiple portals or be updated without a clear change history.
Real Estate Data Scraping Help Maximize Investment Opportunities by helping teams keep a structured view of listing changes, compare new opportunities with previously captured records, and identify properties that meet changing investment criteria.
What should an investment-ready data workflow include?
| Workflow component | Purpose | Recommended quality check |
|---|---|---|
| Source collection | Gather permitted listing details | Monitor source coverage and collection errors |
| Field normalization | Standardize currencies, units, and categories | Validate conversion rules |
| Deduplication | Avoid counting one property several times | Match identifiers and property attributes |
| Change tracking | Preserve historical price and status changes | Keep timestamps and prior values |
| Analysis layer | Calculate comparable metrics | Document formulas and assumptions |
| Delivery | Send records to dashboards or internal systems | Test schema consistency and failed updates |
An effective API or automated feed should also support operational monitoring. Track missing fields, unexpected record drops, repeated failures, and stale data. If a source changes its layout or access rules, the system should flag the issue rather than silently deliver incomplete results.
Want to streamline property research and build a more consistent investment pipeline? Explore a data workflow tailored to your target markets, property types, and analytical requirements!
How can investors estimate property income and costs more realistically?
To extract property investment data effectively, investors should collect more than a property's advertised sale price. Rental listings, service charges, property taxes, estimated insurance, maintenance requirements, vacancy assumptions, and financing costs can all affect an investment's performance. Not every source publishes every field, so missing values should be identified rather than silently estimated.
For rental properties, gross rental yield is a useful initial screening measure:
Gross rental yield = Annual rental income / Property purchase price × 100
For example, if a property is listed at $250,000 and comparable advertised rent is $1,500 per month, annualized rent would be $18,000 and the indicative gross yield would be 7.2%. This is an illustrative calculation, not a market statistic or a forecast. It excludes vacancy, repairs, taxes, insurance, management fees, closing costs, and financing.
Why did financing assumptions matter from 2020 to 2026?
Changes in mortgage rates can significantly alter affordability and cash-flow projections. The following U.S. benchmark figures provide historical context for recalculating scenarios rather than assuming a fixed borrowing cost. The 2026 figure is a year-to-date average through September 30, not a full-year result.
| Year | Average U.S. 30-year fixed mortgage rate | Investment-analysis use |
|---|---|---|
| 2020 | 3.38% | Baseline for a low-rate period |
| 2021 | 3.15% | Compare financing-sensitive valuations |
| 2022 | 5.53% | Recalculate monthly payment assumptions |
| 2023 | 7.00% | Stress-test leveraged purchases |
| 2024 | 6.90% | Reassess debt costs and cash flow |
| 2025 | 6.66% | Update models using annual benchmark data |
| 2026* | 6.46% | Use as a partial-year reference only |
Source: Bankrate's historical mortgage-rate table, which uses Freddie Mac rate data for historical benchmarks. Rates are U.S. averages and may differ from an individual borrower's actual offer. *2026 through September 30.
For practical screening, calculate net operating income using documented assumptions, then model optimistic, base, and downside cases. Compare the same expense categories across properties. When rent or expense information is incomplete, label it as an estimate and validate it independently before making an investment decision.
How can automated monitoring improve market visibility?
Real Estate Data Scraping can support ongoing monitoring by capturing listing information on a schedule and comparing new records with earlier observations. Instead of checking each property portal individually, investment teams can receive a consolidated view of new listings, price reductions, removed listings, and changes in advertised property details.
The value comes from consistent observation over time. A single snapshot shows what is listed now; a history of snapshots may reveal how asking prices change, how long listings remain visible, and which property segments show shifts in advertised supply. However, listing age and removal are imperfect indicators: a property can be relisted, sold privately, or removed for reasons unrelated to a completed transaction.
What should a monitoring dashboard show?
| Dashboard measure | Suggested calculation | How it supports research |
|---|---|---|
| Median asking price | Median of comparable active listings | Reduces the influence of extreme prices |
| Price-change rate | Listings with price changes ÷ tracked listings | Highlights repricing activity |
| New-listing share | Newly observed listings ÷ current tracked listings | Tracks incoming visible supply |
| Listing persistence | Days between first and last observation | Helps study listing duration |
| Advertised rental yield | Annualized advertised rent ÷ asking price | Supports preliminary rental screening |
| Data freshness | Time since last successful collection | Warns analysts about stale records |
These measures should be segmented by property type, location, size, and price band. A citywide median can conceal meaningful differences between neighborhoods or between new-build and older properties. Where practical, use geographic boundaries and comparable property characteristics consistently across reporting periods.
How should teams handle the 2020–2026 comparison period?
Build a historical timeline using dated snapshots and clearly document changes in data sources, field definitions, and coverage. For 2020–2021, older data may be incomplete or unavailable from current listing pages; use licensed archives or reliable public datasets where permitted. For 2022–2026, keep the same definitions wherever possible and annotate any source or methodology changes. This avoids treating changes in collection coverage as if they were changes in the property market.
Real Estate Data Scraping Help Maximize Investment Opportunities when monitoring outputs are treated as evidence for further investigation—not as automatic buy or sell signals. Analysts should confirm material changes at the source and check local regulations, title records, financing terms, and property condition before committing capital.
How can a scalable technical setup support property research?
A Real Estate Scraping API can be part of a scalable system that collects, standardizes, and delivers property records for analysis. Before implementation, define which sources are permitted, what information is necessary, how often it should refresh, and how long historical records should be retained. A focused data specification usually delivers more value than collecting every available field without a clear use case.
A robust setup commonly includes:
- Source management: Keep an inventory of sources, access permissions, refresh schedules, and coverage limits.
- Structured extraction: Capture relevant fields such as listing identifier, price, property type, location, area, status, and timestamp where available.
- Validation: Flag impossible prices, inconsistent units, missing locations, and unexpected schema changes.
- Historical storage: Preserve dated snapshots to compare observed changes over time.
- Delivery and integration: Provide structured records in a format compatible with analytical tools and internal systems.
- Governance: Apply access controls, retention policies, and documented procedures for handling personal information.
What quality controls should be measured?
| Quality measure | Example target-setting approach | Why it matters |
|---|---|---|
| Field completeness | Set a minimum percentage for critical fields | Makes records usable for comparisons |
| Duplicate rate | Establish a threshold after testing sample data | Prevents overstated listing counts |
| Freshness | Define a refresh window based on market needs | Reduces reliance on stale listings |
| Error rate | Track failed requests and malformed records | Reveals collection issues |
| Coverage | Measure monitored sources and locations | Makes gaps visible to decision-makers |
| Traceability | Store source and capture timestamp | Supports auditing and verification |
Targets should be agreed after a pilot rather than advertised as guaranteed outcomes. A daily refresh may suit active price monitoring, while a less frequent schedule could be enough for broad market research. The correct cadence depends on source behavior, permitted access, budget, and the pace of decisions.
A scalable system should also respect website terms, applicable law, robots directives where relevant, and privacy requirements. Collect only necessary information, avoid bypassing access controls, and use licensed or authorized sources where required. These safeguards help make property intelligence more reliable and sustainable.
Why choose Real Data API for property intelligence?
Real estate investors need data that is consistent, relevant, and usable in their existing research process. A structured data solution can help reduce repetitive collection work and give analysts more time to assess opportunities, verify assumptions, and compare potential investments.
A useful provider or implementation partner should help businesses define their data requirements before scaling collection. Consider the following criteria when evaluating a solution:
- Relevant coverage: Check whether the sources include your target locations, property types, and required listing attributes.
- Consistent structure: Ensure prices, units, property categories, and location fields can be compared reliably.
- Historical visibility: Determine whether dated snapshots or change histories are available for trend analysis.
- Data-quality controls: Ask how duplicate records, missing fields, and unexpected changes are identified.
- Integration readiness: Confirm whether the delivery format works with your dashboards, databases, and internal analytics.
- Responsible collection: Verify source permissions, data-use restrictions, privacy safeguards, and retention practices.
Real Estate Datasets are most useful when they align with a specific decision, such as screening rental properties, comparing asking prices, or identifying locations for further research. A smaller, well-validated dataset can be more valuable than a large collection with inconsistent fields or unclear provenance.
Real Data API can be considered when planning a structured data workflow around these requirements. Before implementation, define a pilot covering a limited set of locations and property types, establish measurable quality checks, and confirm that the delivered fields support the intended investment analysis.
Conclusion
Property investment research is more effective when decisions are based on comparable listings, reliable historical observations, and realistic income and cost assumptions. Automated collection can help investors identify properties for further evaluation, monitor changes in asking prices, compare markets, and reduce time spent gathering information manually.
The most important step is to turn collected records into a repeatable decision process. Normalize property attributes, remove duplicate listings, preserve capture timestamps, distinguish asking prices from completed-sale prices, and verify important details before acting. Historical trends from 2020 to 2026 can provide context, but local conditions and current financing assumptions must guide each assessment.
Ultimately, Real Estate Data Scraping Help Maximize Investment Opportunities when it supports disciplined screening, transparent calculations, and informed due diligence—not when it replaces professional judgment.
Ready to make your property research more data-driven? Define your target markets, identify the listing and pricing signals that matter most, and explore how Real Data API can provide structured property data to support your investment workflow.
FAQs
1. How does a real estate price web data scraper help investors?
A real estate price web data scraper collects listing prices and property attributes from permitted sources, helping investors compare similar properties, identify pricing differences, and shortlist opportunities for independent valuation.
2. Is it possible to scrape real estate investment data across multiple locations?
Yes, businesses can scrape real estate investment data from multiple permitted sources when coverage and access allow. Standardized locations, currencies, units, and timestamps make cross-market comparisons more consistent.
3. What is a real estate investment data API used for?
A real estate investment data API delivers structured property information to compatible systems, helping analysts automate data ingestion, maintain comparable records, and support dashboards or investment screening models.
4. Which information should investors collect to extract property investment data?
To extract property investment data, prioritize asking price, property type, area, location, listing status, advertised rent where available, price history, and capture timestamps. Validate important fields before investment decisions.
5. Can Real Data API support Real Estate Data Scraping?
Real Estate Data Scraping can help organize property listings and monitor changes over time. Real Data API can be evaluated against source coverage, data quality, integration needs, refresh frequency, and applicable access requirements.
Latest posts
How Real Estate Data Scraping Help Maximize Investment Opportunities with Real-Time Property Listings and Investment Insights
How Instacart API for grocery availability data Helps Retailers Solve Real-Time Stock Visibility Challenges
Why Swiggy API for real-time food delivery data Matters for Tracking Menus, Offers, Availability, and Competitor Trends

How ecommerce scraping API for real-time product data Helps Businesses Track Prices, Inventory, and Competitor Changes







.png)



