Quick Summary
- Swiggy data extraction for food delivery market analysis helps restaurants compare listed prices, evaluate competitor menus, and identify changes in the online food marketplace.
- Swiggy Food Data Scraping supports structured research into restaurant listings, menu availability, ratings, and customer-facing offers, subject to permitted data access.
- Consistent data collection and historical comparisons help food businesses make better-informed pricing, menu planning, and competitive positioning decisions.
Introduction
Restaurants competing on food delivery platforms need more than an attractive menu. They need a reliable view of competing prices, menu availability, ratings, promotions, and changes in local restaurant supply. Swiggy data extraction for food delivery market analysis helps businesses organize accessible marketplace information into structured datasets for competitive research and operational planning. Instead of manually checking individual listings, restaurant teams can compare records over time and identify differences that deserve attention.
The opportunity is significant because India's digital food delivery market continues to expand. Grand View Research estimated India's online food delivery market revenue at approximately US$26.2 billion in 2024 and projected it could reach US$59.6 billion by 2030. These are market research estimates, not Swiggy-specific revenue figures.
For restaurants, the practical challenge is turning this market growth into profitable decisions. A competitor's lower listed price may reflect a temporary promotion, a different portion size, or a platform-funded offer. Data must therefore be standardized and interpreted in context. Through Swiggy Food Data Scraping, businesses can develop a consistent process for tracking publicly accessible restaurant and menu information, subject to platform terms, access permissions, and applicable laws. The objective is not simply to collect data; it is to improve pricing decisions, competitive visibility, and menu strategy.
How can restaurants establish a reliable competitive baseline?
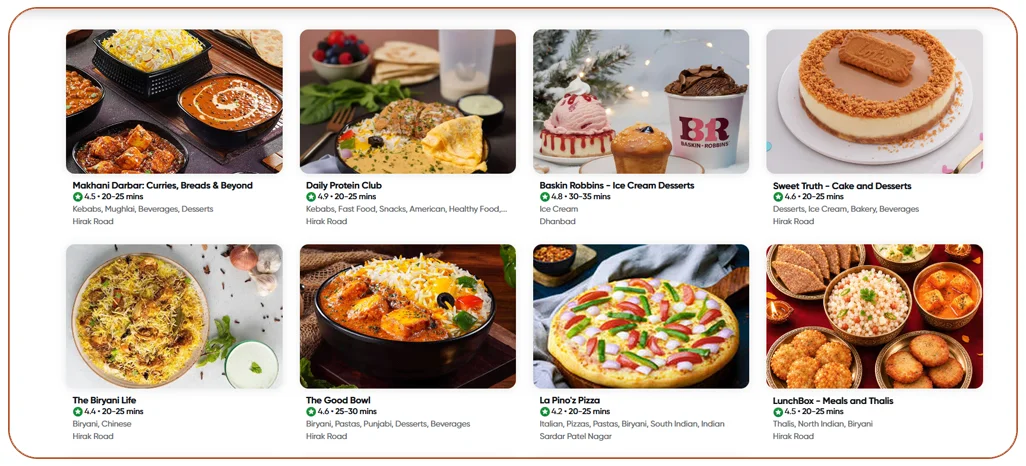
Swiggy data scraping for restaurant benchmarking enables restaurants to compare their customer-facing offers with similar businesses in a defined locality, cuisine, or price segment. A useful benchmark includes restaurant names, cuisine categories, menu items, listed prices, portion descriptions, ratings, and promotional information where available. These fields help businesses understand how their offerings appear beside competing options.
The first step is defining a relevant peer group. A premium North Indian restaurant should not benchmark every restaurant within a five-kilometre radius. It should prioritize competitors with similar cuisines, price points, meal occasions, and delivery coverage. Once the comparison group is defined, menu names and sizes should be standardized to prevent misleading comparisons between dissimilar products.
Historical context matters, too. During 2020, pandemic restrictions accelerated the importance of digital ordering for many restaurants. From 2021 to 2023, businesses increasingly had to understand online discovery, promotions, and digital customer acquisition. By 2024 and 2025, competitive research increasingly involved monitoring multiple menu and price signals together. In 2026, restaurants can use recurring snapshots to establish more consistent benchmarks, provided the collection method is permitted and the underlying data is available.
A practical benchmark should distinguish a regular listed price from a discounted price and record when the observation was collected. It should also flag missing or uncertain values instead of treating them as confirmed facts. This prevents a temporary offer or a mismatched portion size from driving an unnecessary price reduction.
What does the market data tell restaurant operators?
The following figures provide market context, rather than measured results from an individual restaurant benchmarking project.
| Indicator | Published figure | Business relevance |
|---|---|---|
| India's online food delivery market revenue, 2024 | US$26.2 billion | Shows the scale of the digital channel |
| Projected market revenue, 2030 | US$59.6 billion | Highlights expected growth in online ordering |
| Forecast CAGR, 2025–2030 | 14.2% | Indicates continued expansion potential |
Source: Grand View Research's India online food delivery market outlook. Figures are estimates and forecasts.
For restaurant owners, the actionable takeaway is to build benchmarks around comparable dishes and competing restaurants, not isolated price points. A consistent baseline makes it easier to identify whether the business is priced above, below, or in line with its chosen market segment.
Which menu details should businesses organize for better decisions?
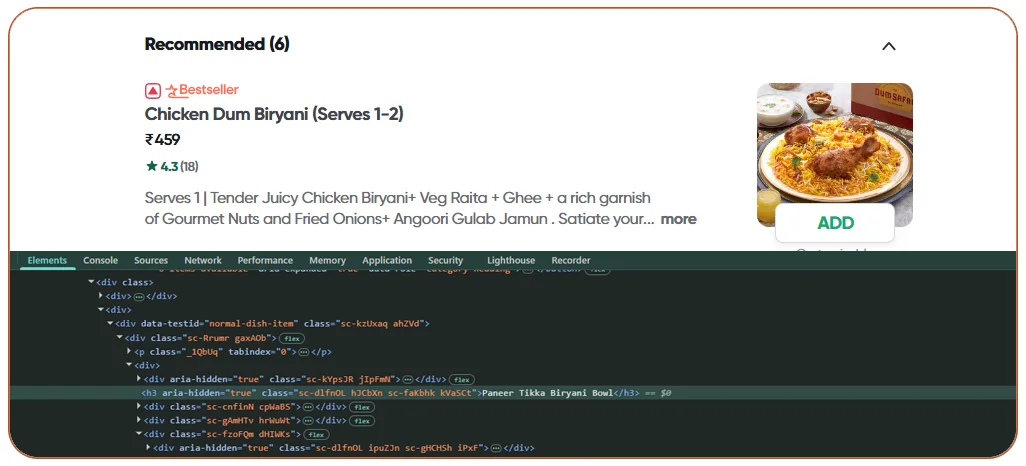
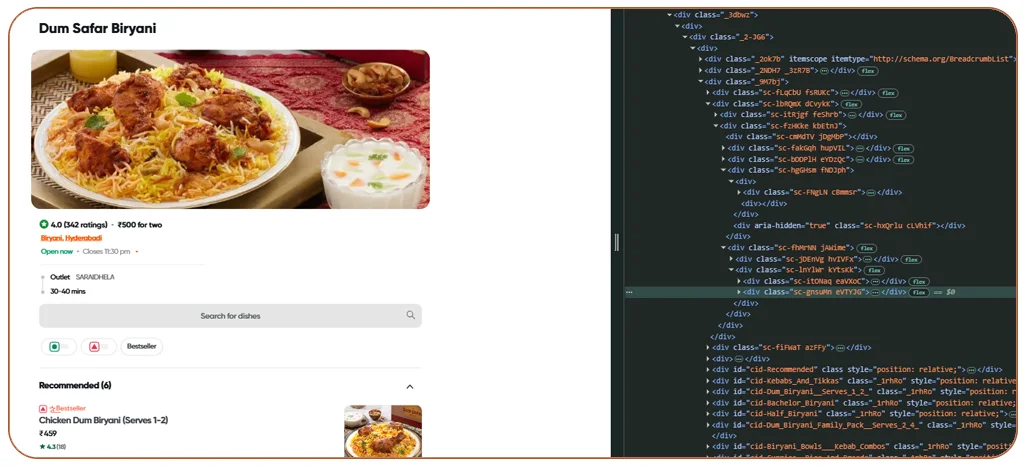
A Swiggy restaurant menu data API workflow can help businesses structure menu information into a format suitable for comparison and reporting, where authorized API access is available. If an API does not expose a required field, the business should not assume it can retrieve that information. The data collection method must match the access permitted by the platform.
A useful menu dataset may contain restaurant identifiers, item names, descriptions, categories, listed prices, serving sizes when displayed, vegetarian indicators where available, ratings, and listing URLs. Collection timestamps help analysts distinguish current observations from historical records. Unique identifiers and normalized names make it easier to match the same restaurant or dish across repeated observations.
The 2020–2026 evolution of digital food ordering also demonstrates why clean data matters. In 2020, restaurants needed visibility into online menus as dine-in activity was disrupted. Between 2021 and 2022, more businesses explored digital-first menus, delivery-focused brands, and cloud-kitchen formats. In 2023 and 2024, wider competition made menu differentiation and price comparison increasingly important. By 2025 and 2026, structured records can support more repeatable analysis, including category-level comparisons and tracking changes in item availability.
Data quality is essential. "Paneer Tikka Roll" and "Paneer Tikka Wrap" may or may not describe equivalent products. Analysts should avoid automatically merging similar names without checking descriptions, sizes, and other attributes. Similarly, a missing price should remain missing rather than being replaced with an estimated figure.
Which fields make a menu dataset more useful?
| Data field | What it helps answer | Quality check |
|---|---|---|
| Restaurant and location | Which competitors are relevant? | Confirm location and identity |
| Menu item and category | Which products are comparable? | Normalize names and categories |
| Displayed price | How do listed prices differ? | Record currency and collection time |
| Offer or discount | Is the observed price promotional? | Separate regular and offer prices |
| Availability indicator | Is the item currently listed as available? | Record the observation timestamp |
| Rating and review count | What public reputation signals are visible? | Retain the displayed value and source context |
These fields can support a searchable menu catalogue and make it easier to compare equivalent products. Businesses should document collection frequency, permitted use, and data limitations before using the dataset for commercial decisions.
How can restaurants track menu prices without reacting to misleading changes?
Real-time Swiggy menu price monitoring can help restaurants observe listed-price changes and promotional activity more consistently. However, "real-time" should be used carefully: actual update speed depends on the authorized data source, collection frequency, platform availability, and technical limitations. A scheduled snapshot may be sufficient for many pricing decisions, while rapidly changing campaigns may require more frequent checks where permitted.
An effective monitoring process records the regular displayed price, promotional price if shown, item identity, restaurant, location, and observation time. It then compares the latest record with the previous observation. Changes should be flagged for review rather than triggering automatic repricing without context.
This distinction became especially important during the 2020–2021 disruption, when restaurants frequently had to adapt their digital operations and customer offers. Between 2022 and 2024, businesses continued adjusting menus and promotions as customer demand and operating costs changed. In 2025–2026, historical price snapshots can help operators distinguish a short-lived promotion from a sustained change in competitor pricing. These are broad industry developments, not a claim that every restaurant followed the same trajectory.
Restaurants should also consider price comparability. A competitor's listed price may exclude delivery fees, taxes, or other checkout charges, and a promotional price may be available only to selected customers. Menu-level comparisons should therefore be treated as directional unless the full customer-facing conditions are consistently captured and comparable.
How should price changes be interpreted?
| Observed signal | Possible explanation | Recommended action |
|---|---|---|
| One-day price reduction | Temporary offer or campaign | Check subsequent observations |
| Repeated reduction across weeks | Possible pricing strategy change | Review margins and competitor positioning |
| Item disappears from a listing | Temporary unavailability or menu change | Recheck before drawing conclusions |
| Similar items show very different prices | Portion, ingredients, or naming differences | Validate product comparability |
| Price rises across multiple categories | Menu revision or cost pressure | Review internal costs before responding |
The business value lies in separating a verified change from a noisy observation. Restaurants should combine market signals with ingredient costs, labour, packaging, commission arrangements, and contribution margins. Competitor data can inform a decision, but it cannot determine a profitable price on its own.
Want a clearer view of competitor menus and price movements? Build a structured monitoring plan around the restaurants, dishes, and locations that matter most to your business.
Get Insights Now!How can food businesses identify demand patterns and market opportunities?
Restaurants can extract Swiggy food market insights by combining menu information with publicly visible market signals and reviewing how those signals change over time. The aim is to identify opportunities worth investigating, such as underrepresented cuisine categories, differences in menu positioning, and competing restaurants that appear to target similar customer groups.
A useful analysis starts with a specific business question. For example, a restaurant may want to know whether competing outlets offer more affordable lunch combinations, whether a cuisine category has a broad selection in a particular locality, or whether similar restaurants display different prices for comparable dishes. Structured marketplace data can help generate hypotheses, but it cannot independently establish actual order volumes, customer preferences, or sales performance unless those measures are available from a reliable source.
The 2020–2022 period increased the importance of digital ordering as restaurants adapted to changing customer habits. From 2023 to 2024, online food delivery remained an important distribution channel for restaurant discovery and convenience. In FY2024–25, Swiggy reported 923.31 million B2C orders across its consumer-facing platform and an average of 17.7 million monthly transacting users across that platform. These figures cover the broader B2C business, not food delivery alone.
For 2025–2026 planning, restaurant teams can use such industry indicators alongside their own sales records and permitted marketplace observations. This helps distinguish broad market growth from the performance of an individual menu item. The strongest analysis combines external signals with internal information, including ingredient costs, order history, margins, and customer feedback.
Which business indicators are worth tracking?
| Indicator | What it reveals | How to use it |
|---|---|---|
| Cuisine availability | How many relevant options appear in the selected market | Identify gaps or crowded categories |
| Price distribution | How comparable menu items are priced | Review the restaurant's market position |
| Menu variety | The range of dishes and combinations listed | Assess differentiation opportunities |
| Ratings and review counts | Publicly displayed reputation signals | Identify areas for further investigation |
| Listing changes | Changes in visible items, prices, or availability | Prioritize follow-up research |
A practical opportunity assessment should rank findings by relevance and confidence. For instance, a gap in affordable vegetarian meals may justify testing a new combination, but the decision should also account for local demand, kitchen capacity, food costs, and profitability. This turns market research into a decision-support process rather than a collection of interesting but disconnected observations.
How does automated collection reduce repetitive research?
A Swiggy Scraper is a data collection tool or workflow designed to retrieve permitted information from accessible platform pages or authorized data sources. For restaurant businesses, its potential value comes from reducing repetitive manual checks and organizing records in a consistent structure. The tool must respect applicable access restrictions, platform terms, privacy obligations, and technical controls.
An effective workflow begins with a defined scope. The business selects the restaurants, locations, menu categories, and fields it needs. Collection then follows the permitted access method and frequency. The resulting records are validated, standardized, and stored with timestamps so that analysts can compare observations across collection periods.
The need for reliable data workflows has grown alongside digital restaurant operations. In 2020, many businesses had to establish or improve their online presence. During 2021–2022, digital ordering and delivery-focused business models continued to evolve. In 2023–2024, restaurant operators increasingly needed consistent information to evaluate online competition. In 2025–2026, automation can help scale recurring research, but only when data quality and authorized access are built into the process.
Automation does not eliminate every data challenge. Page structures may change, fields may be missing, listings may be personalized, and availability can vary by location or account. A robust process should flag unexpected changes, record failures, and avoid treating missing information as zero. It should also prevent duplicate records and preserve enough history to explain how a comparison was produced.
What should an automated workflow include?
| Workflow stage | Recommended practice | Expected benefit |
|---|---|---|
| Scope definition | Select relevant restaurants, locations, and fields | Keeps research focused |
| Authorized collection | Use permitted APIs or access methods | Reduces access and compliance risks |
| Validation | Check missing values, duplicates, and formats | Improves consistency |
| Historical storage | Keep timestamped snapshots where permitted | Supports change analysis |
| Reporting | Produce comparable tables and dashboards | Makes findings easier to act on |
Businesses should monitor collection quality as well as business metrics. Useful checks include the percentage of records with valid prices, the number of unmatched menu items, duplicate rates, and the freshness of the latest observation. These measures help teams understand whether the information is dependable enough to support a decision.
When should businesses use an API-based approach?
A Swiggy API approach may be suitable when the business has authorized access to an interface that exposes the fields it needs. APIs can provide structured responses and reduce the need to interpret page layouts, but access to an API does not automatically mean every restaurant, price, rating, or availability field is available. The available schema, usage limits, and contractual permissions determine what can be collected.
The right choice depends on the task. A small restaurant comparing a limited set of competitors may need a modest, scheduled dataset. A multi-location restaurant group may require a broader workflow with historical snapshots, standardized product matching, and recurring reports. A market research team may need additional validation and documentation so that its findings can be reproduced.
From 2020 through 2022, digital ordering adoption made online menu visibility more important to restaurant operators. During 2023–2024, increasing competition reinforced the value of comparable data. Swiggy's FY2024–25 annual report recorded 238,000 average monthly transacting restaurant partners across its platform, demonstrating the scale of its partner ecosystem. That figure is a platform-wide measure, not a count of restaurants in any particular city or cuisine.
In 2025–2026, API-based data workflows can support more consistent reporting where the necessary authorized access exists. Businesses should verify field availability before designing dashboards and should document any gaps. If an API does not expose historical prices, for example, historical analysis may require permitted snapshots collected over time rather than assuming that past values can be retrieved directly.
The best technical setup is one that fits the decision being made. Data volume alone is not a measure of success. Reliable matching, appropriate collection frequency, transparent limitations, and useful reporting matter more than gathering every available field.
Why choose Real Data API?
Real Data API can be positioned as a partner for businesses that need structured web data workflows and market intelligence. A useful engagement begins with a clear business objective, such as improving competitor price visibility, comparing menu categories, or tracking changes across selected restaurant listings.
The process should define the required fields, collection scope, permitted access methods, update frequency, validation rules, and delivery format before implementation. These requirements help ensure the resulting dataset is relevant to the team's reporting needs rather than simply large.
A well-designed Swiggy Food Dataset can organize restaurant details, menu items, displayed prices, categories, ratings, and observation timestamps where those fields are available and authorized for collection. Standardization and validation can make records easier to compare, while historical snapshots can support trend analysis. The dataset should also document unavailable fields and collection limitations so analysts can distinguish observed facts from assumptions.
For businesses evaluating a data provider, important considerations include data quality controls, repeatability, clear documentation, scalability, and responsible access practices. The final workflow should support practical decisions and integrate with the reporting tools the business already uses.
Conclusion
Restaurants can make more informed pricing and competitive decisions when they have a consistent view of the marketplace around them. Swiggy data extraction for food delivery market analysis provides a framework for organizing accessible restaurant listings, menu details, prices, ratings, and availability observations into structured information that can be reviewed over time.
The greatest value comes from connecting that information to business objectives. Restaurants should compare like-for-like dishes, distinguish regular prices from promotions, track changes with timestamps, and validate unusual observations before acting. They should also combine marketplace research with internal sales, ingredient costs, customer feedback, and contribution margins to avoid decisions based on incomplete signals.
As India's online food delivery market continues to develop, a repeatable data strategy can help restaurant teams investigate pricing gaps, review menu positioning, and identify opportunities for further testing. Results depend on source availability, authorized access, collection frequency, and data quality, so analytics should guide decisions rather than replace commercial judgment.
Ready to improve your restaurant's competitive visibility? Contact Real Data API to discuss a structured, compliant data collection workflow tailored to your target locations, restaurant categories, and reporting goals!
FAQs
1. How does food delivery market research help restaurants?
Swiggy data extraction for food delivery market analysis helps restaurants compare accessible menu prices, listings, and ratings to investigate competitive positioning and identify potential areas for improvement.
2. What information can be collected from the platform?
Swiggy Food Data Scraping may collect permitted restaurant names, menu items, categories, displayed prices, ratings, and availability indicators, depending on access methods and field availability.
3. Why is restaurant benchmarking important?
Swiggy data scraping for restaurant benchmarking helps businesses compare similar restaurants and dishes, assess listed price differences, and review competitive positioning without relying entirely on manual checks.
4. Can menu information support pricing analysis?
Swiggy restaurant menu data API workflows can organize available menu and price fields for comparison, provided authorized access exposes the relevant information and records are validated.
5. How can a data provider support the process?
Real Data API can help plan a structured workflow using real-time Swiggy menu price monitoring where access and update frequency permit, with validation and timestamped records for analysis.
Latest posts

How Real Estate Data Scraping Help Maximize Investment Opportunities with Real-Time Property Listings and Investment Insights
How Instacart API for grocery availability data Helps Retailers Solve Real-Time Stock Visibility Challenges
Why Swiggy API for real-time food delivery data Matters for Tracking Menus, Offers, Availability, and Competitor Trends
How ecommerce scraping API for real-time product data Helps Businesses Track Prices, Inventory, and Competitor Changes






.png)



