Quick Summary
- Instacart API for grocery availability data can help retailers and brands structure accessible grocery information to monitor product presence, stock signals, and location-level assortment changes.
- An Instacart Grocery Dataset can support historical analysis of grocery assortment, availability, pricing, and competitive positioning.
- Automated collection reduces manual checks and helps teams create repeatable workflows for retail intelligence, assortment planning, and availability monitoring.
Introduction
Instacart API for grocery availability data can help retailers, CPG brands, grocery analysts, and marketplace teams improve visibility into changing product availability. When shoppers encounter unavailable products, businesses may lose sales opportunities and valuable demand signals. A structured data workflow can help teams monitor accessible product information across stores and locations, identify availability gaps, and analyze changes over time.
Grocery availability is inherently dynamic. Products can move from available to unavailable because of demand, replenishment cycles, local inventory conditions, fulfillment capacity, or assortment decisions. Manual monitoring becomes difficult when teams need to track thousands of products across multiple locations.
An Instacart Grocery Dataset can organize collected grocery information into structured records for downstream analytics. Depending on the accessible fields and authorized collection method, records may include product names, brands, categories, prices, availability indicators, store information, package sizes, ratings, and URLs.
For retail decision-makers, the objective is not simply to collect more records. An Instacart Food Dataset can help create a dependable process that turns changing grocery information into actionable intelligence while maintaining data quality, timestamps, geographic context, and appropriate source-access controls.
How can retailers improve availability visibility?
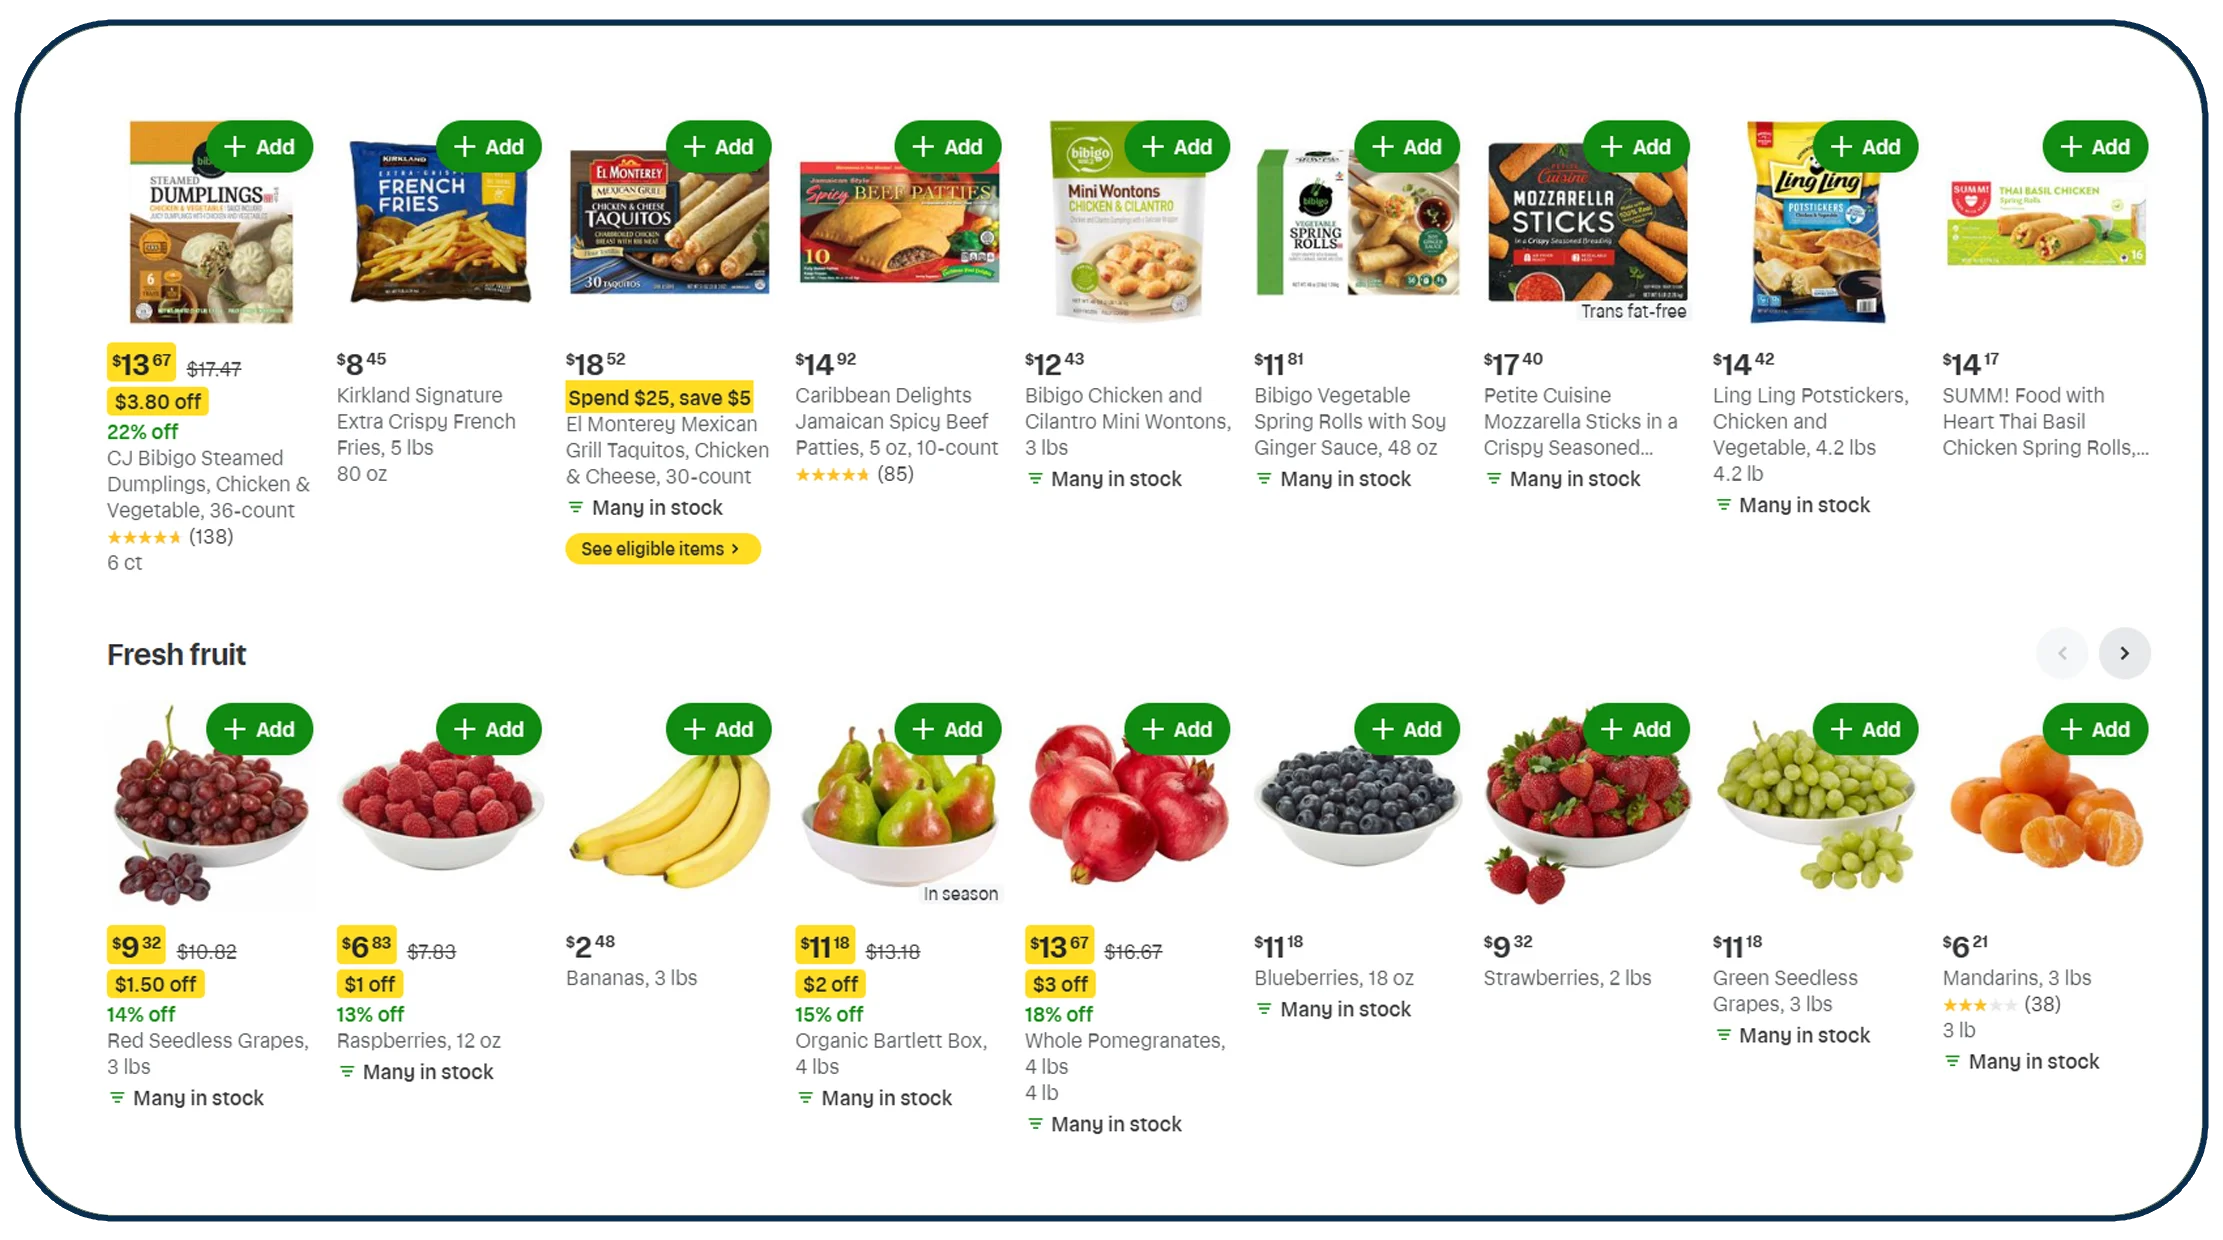
A centralized data workflow gives retail teams a consistent way to observe product availability across locations and time periods. Instead of relying on individual store checks, analysts can establish standardized fields and compare observations against historical records.
An Instacart retail data API can be incorporated into a broader data architecture when the required source information is accessible through an authorized interface. The workflow can normalize product identifiers, store information, categories, package sizes, and availability fields before sending records to a database or analytics environment.
The most important consideration is granularity. A product can be available in one location and unavailable in another. Therefore, availability records should retain location and observation timestamps. Without these dimensions, analysts may incorrectly interpret local stock conditions as a broader market trend.
Which metrics should retailers monitor?
| Metric | What it indicates | Business application |
|---|---|---|
| Availability rate | Share of observed products available | Assortment monitoring |
| Out-of-stock rate | Share unavailable during observation | Stock-gap detection |
| Store coverage | Locations represented in dataset | Geographic analysis |
| Product coverage | Products successfully observed | Dataset completeness |
| Change frequency | How often availability changes | Monitoring prioritization |
These are analytical metrics, not published Instacart performance figures.
What does grocery e-commerce data show?
The U.S. Census Bureau reported that e-commerce accounted for 16.1% of total U.S. retail sales in 2024, up from 14.5% in 2020. The figures demonstrate the continued importance of digital retail channels, although they cover total retail e-commerce rather than grocery alone. U.S. Census Bureau — Quarterly Retail E-Commerce Sales
| Year | U.S. e-commerce share of retail sales |
|---|---|
| 2020 | 14.5% |
| 2021 | 14.7% |
| 2022 | 14.6% |
| 2023 | 15.0% |
| 2024 | 16.1% |
Source: U.S. Census Bureau. Census E-Commerce Data
From 2020 through 2026, retailers have increasingly needed digital visibility as online purchasing became a larger part of consumer behavior. The 2025–2026 period should be assessed using the latest published Census releases rather than extrapolating historical percentages.
The practical takeaway is straightforward: availability monitoring should be location-aware, time-stamped, and built around measurable data-quality rules.
How does automated product discovery reduce manual work?
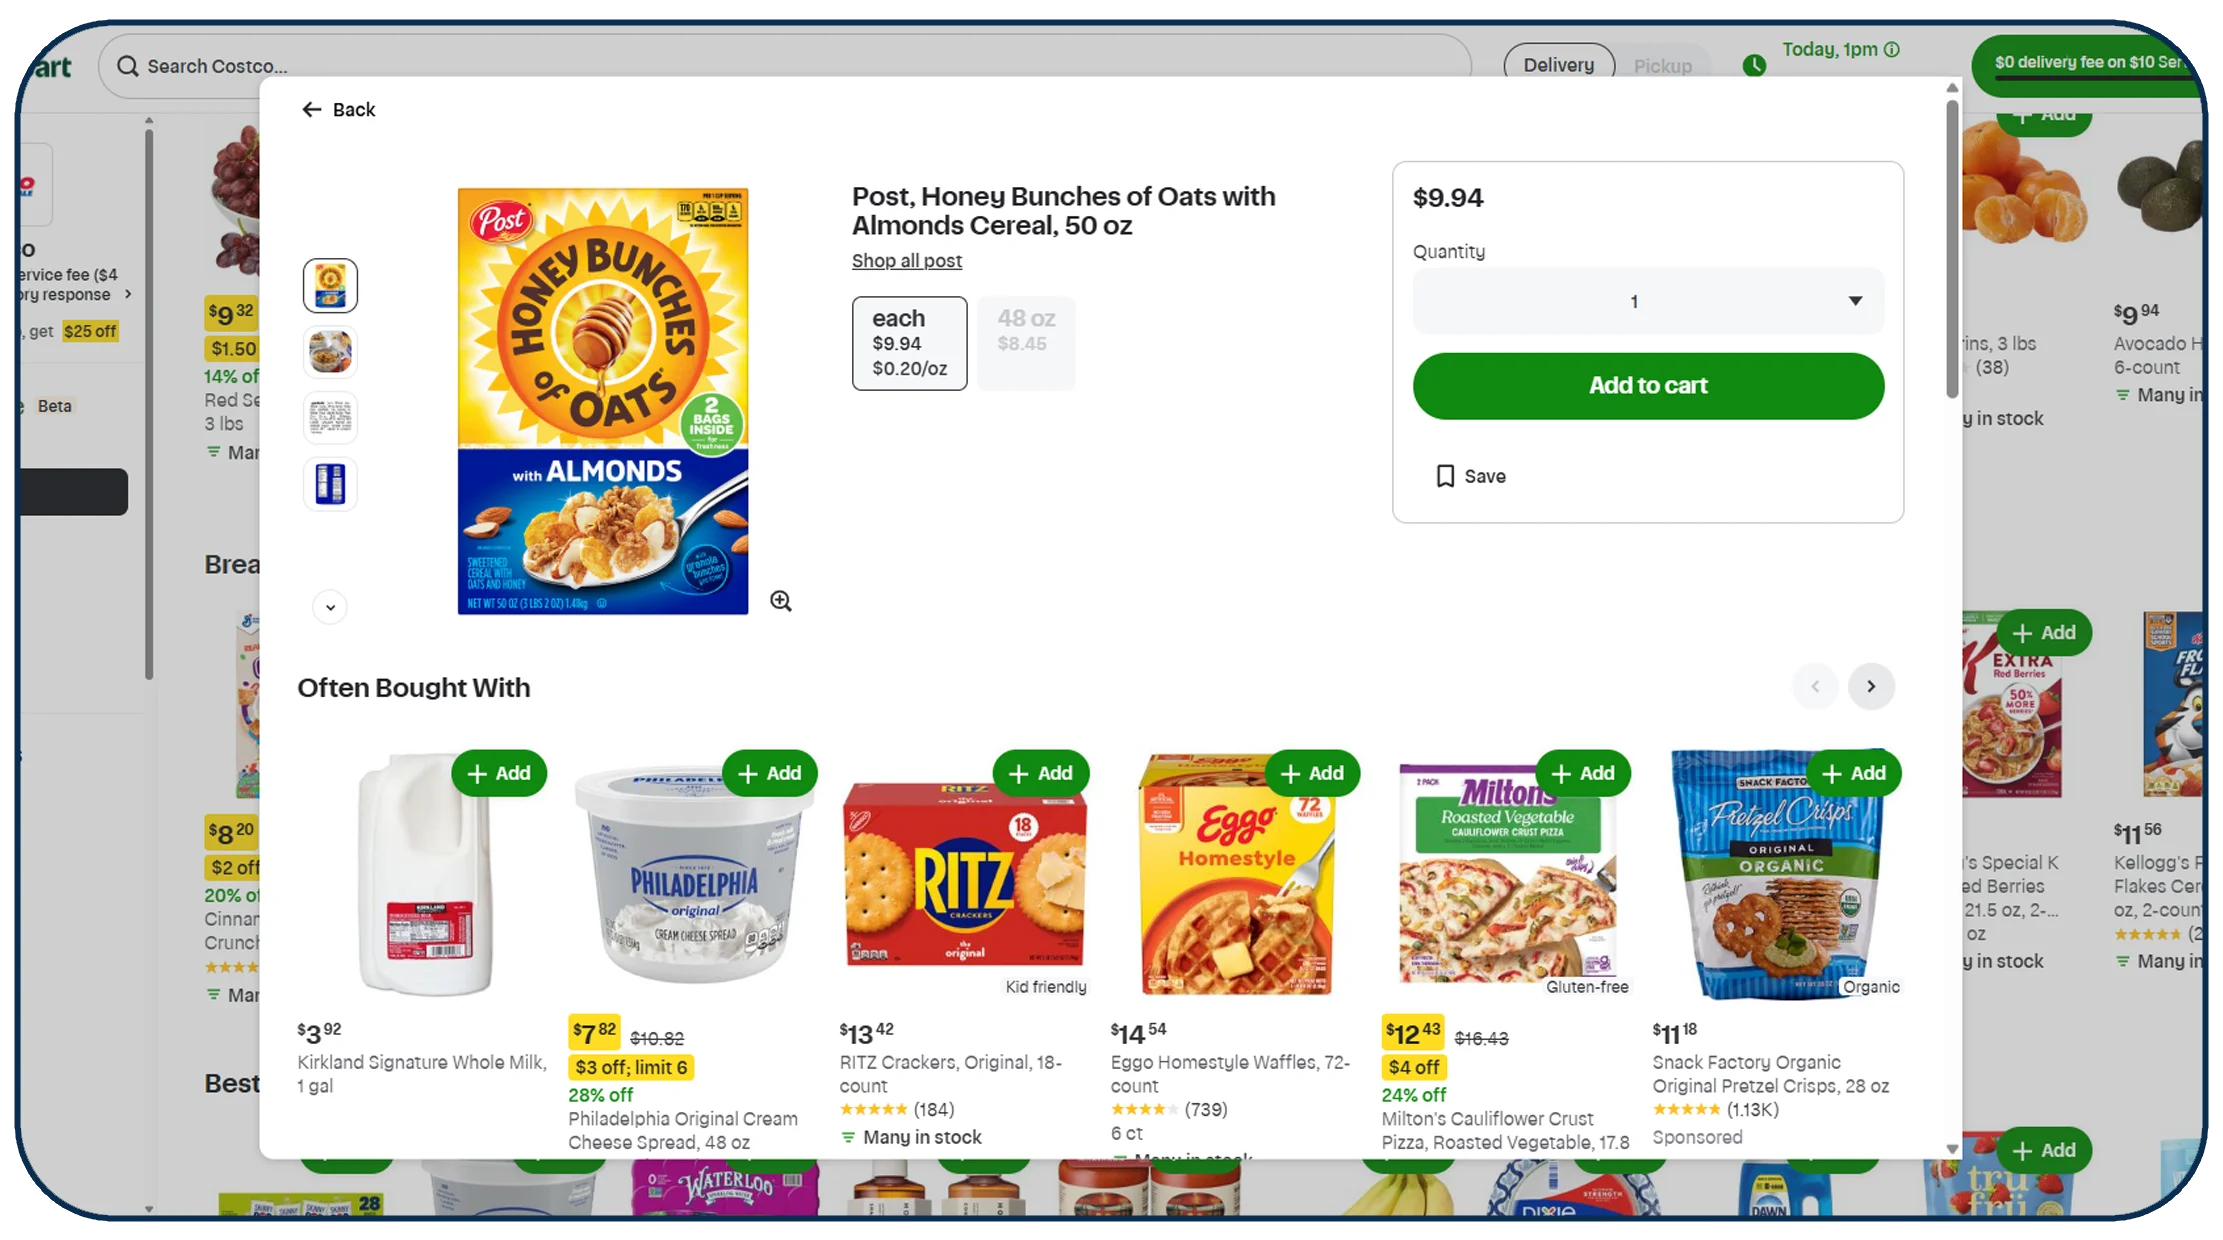
Retail teams often need to monitor thousands of products while accounting for different brands, package sizes, categories, and store locations. Manual searches can provide useful spot checks, but they are difficult to scale and reproduce consistently.
An Instacart product web scraper can be designed as part of an authorized collection workflow to gather accessible product information and convert it into standardized records. A production workflow should include request management, validation, deduplication, error handling, and timestamping rather than simply extracting page content.
Product matching is especially important. A retailer may sell several variations of the same item—for example, different package sizes or flavors. Treating every variation as the same product can distort availability and pricing analysis.
What fields should a product monitoring schema include?
| Field | Purpose |
|---|---|
| Product ID | Supports consistent identification |
| Product name | Enables search and categorization |
| Brand | Supports brand-level analysis |
| Category | Enables assortment comparisons |
| Package size | Distinguishes product variants |
| Store/location | Adds geographic context |
| Availability | Supports stock visibility |
| Observation timestamp | Establishes data freshness |
| Product URL | Provides source traceability |
The fields above represent a recommended schema rather than a guaranteed set of fields available from every source.
How should retailers approach 2020–2026 data evolution?
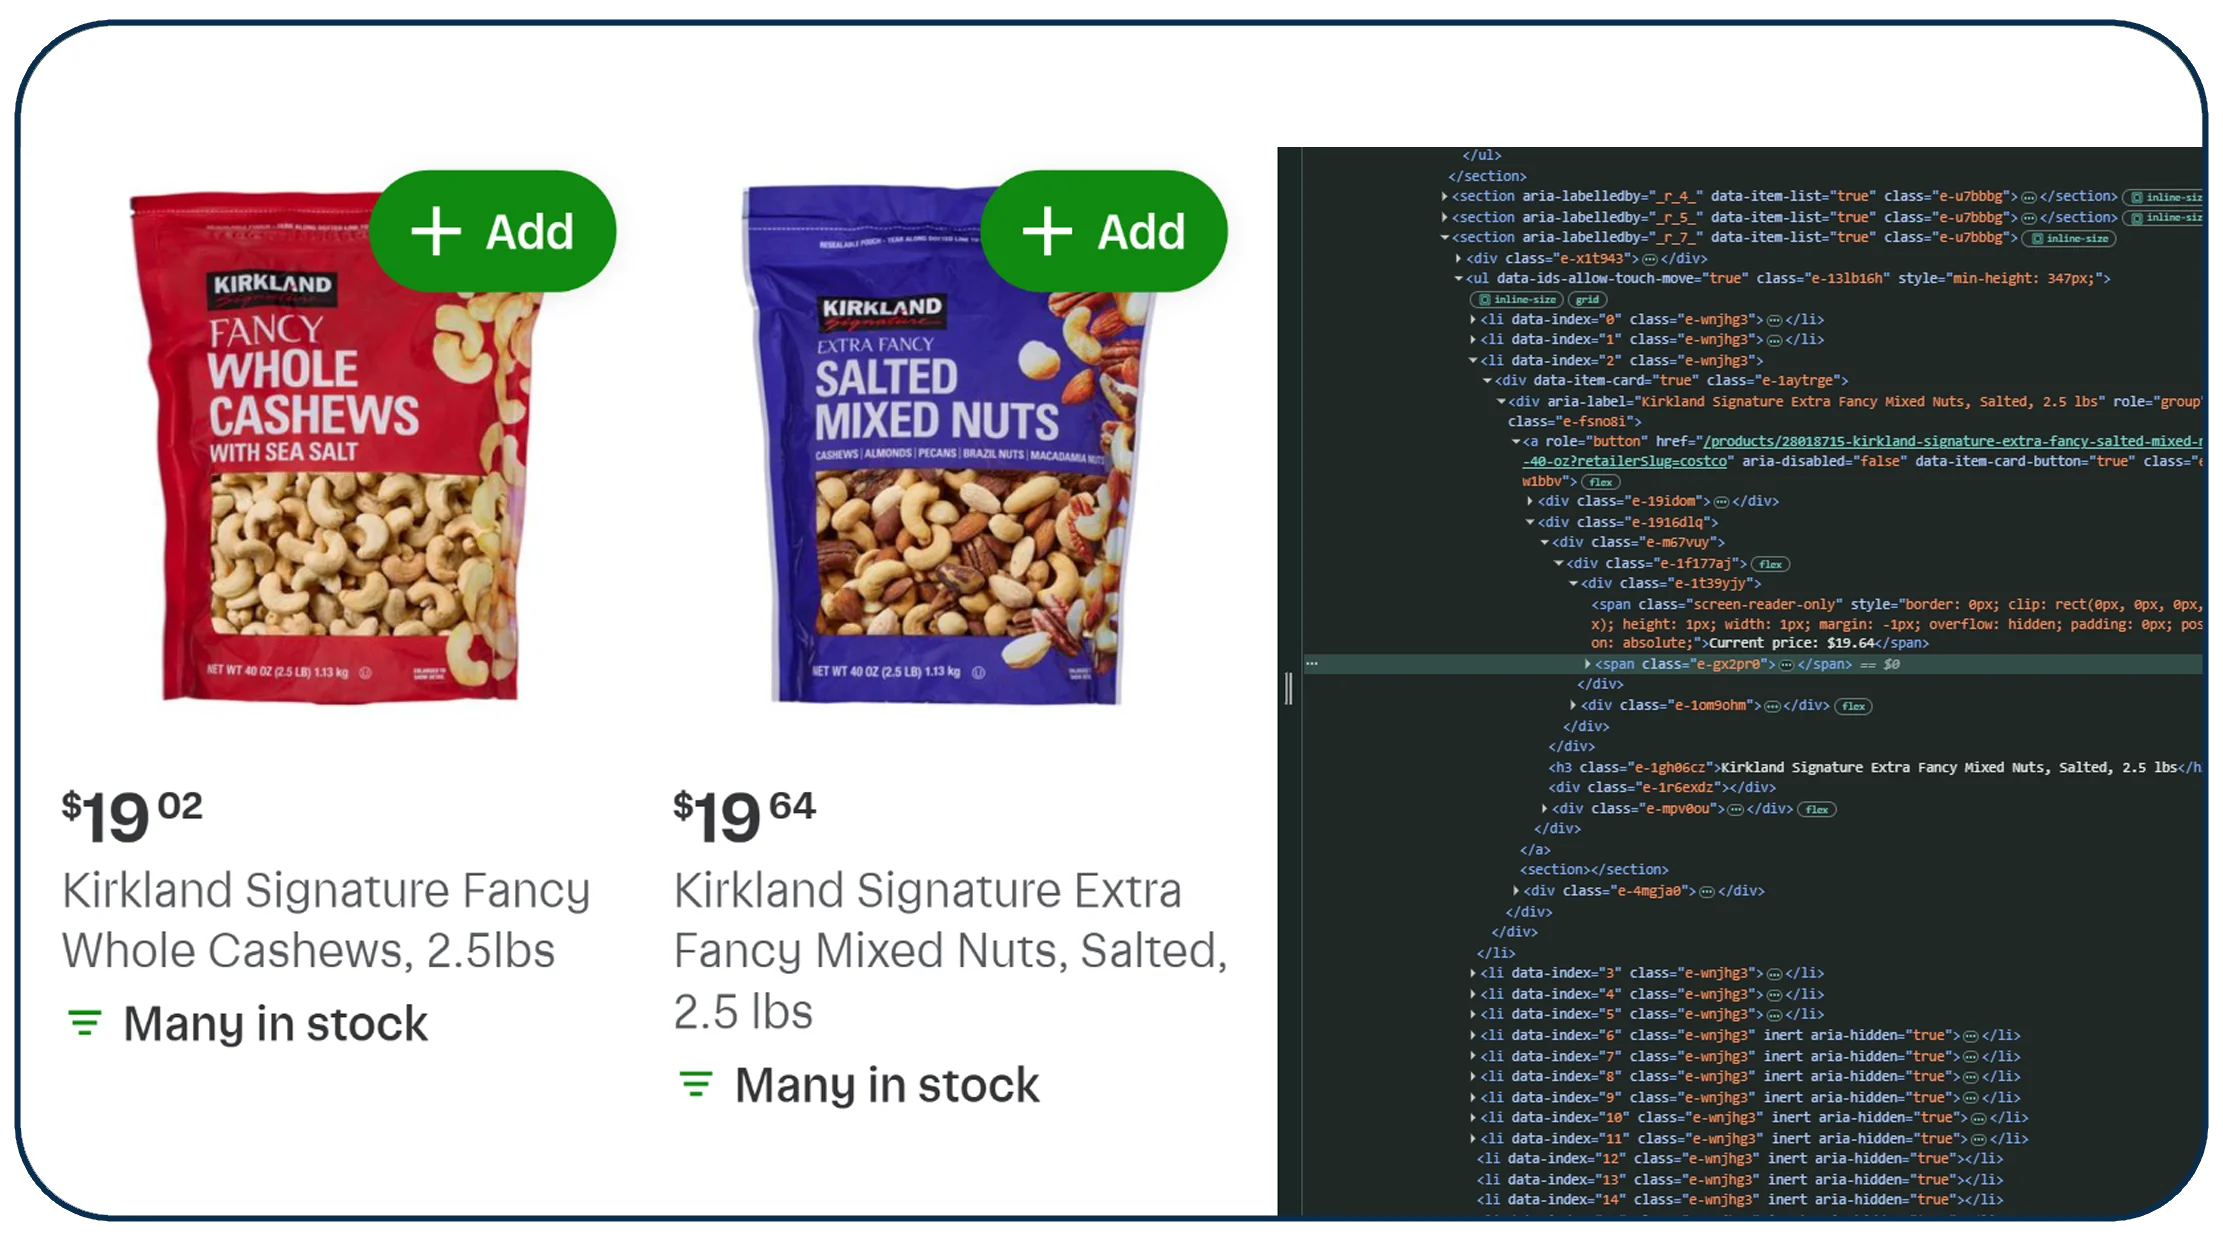
In 2020, many teams relied heavily on spreadsheets and manual observations for smaller monitoring programs. As digital commerce expanded, automated collection, centralized storage, and dashboard-based analysis became more practical for larger datasets. By 2026, mature retail intelligence programs can combine automated ingestion with validation, historical snapshots, and alerting.
However, automation should not be confused with accuracy. A scraper that produces thousands of records with incorrect product matches is less valuable than a smaller dataset with reliable identifiers and clear timestamps.
For buyers evaluating a solution, the right questions include: How frequently can records be refreshed? Which fields can be accessed? How are duplicate products handled? How are failed observations reported? How is historical data retained?
These questions help distinguish a sustainable retail data workflow from a basic extraction script.
How can catalog-level monitoring reveal assortment gaps?
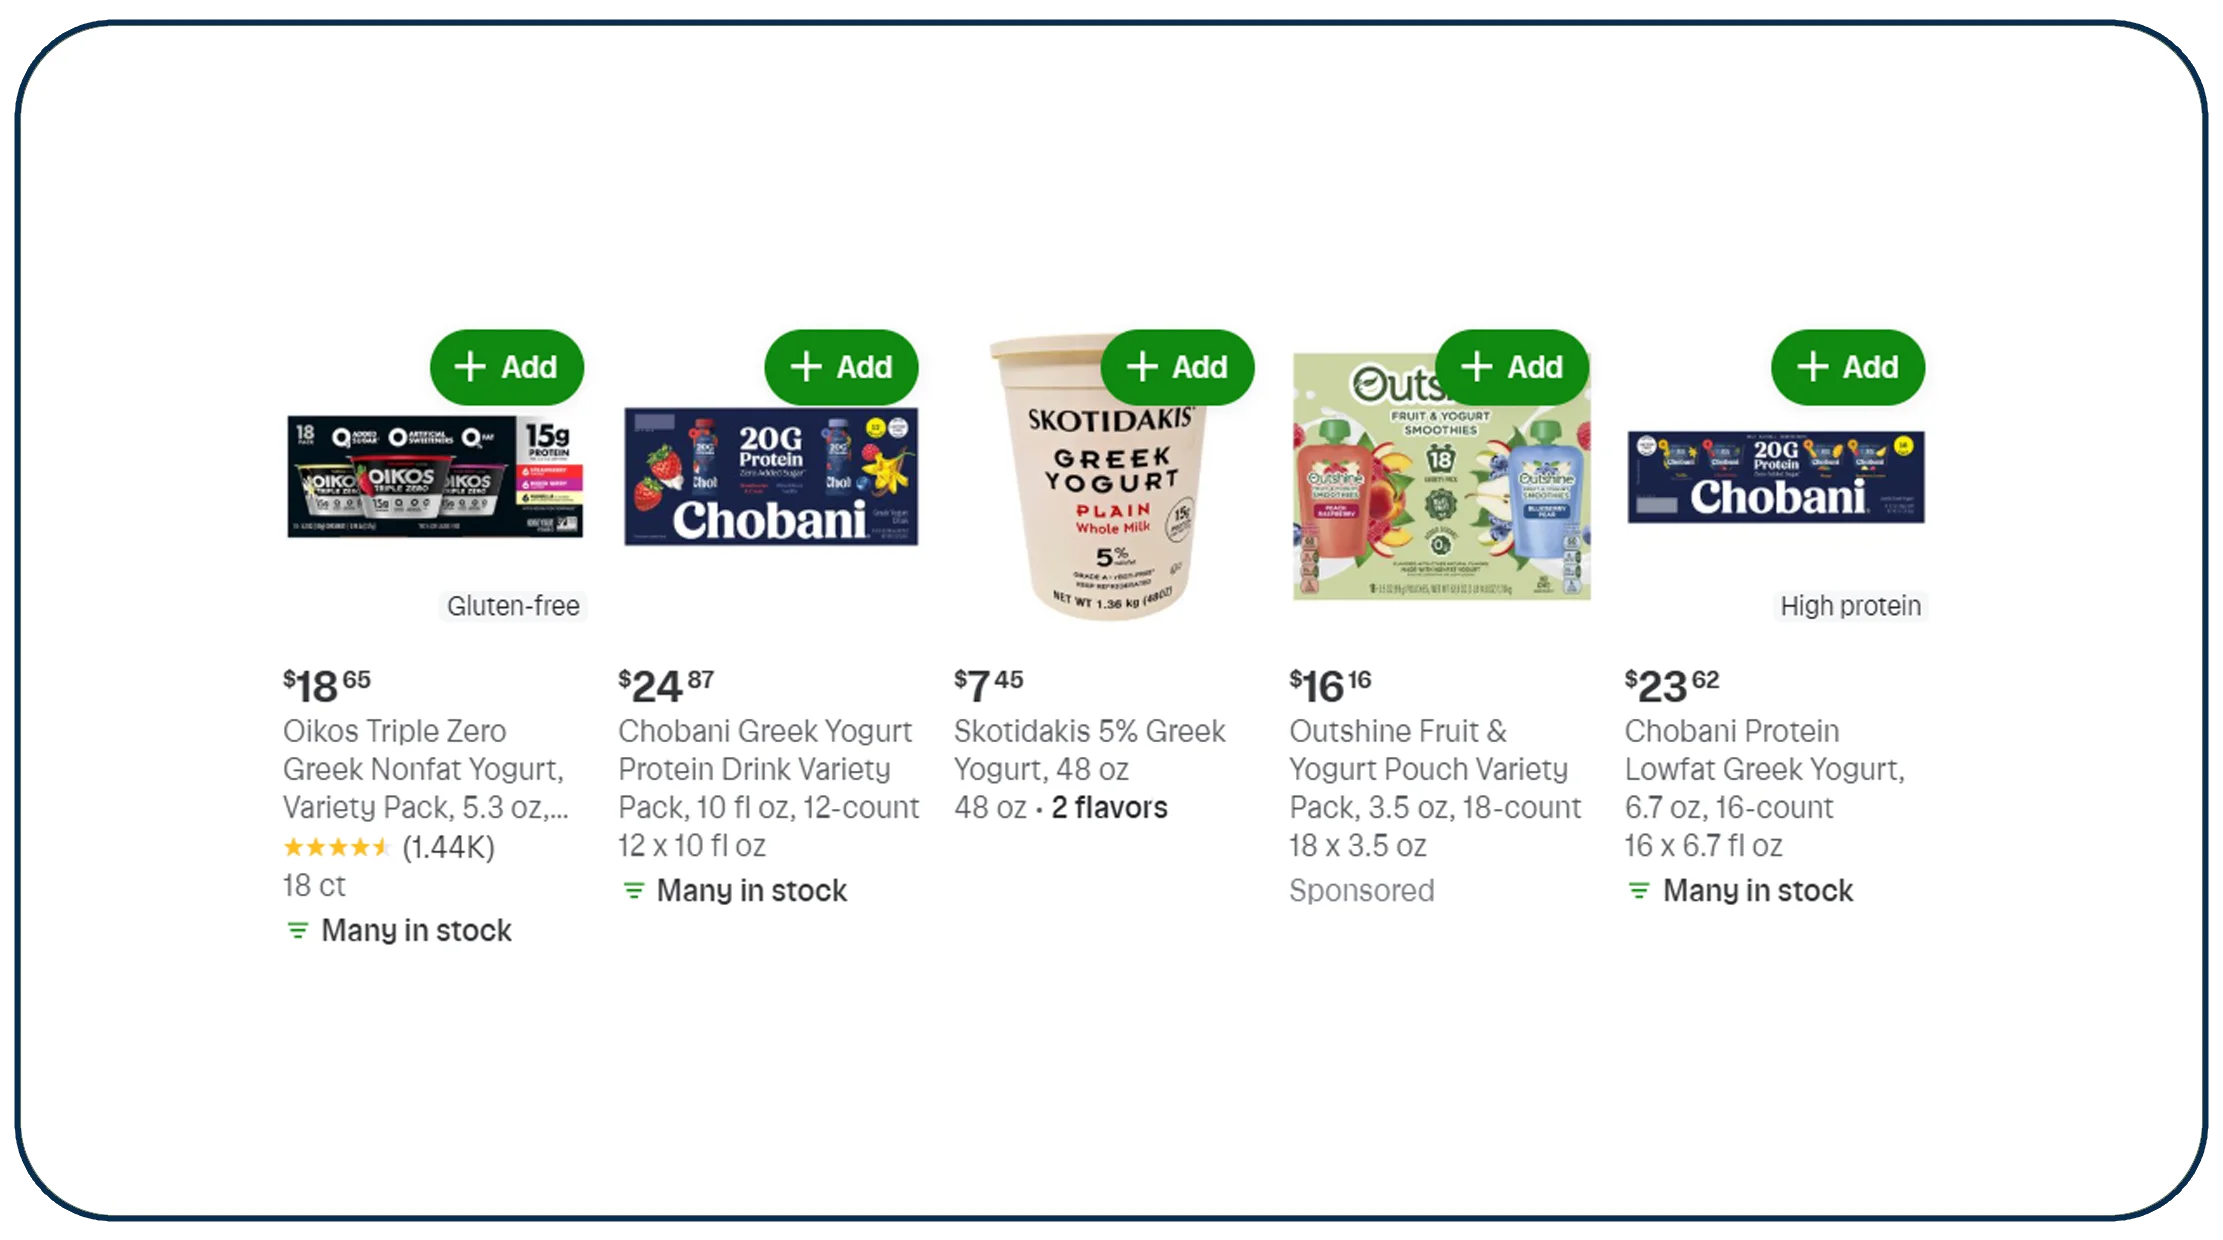
Retailers need more than stock information. They also need visibility into which products are represented, how assortment varies by location, and how product categories evolve. Catalog-level monitoring helps businesses identify changes that may otherwise remain hidden.
A workflow designed to scrape Instacart grocery catalog data can organize accessible product listings into a structured catalog for analysis. Teams can then group products by category, brand, package size, store, or geographic area.
For example, a CPG manufacturer can compare the observed presence of its products across selected locations. If one region consistently shows lower product coverage, the business can investigate distribution, assortment, or availability issues. Such analysis does not automatically establish the cause; it identifies where further investigation is warranted.
Which catalog metrics provide the strongest signals?
| Metric | Example analytical question |
|---|---|
| SKU coverage | How many products are visible? |
| Brand presence | Where does a brand appear? |
| Category depth | Which categories have the widest assortment? |
| Assortment change | Which products were added or removed? |
| Location variance | How different are local catalogs? |
Retail analysts can create a daily, weekly, or monthly snapshot depending on the business problem. High-frequency monitoring is appropriate only where the data source and permitted access support it.
Why does location matter?
Grocery assortment is highly local. A product unavailable in one ZIP code does not necessarily indicate a national stock problem. Location-aware records allow analysts to separate localized availability issues from broader patterns.
From 2020 to 2026, the growth of omnichannel retail has made this distinction increasingly valuable. Consumers can browse products digitally while fulfillment depends on local inventory and operational conditions. Consequently, a national average can hide significant regional differences.
A useful catalog system should therefore preserve location, timestamp, product identity, and source context. Historical snapshots can then answer questions such as:
- Which products disappeared from a location?
- Which brands gained or lost assortment presence?
- Which categories experienced the largest changes?
- Are changes temporary or recurring?
This approach turns catalog monitoring into a structured research process rather than a series of isolated searches.
Want to build a scalable grocery intelligence workflow? Talk to Real Data API about structured product, availability, and location-level data solutions.
How can pricing and availability analysis work together?
Availability and pricing should often be analyzed together because a product's market position cannot be fully understood from either variable alone. A product may remain listed but become unavailable, while another product may stay available but undergo significant price changes.
A workflow that can extract Instacart product pricing data allows analysts to compare observed prices alongside availability, product attributes, store information, and timestamps. This creates a stronger basis for understanding retail movements.
For example, a brand analyst could compare the observed price of a 12-ounce product with its availability across several locations. If price changes repeatedly coincide with availability changes, the pattern can be flagged for investigation. It should not automatically be interpreted as a causal relationship.
Which pricing indicators are useful?
| Indicator | Calculation | Business use |
|---|---|---|
| Observed price | Listed price at observation | Price tracking |
| Price change | Current minus previous price | Change detection |
| Percentage change | Price change ÷ previous price | Normalized comparison |
| Price range | Highest minus lowest observed price | Location comparison |
| Availability-price relationship | Compare both time series | Retail analysis |
Actual prices should always be retained with observation timestamps and location identifiers. This avoids mixing observations from different periods or stores.
What changed between 2020 and 2026?
The pandemic accelerated digital grocery adoption, while later years brought continued development of omnichannel retail and retail media. Businesses consequently gained greater interest in combining product, pricing, promotion, and availability signals.
The U.S. Census Bureau's annual e-commerce estimates show that the share of retail sales occurring online increased from 14.5% in 2020 to 16.1% in 2024. U.S. Census Bureau e-commerce statistics
That trend does not mean every grocery purchase moved online. Instead, it highlights why digital shelf information can complement traditional retail data.
For analysts, the practical lesson is to avoid isolated price tables. Pair price observations with product identity, package size, location, and availability status. This enables more meaningful comparisons and reduces the risk of drawing conclusions from mismatched records.
A strong pricing dataset should also preserve historical observations rather than overwriting previous values. Historical records enable analysts to identify recurring changes and evaluate whether an observed movement is temporary or persistent.
What should businesses consider when building an API workflow?
An API-based architecture can connect grocery data collection with existing databases, dashboards, data warehouses, and analytics applications. The advantage is not merely faster collection. A properly designed workflow can also standardize processing and make data easier to validate.
An Instacart API integration should begin by identifying which information is legitimately accessible and which technical mechanisms are permitted. Businesses should not assume that every piece of information visible on a consumer-facing platform is available through an API.
What should the architecture contain?
| Layer | Function | Key consideration |
|---|---|---|
| Source access | Retrieves permitted information | Authentication and access rules |
| Ingestion | Processes incoming records | Reliability and error handling |
| Transformation | Standardizes fields | Consistent schema |
| Validation | Checks record quality | Missing and duplicate detection |
| Storage | Maintains historical records | Timestamps and identifiers |
| Analytics | Supports reporting | Defined business metrics |
| Monitoring | Tracks system health | Alerts and operational visibility |
A retail analytics team should establish acceptance criteria before implementation. These can include required-field completeness, duplicate thresholds, acceptable refresh intervals, and data-delivery formats.
Which KPIs should technical teams track?
Useful technical indicators include successful processing rate, average processing time, record completeness, duplicate frequency, failed-request rate, and time from observation to dashboard availability.
The exact targets should be established from a baseline. For example, a team could measure current manual processing time for 10,000 records and compare it with an automated workflow. That produces a defensible efficiency measurement instead of relying on generic claims.
From 2020 through 2026, data infrastructure has increasingly moved toward automated pipelines, cloud storage, event-driven processing, and integrated analytics. Yet the fundamentals remain unchanged: accurate identifiers, clear source attribution, validation, monitoring, and documented transformations.
Businesses should also establish governance procedures. Data access permissions, retention policies, privacy requirements, and platform terms should be reviewed before production deployment. Responsible data engineering protects the business while improving long-term reliability.
How can recurring monitoring turn grocery data into intelligence?
A recurring monitoring program transforms individual observations into a historical dataset. This history enables businesses to identify trends, recurring stock gaps, assortment changes, and location-specific patterns.
An Instacart Scraper can be one component of such a system when its collection method is authorized and aligned with applicable platform requirements. The scraper should feed a broader pipeline rather than operate as an isolated script.
A useful recurring workflow follows this sequence:
- Define products, stores, locations, and categories.
- Collect permitted information according to the agreed schedule.
- Normalize product names and identifiers.
- Validate prices, availability, and location fields.
- Compare current observations with previous snapshots.
- Flag meaningful changes.
- Store historical records.
- Deliver insights through dashboards or reports.
Which monitoring metrics matter?
| KPI | Purpose |
|---|---|
| Availability percentage | Measures observed product presence |
| OOS frequency | Identifies recurring gaps |
| Product coverage | Measures monitoring completeness |
| Price-change frequency | Detects pricing movement |
| Catalog turnover | Identifies additions/removals |
| Data freshness | Measures time since last observation |
These are recommended intelligence metrics rather than reported Instacart statistics.
How can businesses use 2020–2026 history?
A historical dataset can help organizations compare different periods and detect recurring patterns. For example, an FMCG company might compare product availability during holiday periods across several years. A retailer could examine whether certain categories show recurring availability gaps in specific locations.
Historical data also supports retrospective analysis. When a business sees a sudden change in sales, analysts can investigate whether product availability, assortment, or observed pricing changed around the same period.
The strongest workflows combine historical records with business context. Availability data alone cannot explain why a product became unavailable. It can, however, identify the timing, location, product, and persistence of the observed condition.
By 2026, the competitive advantage comes less from simply having data and more from converting repeat observations into usable intelligence. Retail teams can prioritize exceptions, automate alerts, and focus human attention on the issues most likely to affect assortment and customer experience.
Why Choose Real Data API?
Real Data API can support businesses that need structured web data workflows for retail research, product intelligence, pricing analysis, and availability monitoring. The right implementation should be based on the client's source-access requirements, target fields, geographic scope, refresh frequency, and downstream systems.
Key considerations include:
- Scalability: Build workflows that can grow from pilot datasets to larger product and location coverage.
- Structured data: Deliver consistent fields that can be integrated with databases and analytics systems.
- Data validation: Detect missing values, duplicates, malformed records, and unexpected changes.
- Historical tracking: Preserve observations so teams can analyze trends instead of relying on one-time snapshots.
- Integration: Connect datasets with dashboards, warehouses, APIs, and internal applications.
- Monitoring: Establish visibility into collection failures, freshness, and data-quality issues.
- Responsible access: Ensure collection methods align with applicable laws, platform terms, permissions, privacy obligations, and business policies.
A strong grocery intelligence project should begin with a clearly defined schema and measurable KPIs. This allows stakeholders to evaluate data quality before scaling the workflow.
Conclusion
Retailers cannot make reliable availability decisions from static or incomplete product information. They need structured observations that connect products, locations, availability, pricing, and timestamps.
An effective Instacart API for grocery availability data strategy can help businesses organize accessible grocery information into repeatable workflows for stock visibility, assortment analysis, pricing research, and competitive intelligence. The value comes from combining accurate data collection with normalization, validation, historical tracking, and actionable reporting.
The broader growth of e-commerce reinforces the need for digital retail visibility. U.S. e-commerce represented 16.1% of total retail sales in 2024, compared with 14.5% in 2020, according to the U.S. Census Bureau. U.S. Census Bureau Retail E-Commerce Data
For retailers and CPG brands, the next step is to identify the products, locations, fields, and refresh frequency that matter most. A focused pilot can establish data quality and business value before expanding coverage.
Ready to improve grocery availability and retail intelligence? Contact Real Data API to build a scalable data workflow tailored to your product, pricing, location, and monitoring requirements!
FAQs
1. What is grocery availability data?
Grocery availability data shows whether products are observed as available across selected locations and time periods, helping retailers identify stock gaps, assortment changes, and local availability patterns.
2. How can retailers use an Instacart Grocery Dataset?
An Instacart Grocery Dataset can support assortment analysis, availability monitoring, product research, location comparisons, pricing analysis, and historical reporting when the underlying data is lawfully obtained and properly documented.
3. Can businesses automate grocery product monitoring?
Yes. An authorized workflow can use an Instacart retail data API approach to collect accessible product records, validate fields, maintain timestamps, and deliver structured information to analytics systems.
4. Can availability and pricing be analyzed together?
Yes. Combining availability with extract Instacart product pricing data workflows can help analysts study observed price changes alongside product presence, locations, package sizes, and historical snapshots.
5. What should businesses consider before implementing a solution?
Before choosing Real Data API, businesses should evaluate access permissions, source limitations, required fields, refresh schedules, data quality, integration requirements, privacy considerations, and applicable platform terms.
Latest posts

How Real Estate Data Scraping Help Maximize Investment Opportunities with Real-Time Property Listings and Investment Insights
How Instacart API for grocery availability data Helps Retailers Solve Real-Time Stock Visibility Challenges
Why Swiggy API for real-time food delivery data Matters for Tracking Menus, Offers, Availability, and Competitor Trends

How ecommerce scraping API for real-time product data Helps Businesses Track Prices, Inventory, and Competitor Changes







.png)



