
Quick Summary
- Wildberries Product Scraper helps brands, retailers, sellers, and market researchers monitor marketplace listings, pricing movements, seller activity, and availability in a structured format for competitive analysis.
- Wildberries Product Data Scraping enables recurring collection of product attributes and marketplace signals, helping teams reduce manual monitoring and build historical datasets for pricing, assortment, and availability analysis.
Introduction
Wildberries Product Scraper helps e-commerce teams solve a practical marketplace problem: product prices, sellers, assortment, and availability can change frequently, making manual tracking slow and inconsistent. Automated collection creates structured observations that businesses can compare across products, categories, sellers, and time periods.
For brands competing on large marketplaces, Wildberries Product Data Scraping can organize product-level information into repeatable datasets. Instead of relying on occasional screenshots or manual spreadsheets, teams can establish scheduled collection workflows and use historical records to identify price changes, assortment gaps, seller movements, and availability patterns.
This matters because Wildberries has expanded substantially over the past several years. Its reported marketplace turnover increased from ₽437.2 billion in 2020 to ₽844 billion in 2021, while 2022 turnover reached ₽1.67 trillion. (Interfax.ru)
For pricing managers, marketplace analysts, category teams, and D2C brands, the objective is not simply to collect more records. The objective is to create reliable, comparable observations that answer questions such as:
- Which products changed price?
- Which sellers entered or disappeared?
- Which products became unavailable?
- Which categories are expanding?
- How frequently do competitors change offers?
- Which marketplace signals require immediate action?
How Can Businesses Build Reliable Price Monitoring?
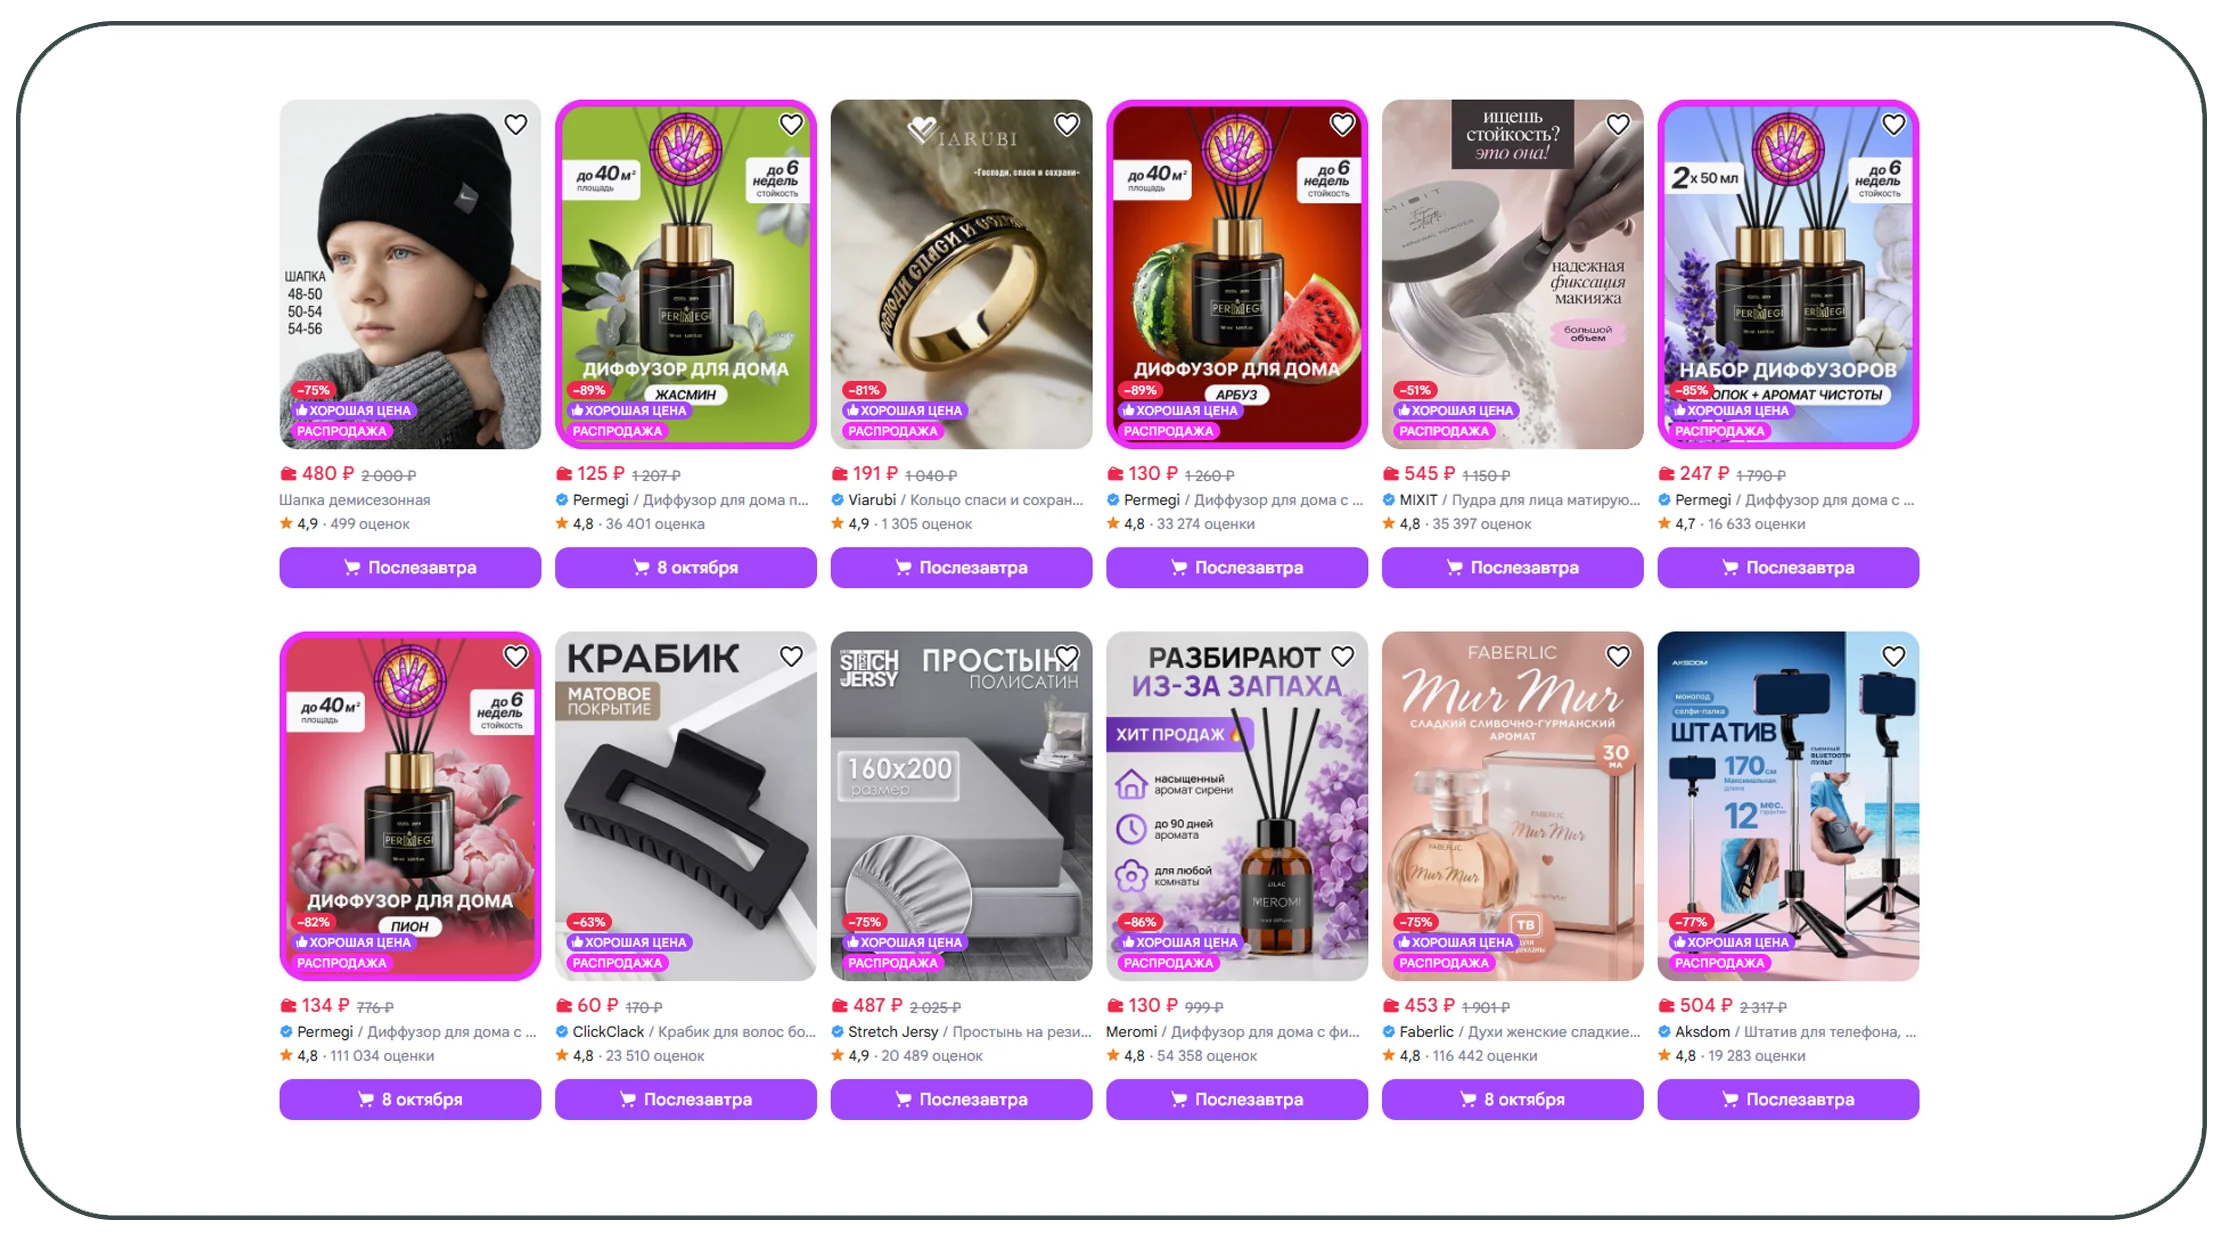
Wildberries price web data scraper workflows can capture product prices, promotional prices, discounts, product identifiers, seller information, and timestamps at scheduled intervals. Wildberries Product Scraper processes can then turn those observations into historical price records rather than isolated snapshots.
Price monitoring becomes particularly useful when businesses compare the same SKU over multiple dates. A simple dataset can identify the original price, current selling price, percentage discount, and frequency of price changes. This helps pricing teams distinguish temporary promotions from persistent price reductions.
Wildberries' scale illustrates why automated monitoring matters. Marketplace turnover reached ₽437.2 billion in 2020 and ₽844 billion in 2021. In 2022, reported turnover reached ₽1.67 trillion, while orders increased to 1.5 billion. (Interfax.ru)
| Year | Reported turnover / GMV | Other reported indicator |
|---|---|---|
| 2020 | ₽437.2B | 323.8M orders |
| 2021 | ₽844B | 808.6M orders |
| 2022 | ₽1.67T | 1.5B orders |
| 2023 | ₽2.5T | 60% lower than 2024 |
| 2024 | >₽4.1T | Seller income ₽2.9T |
| 2025 | >₽6.1T* | RWB group GMV |
| 2026 | Current year | Monitoring remains ongoing |
*2025 figure is for the broader RWB group across Russia and other countries and is based on unaudited IFRS data. (Telegram)
From 2020 through 2026, the analytical requirement has therefore shifted from occasional price checks toward continuous observation. In 2024, the combined RWB business reported more than ₽4.1 trillion in turnover, while seller income reached ₽2.9 trillion. (Telegram) By 2025, reported group GMV exceeded ₽6.1 trillion, with more than ₽310 billion invested in logistics, IT infrastructure, and new initiatives. (Коммерсантъ)
Actionable insight: Store every observation with a timestamp. A price without a collection date cannot reliably explain whether a competitor changed its price today, last week, or during a temporary promotion.
What Seller Signals Should Marketplace Teams Monitor?
Wildberries seller data collection services can help marketplace intelligence teams organize seller names, seller identifiers where available, product associations, ratings, listing counts, prices, and availability signals. This creates a seller-level view alongside the product-level dataset.
Seller monitoring is important because two identical products may appear under different sellers with different prices, discounts, ratings, and availability. Looking only at product-level information can therefore hide meaningful marketplace differences.
The expansion of the marketplace makes seller-level analysis increasingly relevant. Wildberries reportedly had about 91,000 sellers in 2020, compared with 19,000 previously, while its turnover reached ₽437.2 billion. (CNews.ru) By 2024, the platform reported seller income of ₽2.9 trillion, up 44% year over year. (Telegram)
| Signal | Business question | Recommended frequency |
|---|---|---|
| Seller name | Who offers the product? | Daily |
| Seller rating | Is seller perception changing? | Daily/weekly |
| Product count | Is assortment expanding? | Weekly |
| Listed price | How competitive is the offer? | Daily |
| Discount | Is promotion intensity changing? | Daily |
| Availability | Can customers purchase now? | Multiple times daily |
| Seller-product relationship | Who competes on the same SKU? | Daily |
From 2020 to 2026, seller analysis has increasingly moved beyond identifying the cheapest offer. Teams can combine seller, product, price, and availability observations to identify recurring competitive patterns.
Wildberries' own seller analytics environment illustrates the importance of structured marketplace metrics. Its current seller tools include sales funnels, stock analytics, search analytics, seller reports, regional sales, brand share, returns, and inventory-related reporting. (Wildberries)
Actionable insight: Build a seller-product relationship table. It allows analysts to identify when a seller disappears, enters a product category, changes pricing, or becomes unavailable without confusing the event with a product-level change.
How Can Teams Extract Marketplace Signals at Scale?

To extract Wildberries marketplace data, businesses should define a consistent schema before starting collection. A useful structure separates product attributes, commercial attributes, seller attributes, availability signals, and collection metadata.
This approach is more valuable than simply collecting large volumes of unstructured HTML. A normalized dataset makes it possible to compare observations over time and across categories.
| Data group | Example fields | Business use |
|---|---|---|
| Product | Name, SKU, category, brand | Assortment analysis |
| Pricing | Current price, old price, discount | Price benchmarking |
| Seller | Seller name, rating, offer | Seller intelligence |
| Availability | In stock, unavailable, quantity signal | Stock monitoring |
| Reviews | Rating, review count | Customer perception |
| Listing | URL, collection timestamp | Historical tracking |
| Category | Category path, subcategory | Category intelligence |
The historical context is significant. In 2020, Wildberries recorded 323.8 million orders; in 2021, the figure rose to 808.6 million; and in 2022, it reached 1.5 billion. (Interfax.ru) In 2023, Wildberries' reported turnover reached approximately ₽2.5 trillion, while the 2024 RWB result exceeded ₽4.1 trillion. (Telegram)
The 2025 figure exceeded ₽6.1 trillion for the broader RWB group, according to unaudited financial data. (Telegram) In 2026, marketplace intelligence can therefore benefit from increasingly granular datasets rather than relying exclusively on annual marketplace statistics.
Actionable insight: Use a stable product key whenever possible. Combining product identifiers with seller and timestamp fields prevents historical records from becoming disconnected when prices or availability change.
Turn marketplace data into actionable intelligence with structured collection and scalable delivery!
Get Insights Now!How Can Businesses Maintain Accurate Catalog Visibility?
scrape Wildberries product catalog data workflows can help brands maintain a structured view of product names, categories, brands, identifiers, prices, discounts, ratings, reviews, seller information, and availability.
Catalog visibility becomes difficult when assortment changes faster than internal teams can update spreadsheets. Products may be added, removed, repriced, temporarily unavailable, or repositioned into different categories. Historical snapshots allow analysts to detect those changes systematically.
The marketplace's scale provides a clear reason to automate. Wildberries reported 1.9 billion products purchased in 2022, up 81% from 2021. (Interfax.ru) In 2024, RWB reported more than 20 million orders per day, over one million sellers, more than 58,000 pickup points, and more than 75 million monthly mobile-app users. (FinMarket)
| Metric | What it reveals |
|---|---|
| New listings | Assortment expansion |
| Removed listings | Product discontinuation |
| Price history | Competitive movement |
| Discount history | Promotion intensity |
| Availability history | Stock consistency |
| Category movement | Assortment positioning |
| Seller changes | Competitive entry/exit |
| Rating changes | Customer response |
From 2020 to 2026, catalog monitoring has evolved from basic product discovery into a longitudinal intelligence process. In 2025, RWB reported that its logistics network reached 5.2 million square meters and that investments exceeded ₽310 billion. (Коммерсантъ) Such infrastructure growth can support a broader assortment and higher transaction volume, increasing the importance of automated catalog observation.
Actionable insight: Maintain daily or intraday snapshots for high-priority SKUs and less frequent snapshots for stable long-tail products. This balances data freshness with processing cost.
What Can Continuous Marketplace Monitoring Reveal?
A Wildberries Scraper can support recurring marketplace observation across products, prices, sellers, ratings, reviews, and availability. The key advantage is continuity: businesses can compare the marketplace at different points instead of relying on one-time research.
For example, a brand can create a weekly category dashboard showing median competitor price, number of active sellers, percentage of unavailable listings, discount frequency, and rating distribution. A pricing team can then investigate products that move outside predefined thresholds.
| KPI | Baseline | Current | Possible interpretation |
|---|---|---|---|
| Median competitor price | ₽2,499 | ₽2,299 | Market price reduction |
| Active sellers | 18 | 24 | Increased competition |
| Discounted listings | 31% | 47% | Higher promotion intensity |
| Available products | 94% | 86% | Potential availability issue |
| Average rating | 4.5 | 4.4 | Customer sentiment movement |
The 2020–2026 period demonstrates why historical context matters. Wildberries' reported turnover grew from ₽437.2 billion in 2020 to ₽1.67 trillion in 2022, ₽2.5 trillion in 2023, and more than ₽4.1 trillion in 2024. (Interfax.ru) The broader RWB group then reported more than ₽6.1 trillion in 2025. (Telegram)
In 2026, businesses can use these historical observations as benchmarks rather than treating every marketplace change as an isolated event.
Actionable insight: Create event flags for meaningful changes such as price drops above a chosen threshold, seller-entry events, stock-outs, new product launches, and sudden rating changes. This turns raw collection into an operational alert system.
How Do E-Commerce Datasets Improve Marketplace Decisions?
E-Commerce Datasets can consolidate marketplace observations into reusable analytical assets covering products, sellers, pricing, availability, reviews, and categories. When combined with Wildberries Product Scraper workflows, these datasets can support dashboards, competitor research, pricing models, assortment planning, and market intelligence.
The biggest benefit is historical comparability. A single marketplace snapshot answers what is visible today. A longitudinal dataset can answer what changed, when it changed, and how frequently the change occurred.
| Dataset layer | Example output | Business application |
|---|---|---|
| Raw observations | Product and seller records | Data storage |
| Normalized data | Consistent SKU records | Analysis |
| Historical data | Daily price snapshots | Price intelligence |
| Aggregated metrics | Category benchmarks | Strategy |
| Alerts | Price/stock changes | Operations |
| Dashboards | Trend visualizations | Management |
The marketplace's growth reinforces the need for scalable data architecture. In 2024, RWB reported more than ₽4.1 trillion in turnover and seller income of ₽2.9 trillion. (Telegram) In 2025, group GMV exceeded ₽6.1 trillion, while infrastructure investment surpassed ₽310 billion. (Коммерсантъ)
The 2026 requirement is therefore not simply to collect more information. Teams need clean identifiers, consistent timestamps, deduplication, historical storage, validation rules, and business-ready outputs.
Actionable insight: Separate collection from analysis. Store raw observations first, normalize them into a stable schema, and then create business metrics. This preserves the underlying evidence for future audits and analysis.
Why Choose Real Data API?
Businesses need scalable collection infrastructure when marketplace monitoring expands across thousands of products, categories, sellers, or locations. E-Commerce Data Scraping can support structured extraction workflows designed around recurring data requirements rather than one-off manual research.
Real Data API can help organizations structure marketplace information into datasets suitable for downstream analytics, dashboards, and monitoring workflows. The practical focus should be on data consistency, scheduling, normalization, validation, and delivery.
What should a scalable workflow include?
- Defined schema: Establish required product, pricing, seller, and availability fields.
- Scheduled collection: Set collection frequency according to business volatility.
- Data validation: Check missing, duplicated, or malformed records.
- Historical storage: Preserve dated snapshots for trend analysis.
- Flexible delivery: Make datasets accessible to analytics and reporting systems.
- Scalable processing: Support larger product and category coverage as requirements grow.
This structure is particularly useful for marketplace teams that need to move from manual competitive research toward repeatable data operations.
Conclusion
Marketplace competition requires more than occasional checks of product pages. A structured Wildberries Product Scraper workflow can help businesses monitor price changes, seller movements, catalog updates, and availability over time while creating historical records for analysis.
From 2020 through 2025, Wildberries and the broader RWB business experienced substantial growth in reported turnover and marketplace scale, making consistent data collection increasingly relevant for brands and retailers. (Interfax.ru)
The most useful implementation combines stable product identifiers, timestamps, seller-level relationships, price histories, availability records, validation, and actionable alerts. This transforms marketplace data from isolated observations into a reusable intelligence resource.
Start building structured marketplace datasets with Real Data API to monitor products, prices, sellers, and availability with greater consistency and turn marketplace changes into actionable e-commerce insights!
FAQs
1. What is a Wildberries Product Scraper used for?
A Wildberries Product Scraper collects structured product information such as prices, sellers, ratings, availability, categories, and identifiers for competitive research and marketplace monitoring.
2. How does Wildberries Product Data Scraping support pricing analysis?
Wildberries Product Data Scraping creates historical price observations that businesses can compare across products, sellers, categories, discounts, and collection periods for structured pricing analysis.
3. What information can a Wildberries price web data scraper collect?
A Wildberries price web data scraper can capture listed prices, promotional prices, discounts, product identifiers, sellers, timestamps, and availability signals for recurring price monitoring.
4. Why use Wildberries seller data collection services?
Wildberries seller data collection services help businesses track seller presence, product offers, pricing, ratings, and marketplace participation to build seller-level competitive intelligence.
5. How can businesses extract Wildberries marketplace data?
Businesses can extract Wildberries marketplace data into structured datasets containing product, pricing, seller, availability, category, and historical fields. Real Data API can support scalable delivery workflows.
Latest posts

How Trip.com travel dataset Helps Brands Track Hotel Prices, Reviews, Availability, and Competitor Trends

How Reddit Scraper Solutions Collect Public Data for Market Research and Competitive Analysis
How Wildberries Product Scraper Helps Track Prices, Sellers, and Product Availability

How Coupang Scraper Helps Monitor Products, Prices, Sellers, Reviews, and Market Changes







.png)



