.gif)
.gif)
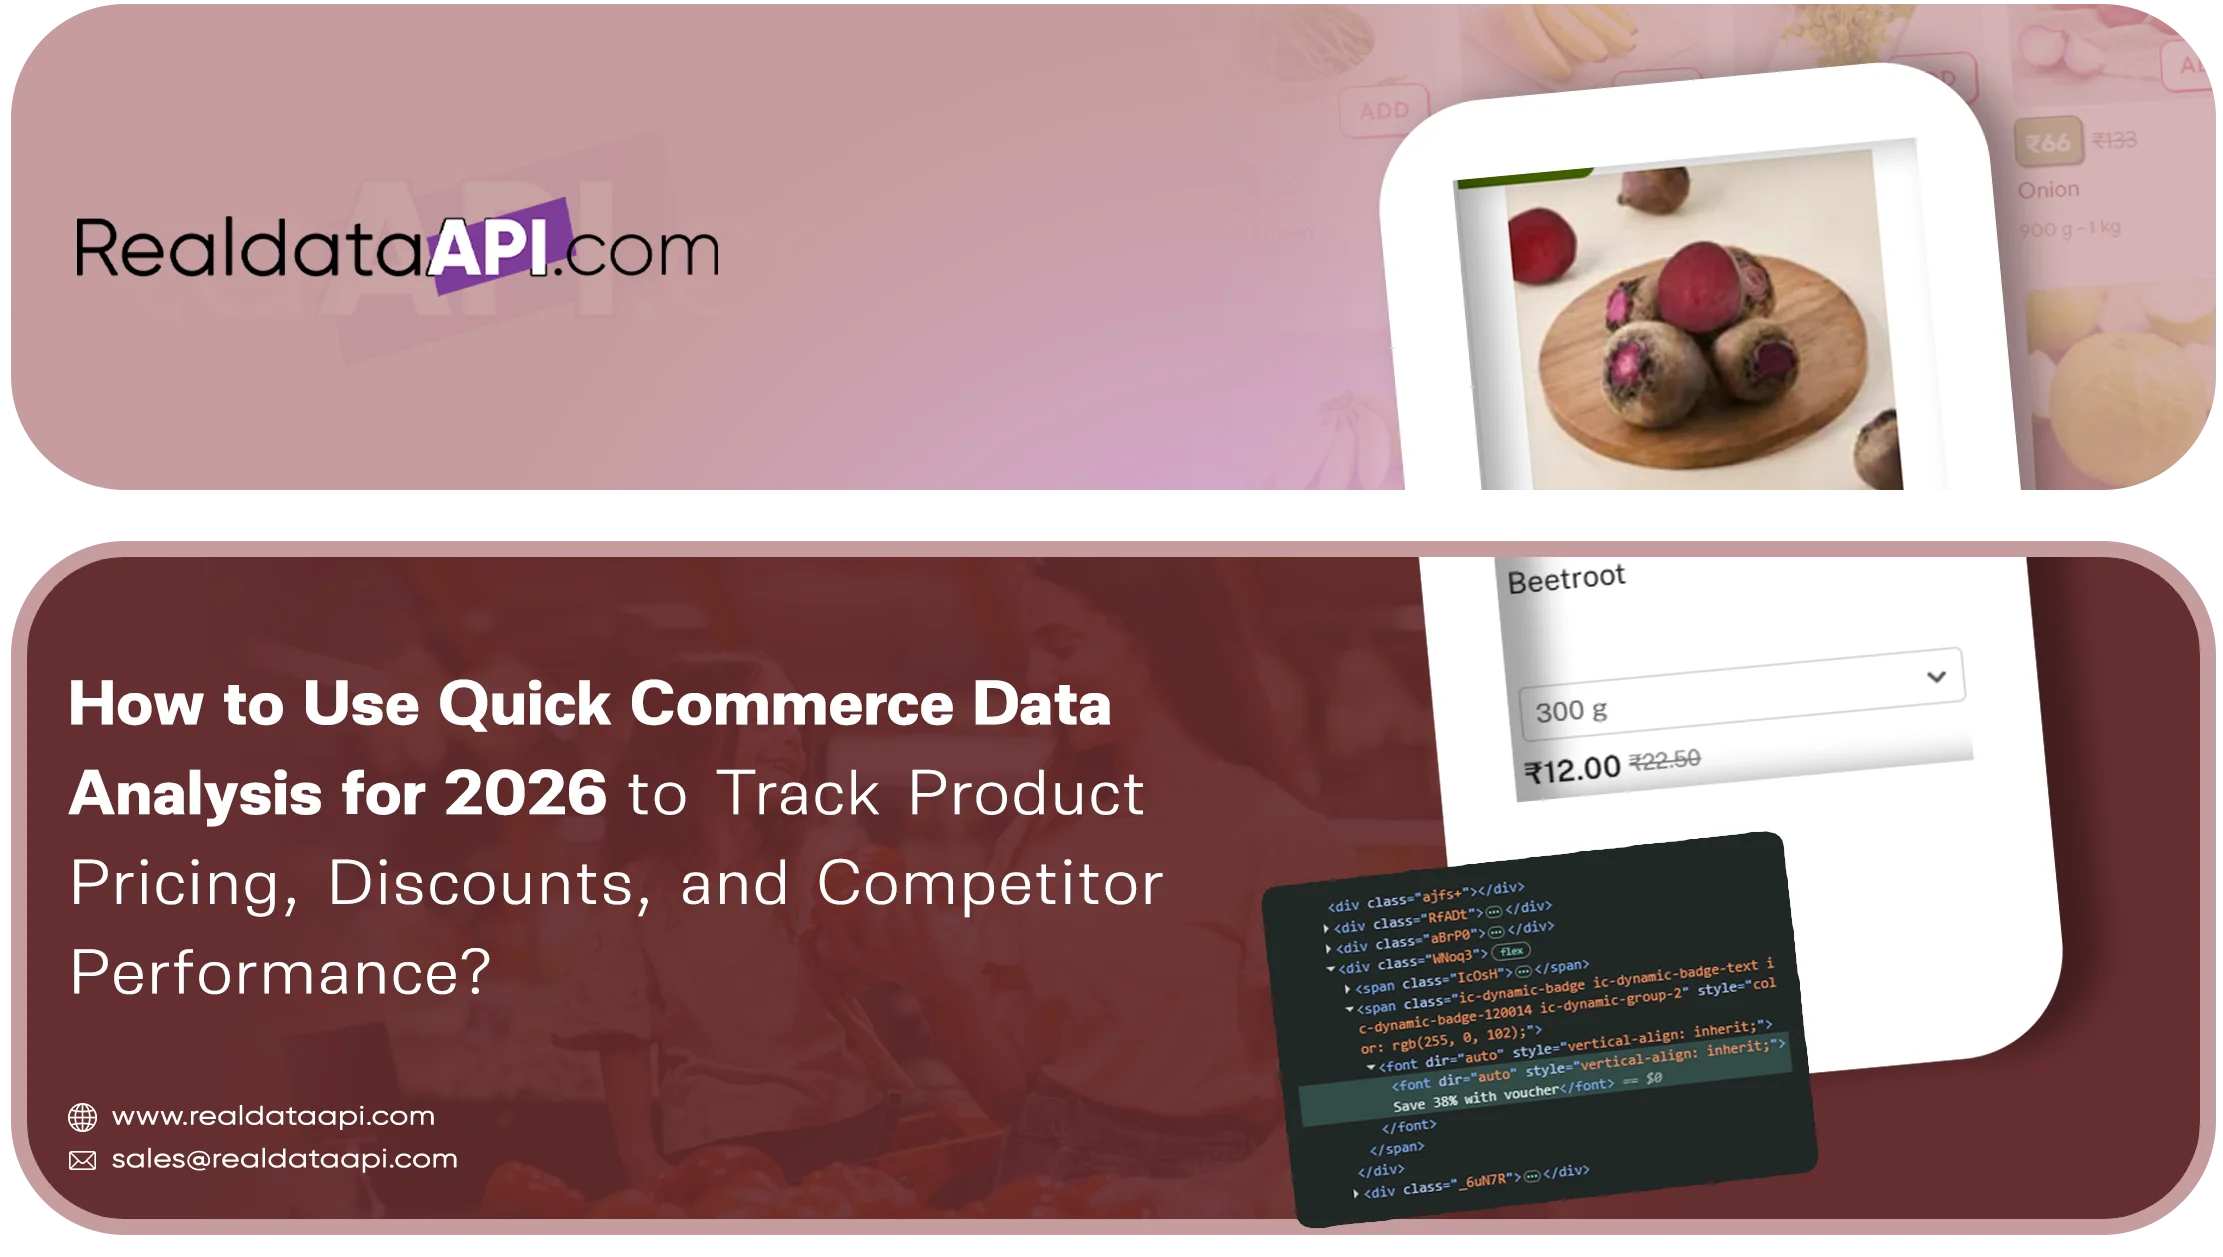
Quick Summary
- Quick Commerce Data Analysis for 2026 helps retailers, consumer brands, and e-commerce businesses understand product pricing, discounts, inventory availability, and competitor strategies.
- Structured marketplace intelligence supports price benchmarking, assortment comparisons, regional demand analysis, and promotional monitoring.
- Businesses can use Quick Commerce API Scraping to organize product-level information into actionable datasets, identify retail opportunities, and make informed decisions in India's rapidly evolving quick-commerce market.
Introduction
Quick commerce has transformed India's digital retail landscape by making groceries, household essentials, personal care products, and other everyday items available through rapid delivery services. Quick Commerce Data Analysis for 2026 helps retailers, FMCG brands, distributors, market researchers, and e-commerce companies understand this changing environment by tracking product prices, promotional offers, assortment variations, and competitor performance.
India's quick-commerce market has expanded significantly since FY2020. According to a December 2025 market overview published in Swiggy's investor-related research documentation, the Indian market grew from approximately ₹4 billion in FY2020 to ₹527 billion in FY2025. The report estimated FY2025 market penetration at approximately 0.63% of total retail. These figures demonstrate how quickly this retail channel has developed.
Businesses need more than occasional screenshots or manual price checks to understand this market. They require structured product information, consistent collection timestamps, reliable price comparisons, and historical records. Quick Commerce API Scraping can help organize permitted marketplace information into standardized datasets for business intelligence and competitive research.
For FMCG manufacturers, grocery retailers, consumer brands, and retail analysts, the primary objective is to identify where products are competitively positioned, how promotional strategies change, and whether products remain available across different service areas.
How Has India's Rapid-Delivery Retail Market Changed Between 2020 and 2026?
India's quick-commerce industry has moved from a relatively small retail channel into a significant part of the country's digital shopping ecosystem. Its development has been supported by smartphone adoption, digital payments, urban convenience requirements, hyperlocal fulfilment networks, and changing consumer shopping habits.
The market's historical expansion provides important context for businesses evaluating future opportunities. The December 2025 research documentation associated with Swiggy's investor materials, citing Redseer, estimates the market at approximately ₹4 billion in FY2020 and ₹527 billion in FY2025. It also projects a market size of ₹4,505–6,035 billion by FY2030. The FY2030 figures are projections, not achieved results.
What do the historical figures show?
| Financial year | Estimated market size | Status |
|---|---|---|
| FY2020 | ₹4 billion | Historical estimate |
| FY2021 | Not separately reported | Data not included |
| FY2022 | Not separately reported in this series | Data not included |
| FY2023 | Not separately reported in this series | Data not included |
| FY2024 | Not separately reported in this series | Data not included |
| FY2025 | ₹527 billion | Historical estimate |
| FY2026 | Approximately US$13 billion | Redseer estimate |
Sources: Redseer market overview published in Swiggy's investor-related research documentation and Redseer–Google report dated October 7, 2026. Different publications may use different market definitions and measurement methodologies; these figures should not be combined as one continuous audited series.
The October 2026 Redseer–Google report estimates that India's quick-commerce market grew from approximately US$0.4 billion in FY2022 to US$13 billion in FY2026. It projects a potential market size of approximately US$90 billion by FY2031. The report also identifies larger household grocery baskets and non-grocery category expansion as important future growth opportunities.
Quick commerce web scraping can help businesses understand how this market expansion translates into visible product-level competition. Brands can examine product assortment, listed prices, discounts, pack sizes, and availability across selected locations.
For FMCG companies, these observations are useful for identifying assortment gaps and understanding competitor positioning. Retailers can evaluate whether their product ranges and promotional strategies remain competitive.
However, market growth should not be confused with individual brand growth. Platform-level market estimates describe the wider channel, while product-level observations help businesses understand specific competitive conditions.
Why Should Retailers Compare Product Prices Across Competing Platforms?
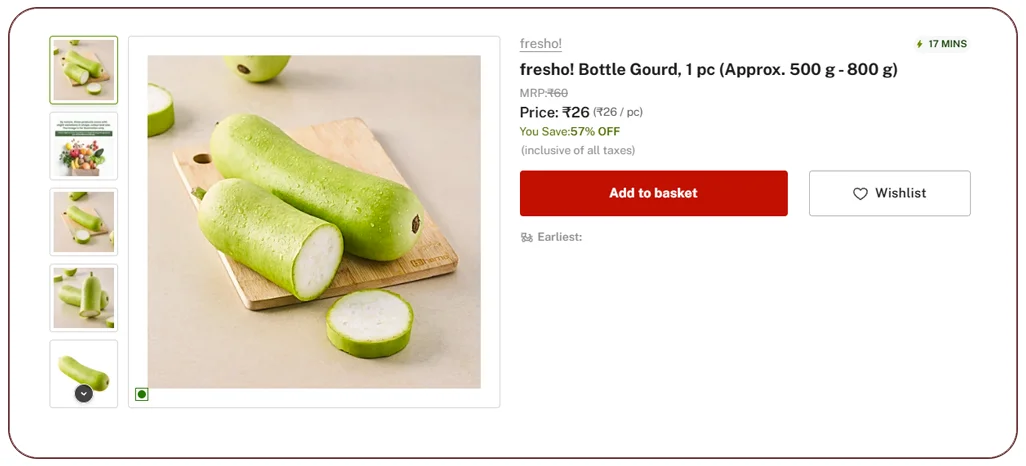
Product pricing is one of the most important factors influencing quick-commerce competition. Consumers can compare similar products across multiple delivery applications, making price positioning, promotional visibility, and assortment decisions important for brands and retailers.
Quick commerce retail analytics helps businesses understand these competitive differences through structured observations of product listings, selling prices, discounts, pack sizes, and promotional campaigns.
For example, a packaged-food manufacturer can compare the displayed prices of the same SKU across different platforms. A meaningful comparison should account for pack size, product variant, seller, discount conditions, and location. Comparing a 500-gram product with a one-kilogram pack without normalization can produce misleading conclusions.
Which pricing indicators should businesses monitor?
| Indicator | What businesses can understand |
|---|---|
| Listed selling price | Regular price positioning |
| Discounted price | Promotional competitiveness |
| Discount percentage | Relative promotional intensity |
| Pack size | Comparable product value |
| Price per unit | Standardized price comparison |
| Offer duration | Promotional activity over time |
| Product availability | Whether a price observation relates to an available listing |
| Location | Regional price differences |
Historical industry research also demonstrates changing shopping behaviour. Redseer's analysis of India's quick-commerce market reported that average monthly ordering frequency increased from 4.4 orders in FY2021 to nearly six orders in FY2024. Average order values also increased by more than 15% in FY2024, according to its industry analysis.
These trends make pricing intelligence particularly valuable for FMCG manufacturers, grocery retailers, and category managers.
Businesses should maintain separate records for regular prices, promotional prices, and conditional offers. They should also record collection dates because discounts can change frequently.
This enables analysts to distinguish genuine price movements from temporary campaigns and evaluate whether a brand's promotional positioning remains competitive.
How Can Product Availability Data Improve Inventory Decisions?
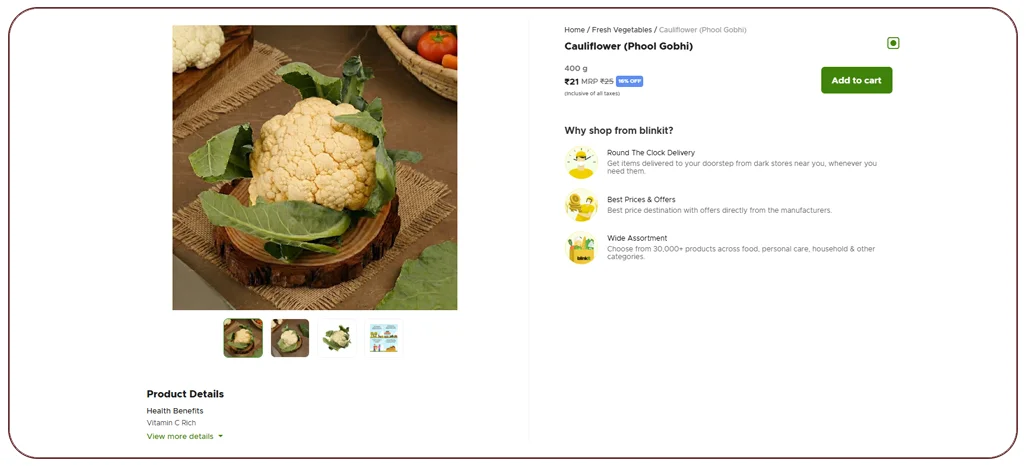
Product availability is closely connected to customer experience and retail performance. A product may have competitive pricing, strong brand recognition, and attractive promotional offers, but customers cannot purchase it if it is unavailable in their delivery area.
Businesses therefore need to evaluate product visibility and availability alongside pricing information.
To scrape grocery inventory data, businesses should first identify permitted sources and define the product categories, locations, and information fields required for research. The resulting dataset can help category managers evaluate assortment coverage and identify recurring availability changes.
Important inventory attributes
| Attribute | Business purpose |
|---|---|
| Product name | Product identification |
| Brand | Brand-level comparison |
| SKU or product identifier | Product matching |
| Category | Assortment classification |
| Pack size | Variant comparison |
| Listed price | Price benchmarking |
| Availability status | Visible stock condition |
| Location or service area | Geographic comparison |
| Collection timestamp | Historical tracking |
How did the market develop?
CareEdge Advisory's 2025 research on India's rapid-delivery market reported that the number of dark stores operated by three major platforms—Blinkit, Instamart, and Zepto—increased from approximately 1,400 in FY2023 to 1,800 in FY2024 and 3,072 in FY2025. The report also estimated average revenue per store at ₹12 crore, ₹17 crore, and ₹21 crore, respectively. These are research estimates, not audited figures for every store.
This expansion makes location-specific assortment and availability analysis increasingly relevant. A product visible in one service area may not be listed in another because of differences in local demand, assortment planning, or fulfilment operations.
Quick Commerce Data Analysis for 2026 should therefore distinguish between a product that is not listed, a product that is temporarily unavailable, and a product that cannot be delivered to a particular location.
Businesses can use repeated, timestamped observations to identify recurring availability patterns. However, an online availability indicator is not necessarily a verified warehouse stock count. Analysts should avoid treating it as exact physical inventory.
Looking to understand product availability and competitive assortment across digital retail platforms? Build structured inventory intelligence with reliable data collection and validation workflows.
Get Insights Now!How Can API-Based Collection Improve Retail Data Management?
Retail intelligence projects often involve large numbers of products, multiple platforms, different locations, and frequently changing information. Managing these records manually can create inconsistencies and make historical comparisons difficult.
A quick commerce data scraping API can support an organized data pipeline by collecting permitted information, processing records, and delivering standardized outputs to business intelligence systems.
The process should begin with a clearly defined collection requirement. Businesses need to identify the relevant product categories, geographic coverage, pricing fields, promotional information, and collection frequency.
What does an effective data pipeline include?
- Source identification: Select authorized APIs, permitted integrations, and approved information sources.
- Product discovery: Identify relevant brands, categories, SKUs, and product variants.
- Data extraction: Collect available product attributes and pricing observations.
- Normalization: Standardize names, units, pack sizes, and category labels.
- Product matching: Connect equivalent products across different marketplace listings.
- Validation: Identify duplicate records, missing attributes, and inconsistent prices.
- Historical storage: Maintain dated records for trend analysis.
- Data delivery: Provide structured outputs for dashboards, reports, and analytics applications.
What should a reliable dataset contain?
| Data component | Recommended information |
|---|---|
| Product identity | Name, brand, SKU |
| Category | Grocery, personal care, beverages, etc. |
| Pricing | Regular and promotional price |
| Product attributes | Pack size, weight, variant |
| Availability | Displayed availability status |
| Geography | City and service location |
| Source information | Platform and listing reference |
| Historical details | Collection date and time |
A major consideration is access permission. An API-based workflow should not assume that every delivery platform provides unrestricted public endpoints. Authentication, platform terms, technical restrictions, and data-use permissions must be reviewed before implementation.
For businesses working across several retail channels, consistent field definitions are especially important. A standardized product identifier and normalized unit price can make cross-platform comparisons more reliable.
The result is a repeatable information pipeline that supports price monitoring, assortment research, and inventory visibility without confusing marketplace observations with verified internal stock records.
How Can Market Research Reveal Consumer and Category Opportunities?
The quick-commerce market is expanding beyond emergency grocery purchases. Consumers are increasingly using rapid-delivery platforms for planned household requirements, packaged foods, beverages, personal care products, and other convenience-oriented purchases.
Market Research helps brands understand which categories are gaining marketplace visibility, how competitors position their products, and where assortment opportunities may exist.
Redseer's October 2026 report, developed in collaboration with Google, estimates that quick commerce could grow from approximately US$13 billion in FY2026 to US$90 billion by FY2031. The report draws on a survey of more than 1,200 respondents across metropolitan and non-metropolitan cities, along with more than 50 in-store interactions. It identifies larger planned grocery baskets in metros and stronger adoption opportunities in non-metro markets as important growth areas.
Which categories should researchers evaluate?
| Category | Research opportunities |
|---|---|
| Packaged foods | Brand visibility, pack sizes, price differences |
| Fresh groceries | Product availability and assortment |
| Beverages | Promotional positioning and product variants |
| Dairy products | Pack-size and price comparisons |
| Personal care | Brand assortment and discount patterns |
| Household essentials | Category coverage and pricing |
| Beauty products | Product discovery and promotional activity |
| Pet supplies | Assortment expansion and brand visibility |
Quick Commerce Data Analysis for 2026 can help businesses connect these category-level observations with geographic and competitive differences.
For example, a manufacturer researching packaged beverages can evaluate which brands appear in selected locations, compare available pack sizes, and examine displayed promotional prices. Repeated observations can help identify changes in product assortment and promotional activity.
How can businesses identify market opportunities?
- Category gaps: Identify product categories with limited visible assortment in selected locations.
- Brand positioning: Compare competing brands using equivalent pack sizes and product variants.
- Regional differences: Evaluate whether product visibility varies across cities.
- Promotion patterns: Identify recurring discount campaigns and changes in displayed offers.
- Assortment expansion: Monitor the appearance of new products and categories.
A critical distinction is that listing visibility does not prove consumer demand or sales performance. Businesses should combine marketplace observations with authorized sales data, consumer research, and other reliable sources before making investment decisions.
How Can Data Processing Turn Marketplace Information into Actionable Insights?
Collecting product information is only the first step in building useful retail intelligence. Businesses also need accurate product matching, consistent category definitions, historical storage, and reporting systems that make the information easy to interpret.
Professional Web Scraping Services can support this process by combining authorized data collection with structured processing, quality checks, and customized data delivery.
For a multi-platform retail research project, the data workflow should address several common challenges.
Duplicate product listings: The same product may appear under different titles or descriptions. Matching should consider brand, SKU, pack size, product variant, and other identifying attributes.
Inconsistent pricing formats: Some listings display prices per pack, while others include different variants or promotional conditions. Normalization makes comparisons more meaningful.
Changing product availability: A listing can become unavailable or reappear. Timestamped observations help researchers understand these changes.
Regional assortment differences: A product available in one city may not be listed in another. Location identifiers should remain attached to each observation.
Historical data gaps: Replacing previous records with new information prevents businesses from identifying earlier price and assortment changes. Historical storage is therefore essential.
Which KPIs should businesses track?
| KPI | Calculation or interpretation |
|---|---|
| Average listed price | Mean of comparable observed prices |
| Price difference | Competitor price minus reference price |
| Discount percentage | (Regular price − offer price) ÷ regular price × 100 |
| Availability rate | Available observations ÷ valid observations × 100 |
| Assortment coverage | Number of distinct matched products |
| Brand visibility | Number of relevant listings by brand |
| Price change frequency | Number of observed price changes over a period |
| Category distribution | Share of listings by product category |
Businesses should calculate these indicators using consistent product matching and clearly defined observation periods. An availability rate based on marketplace listings, for example, should not be presented as a warehouse inventory accuracy rate.
How can businesses use the results?
- Category managers can identify assortment differences and prioritize product research.
- Pricing teams can compare equivalent SKUs and review promotional positioning.
- Brand managers can monitor product visibility and competitor activity.
- Retail analysts can evaluate regional differences and category development.
- Business leaders can use historical reports to support expansion and investment decisions.
A well-designed reporting framework turns individual product observations into measurable indicators. This makes it easier to understand market changes, investigate pricing movements, and prioritize commercial opportunities.
Why Choose Real Data API?
Retail businesses need dependable information to understand changing product prices, discounts, availability, and competitor assortment. Real Data API helps organizations transform fragmented online information into structured datasets that support retail intelligence and business research.
Its data solutions can support projects involving Indian Quick-Commerce Grocery Category Data through organized product information, standardized fields, and customized delivery formats.
What makes a structured data solution valuable?
- Category-specific extraction: Organize information around groceries, beverages, packaged foods, personal care, and household essentials.
- Competitive price intelligence: Structure product prices and promotional observations for comparable SKU analysis.
- Product matching: Standardize brand names, pack sizes, variants, and product identifiers.
- Data quality checks: Identify missing information, duplicate listings, and inconsistent records.
- Historical monitoring: Preserve timestamped observations to support pricing and assortment comparisons.
- Flexible delivery: Prepare datasets in formats suitable for dashboards, reporting tools, and internal analytics systems.
The Quick Commerce Data Analysis for 2026 approach should focus on data accuracy, relevant business metrics, and transparent collection methods rather than simply collecting large quantities of product listings.
Real Data API can help businesses establish structured workflows that turn marketplace information into practical competitive intelligence. This is particularly useful for FMCG manufacturers, grocery retailers, distributors, consumer brands, and market research teams.
Whether the objective is monitoring promotional activity, comparing product assortments, or evaluating regional retail opportunities, a well-organized dataset provides a stronger foundation for business decisions.
Conclusion
Quick commerce is changing how consumers discover, compare, and purchase everyday products. For retailers and consumer brands, understanding this competitive environment requires reliable information about product prices, discounts, inventory visibility, and competitor assortments.
Quick Commerce Data Analysis for 2026 provides a structured approach to understanding these changes. Businesses can use historical observations, standardized product records, and location-specific comparisons to identify pricing opportunities, evaluate promotional strategies, and improve category intelligence.
The most valuable insights come from combining accurate collection methods with product matching, data validation, and consistent historical reporting. These practices help businesses move beyond manual price checks and build repeatable retail intelligence workflows.
Ready to strengthen your retail intelligence strategy? Connect with Real Data API to develop structured quick-commerce datasets, monitor competitor activity, and turn marketplace information into actionable business insights!
FAQs
1. What is the purpose of quick-commerce market analysis?
Quick Commerce Data Analysis for 2026 helps retailers understand pricing, discounts, product availability, competitor assortments, and changing shopping patterns using structured marketplace observations.
2. How does API-based collection support retail research?
Quick Commerce API Scraping organizes permitted product information into structured records, helping analysts compare prices, categories, promotional offers, and availability across different retail platforms.
3. Can businesses monitor competitor pricing?
quick commerce web scraping supports authorized collection of displayed product prices and discounts, allowing brands to evaluate competitive positioning and identify pricing changes over time.
4. Why is retail intelligence important for FMCG brands?
quick commerce retail analytics helps FMCG companies evaluate brand visibility, promotional strategies, product assortment, and regional differences to support informed category management decisions.
5. Can grocery availability be tracked across locations?
Businesses can scrape grocery inventory data to monitor displayed product availability and assortment differences. Real Data API can help organize these observations into structured datasets.
Latest posts

mobile.de Scraping: Country-Wide Vehicle Listing Data for Germany
Walmart & TikTok Shop Seller Data Scraping for the USA
Amazon Industrial & Scientific Category Data Extraction (USA)

Used Car Buying Prices from Turo, Priceline & Kayak for Multiple Locations



.png)


