
Introduction
The Wolt European food delivery market intelligence report shows how restaurant supply, menu pricing, promotions, ratings, and competitive positioning can be tracked through structured delivery-platform data. This intelligence helps restaurants, food-tech companies, investors, and market researchers identify market shifts and pricing opportunities.
Europe's online food delivery market generated an estimated $56.03 billion in revenue in 2024 and is projected to reach $91.24 billion by 2030, representing an 8% CAGR from 2025 to 2030.
| Year | Market intelligence focus |
|---|---|
| 2020 | Pandemic-driven delivery adoption |
| 2021 | Digital ordering expansion |
| 2022 | Inflation and menu-price pressure |
| 2023 | Competition and profitability |
| 2024 | Market maturity and promotions |
| 2025 | Pricing and restaurant benchmarking |
| 2026 | Consolidation and real-time intelligence |
This report targets restaurant chains, food delivery companies, CPG brands, investors, market researchers, and competitive intelligence teams. The key pain point is simple: food delivery markets change quickly, while manual research produces incomplete and outdated snapshots.
How can businesses identify European food delivery trends?
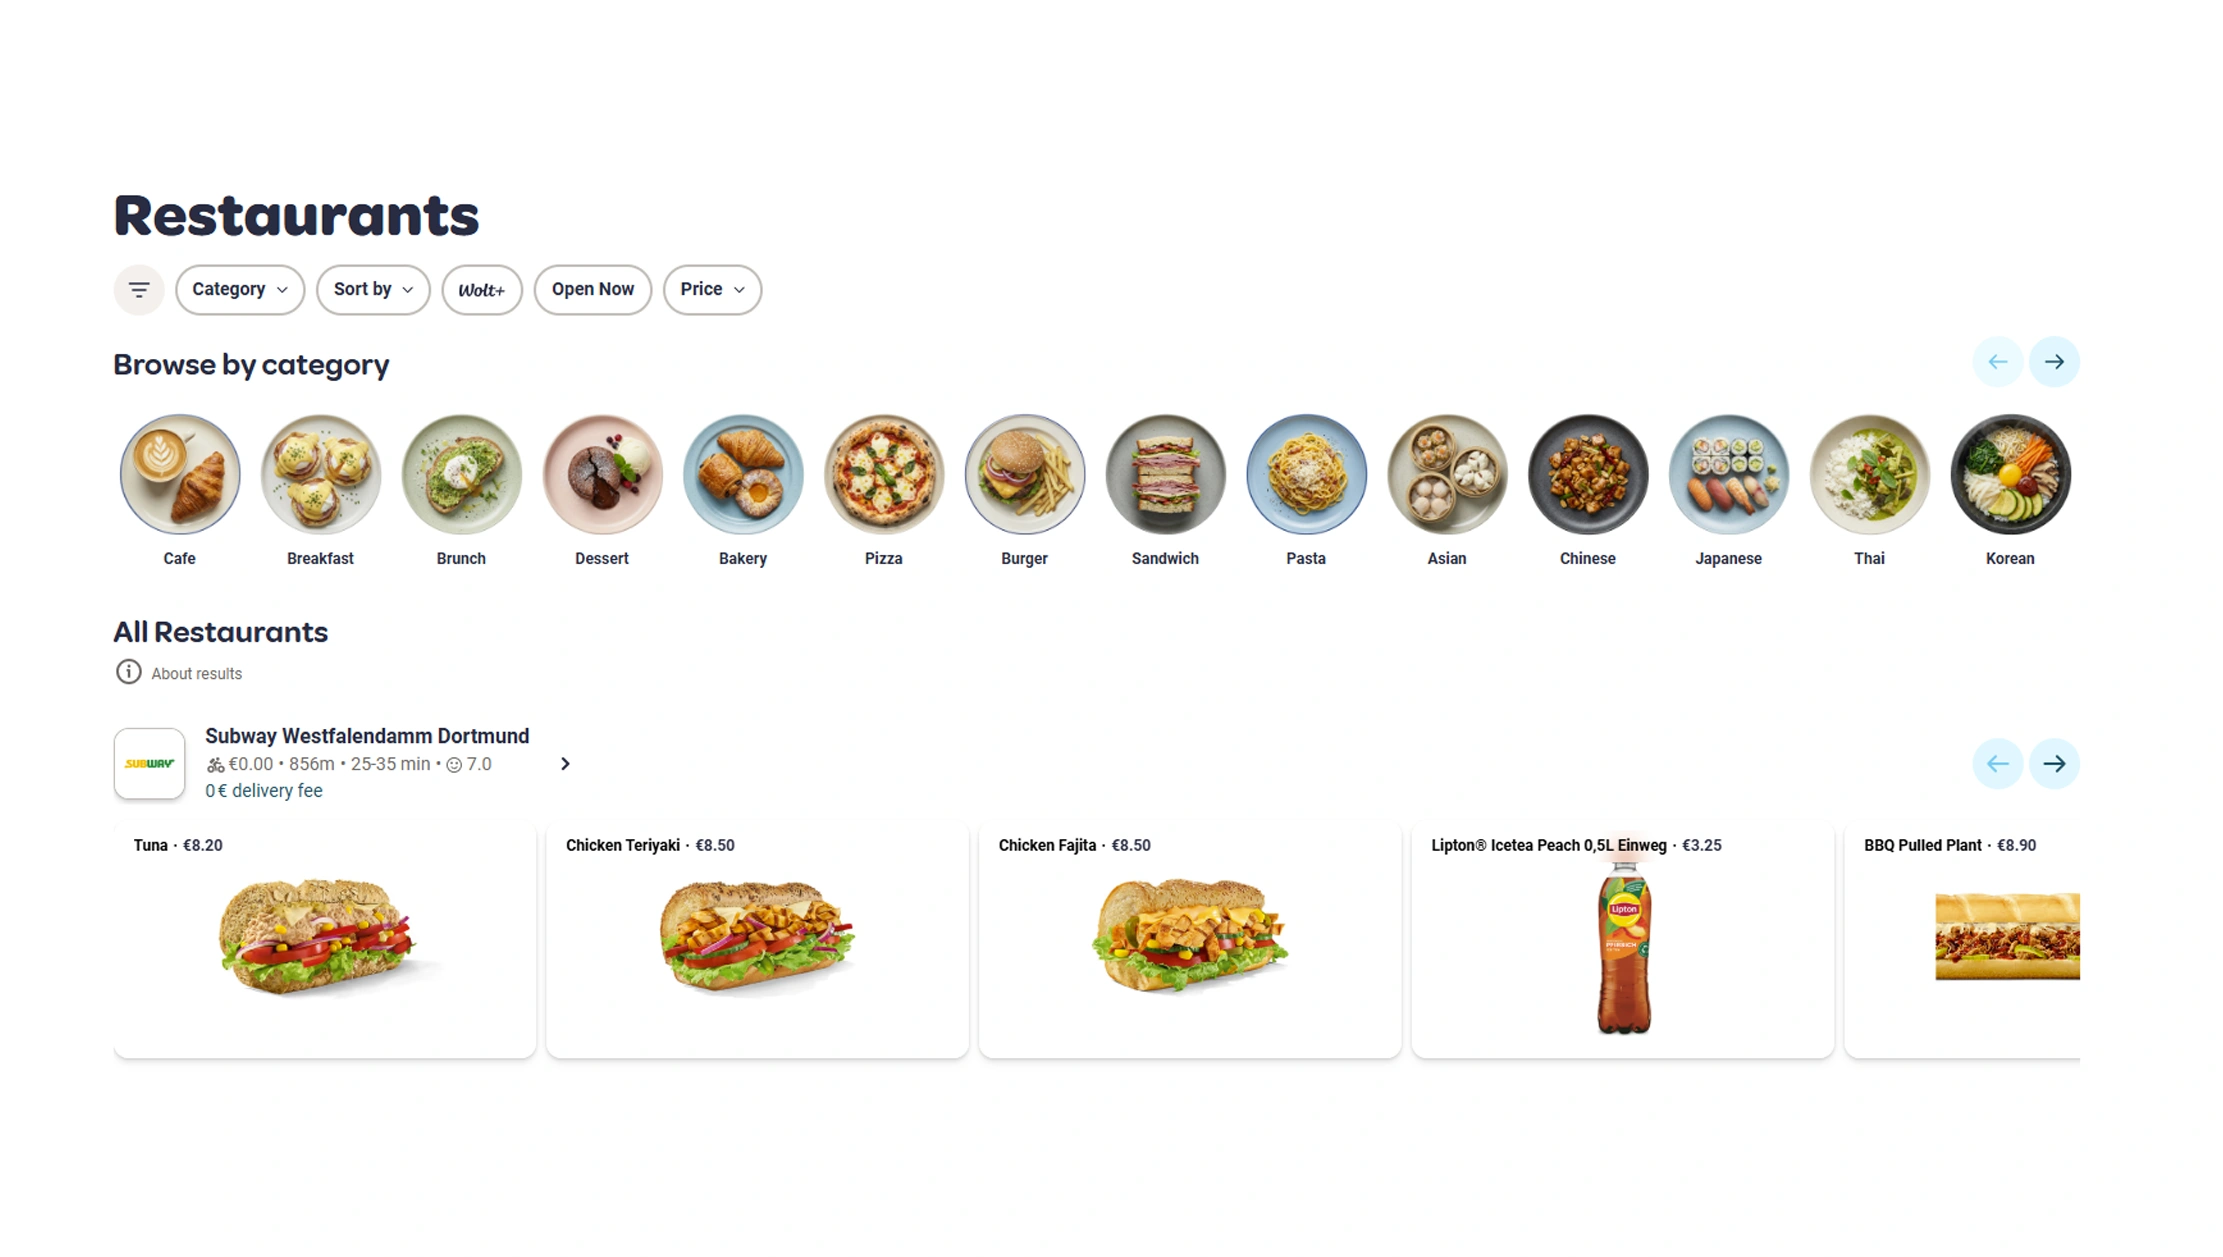
European food delivery trends using Wolt Scraper can help businesses measure changes in restaurant supply, cuisine popularity, pricing, promotions, and consumer-facing offers. Regular collection creates historical records that reveal how the market changes over time.
The European market expanded rapidly during the pandemic. Online ordering became a key channel for restaurants and consumers. After the initial surge, the industry entered a more competitive phase focused on efficiency, customer retention, restaurant economics, and platform scale.
Current market research estimates that Europe's online food delivery market was worth $34.17 billion in 2025 under one market definition and could reach $76.39 billion by 2034. The same study estimates a 9.35% CAGR from 2026 to 2034.
| Year | Key market signal | Data to monitor |
|---|---|---|
| 2020 | Delivery demand surged | Restaurant availability |
| 2021 | Online ordering expanded | Menu coverage |
| 2022 | Inflation increased | Menu prices |
| 2023 | Competition intensified | Promotions |
| 2024 | Market matured | Restaurant performance |
| 2025 | Data-led competition grew | Pricing benchmarks |
| 2026 | Consolidation accelerated | Competitive positioning |
Businesses can collect restaurant names, cuisine types, menu categories, prices, ratings, promotions, and location information. They can then compare these fields by city or country.
This helps answer important questions:
- Which cuisines are expanding?
- Which cities have the strongest restaurant supply?
- Which categories have the highest average prices?
- Which restaurants rely heavily on promotions?
- How frequently do menus change?
- Which competitors are entering new locations?
The result is a clearer view of market direction.
How can companies compare restaurant menu pricing?
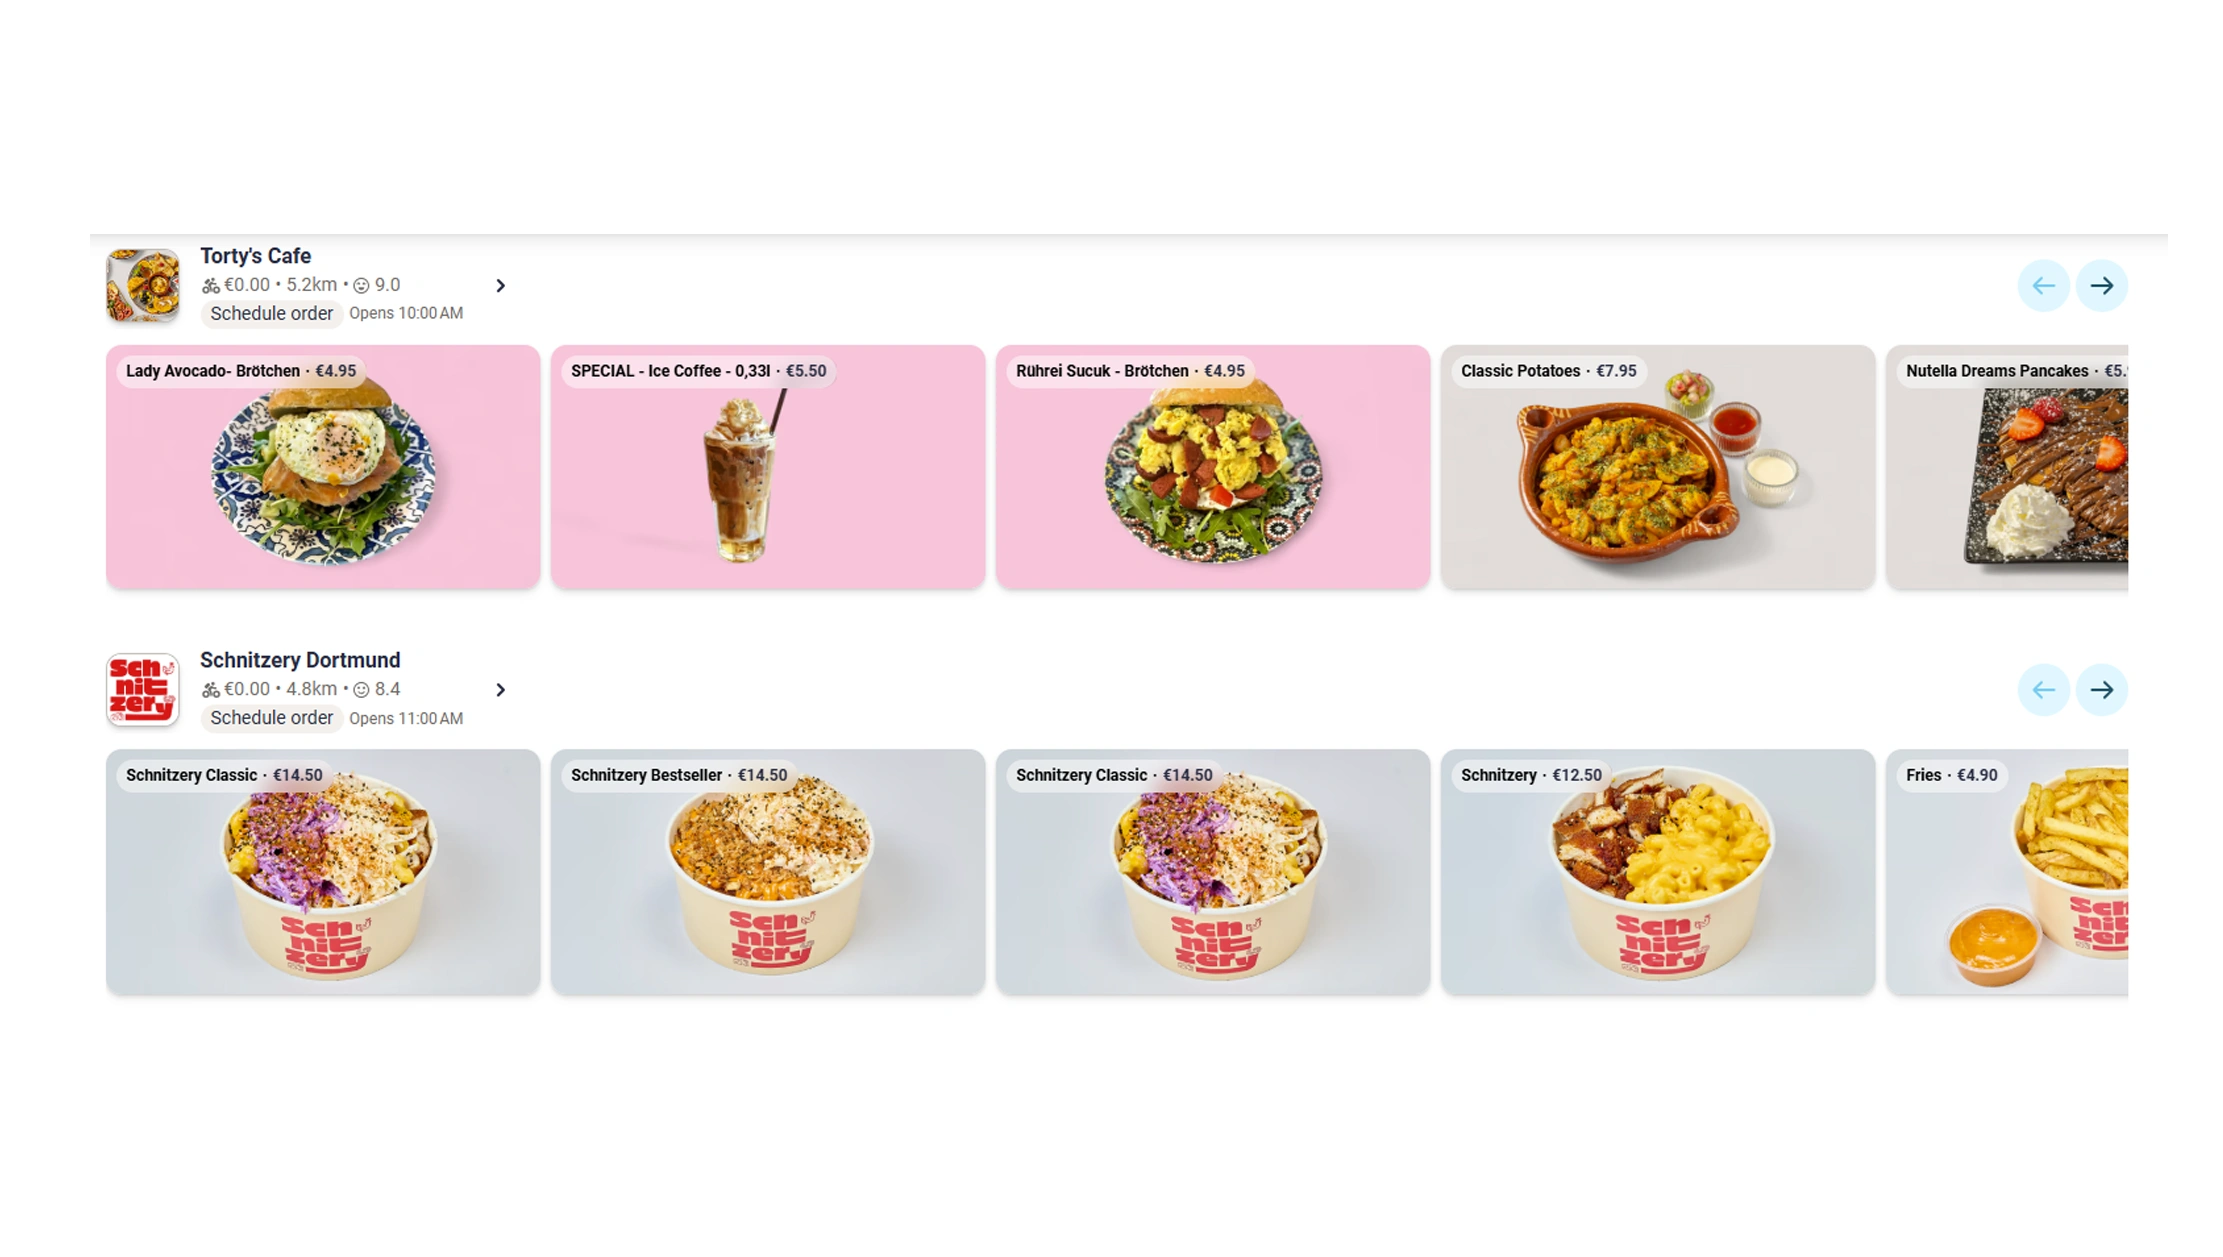
Scrape restaurant menu prices using Wolt data to build historical price benchmarks across restaurants, cuisines, cities, and countries. Pricing is one of the most important signals in food delivery intelligence.
Restaurants often adjust prices because of ingredient costs, competition, promotions, demand, and operational expenses. A manual price check may capture one moment. Recurring data collection shows the complete pricing pattern.
The Wolt European food delivery market intelligence report can therefore connect menu-level price changes with broader market conditions. European food delivery revenue reached approximately $56 billion in 2024, according to Grand View Research.
| Year | Pricing environment | Research opportunity |
|---|---|---|
| 2020 | Demand disruption | Establish price baseline |
| 2021 | Rapid delivery adoption | Track menu expansion |
| 2022 | High inflation pressure | Measure price increases |
| 2023 | Cost pressure continued | Compare restaurant pricing |
| 2024 | Market growth continued | Analyze promotions |
| 2025 | Competitive pricing | Benchmark competitors |
| 2026 | Consolidation and efficiency | Track pricing strategies |
A structured price dataset can calculate:
- Average menu price.
- Median item price.
- Price change percentage.
- Category-level price movement.
- Discount frequency.
- Promotional depth.
- Premium versus budget positioning.
- Price differences between cities.
For example, a restaurant chain can compare the same pizza across multiple European cities. A market research team can compare average burger prices among competing restaurants.
This makes pricing research faster and more consistent. It also helps businesses identify gaps in the market.
How can restaurant performance be monitored across locations?
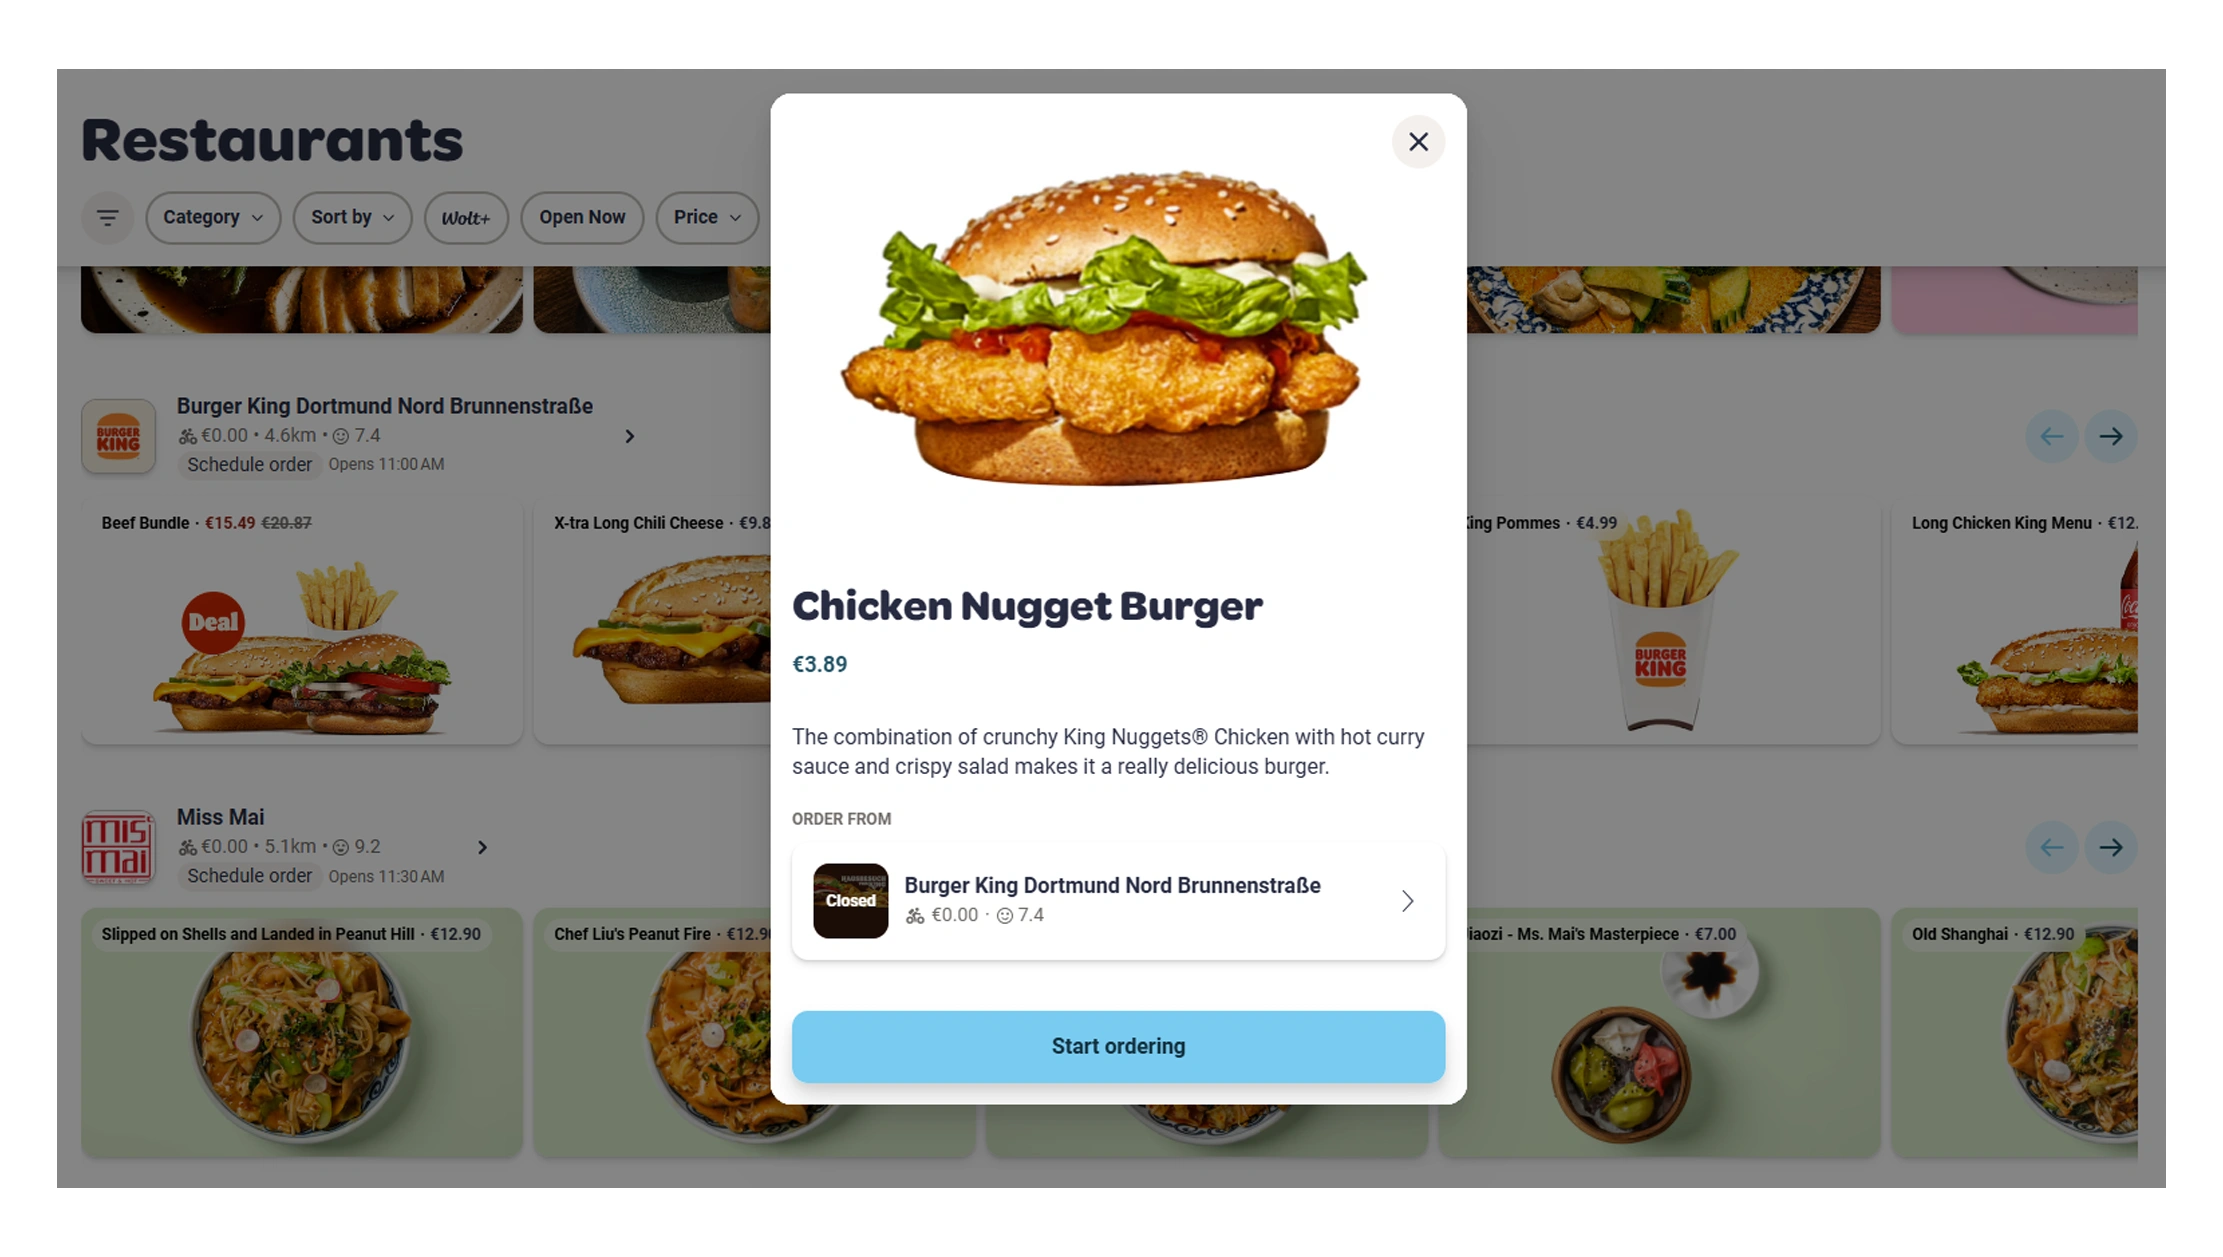
Restaurant performance monitoring using Wolt data scraper provides a structured way to compare restaurants based on visible market signals. Businesses can monitor menu size, pricing, ratings, reviews, promotions, cuisine categories, and availability.
A restaurant's performance is not determined by one metric. A high rating with a limited menu tells a different story from a large restaurant with aggressive discounts and average ratings.
Historical collection makes these differences easier to understand. Analysts can compare restaurant records across weeks or months. They can identify new restaurants, disappearing listings, menu changes, price changes, and shifts in promotional activity.
The European market is becoming increasingly competitive. A 2026 market report expects the European online food delivery market to grow from $34.17 billion in 2025 to $76.39 billion by 2034.
| Year | Performance question | Useful metrics |
|---|---|---|
| 2020 | Which restaurants moved online? | Restaurant listings |
| 2021 | Which categories expanded? | Cuisine and menu data |
| 2022 | Which restaurants changed prices? | Price history |
| 2023 | Who competed on discounts? | Promotions |
| 2024 | Which restaurants gained visibility? | Ratings and reviews |
| 2025 | Which brands expanded? | Location coverage |
| 2026 | Who is changing fastest? | Real-time snapshots |
Businesses can create restaurant scorecards using collected data. These scorecards can compare:
- Average price.
- Menu depth.
- Rating.
- Review volume.
- Promotion frequency.
- Cuisine category.
- Location coverage.
- Availability.
This approach helps restaurants benchmark their market position. It also helps investors and researchers understand competitive density.
The biggest benefit comes from historical data. It reveals movement rather than just a current snapshot.
How can an API make food delivery research scalable?
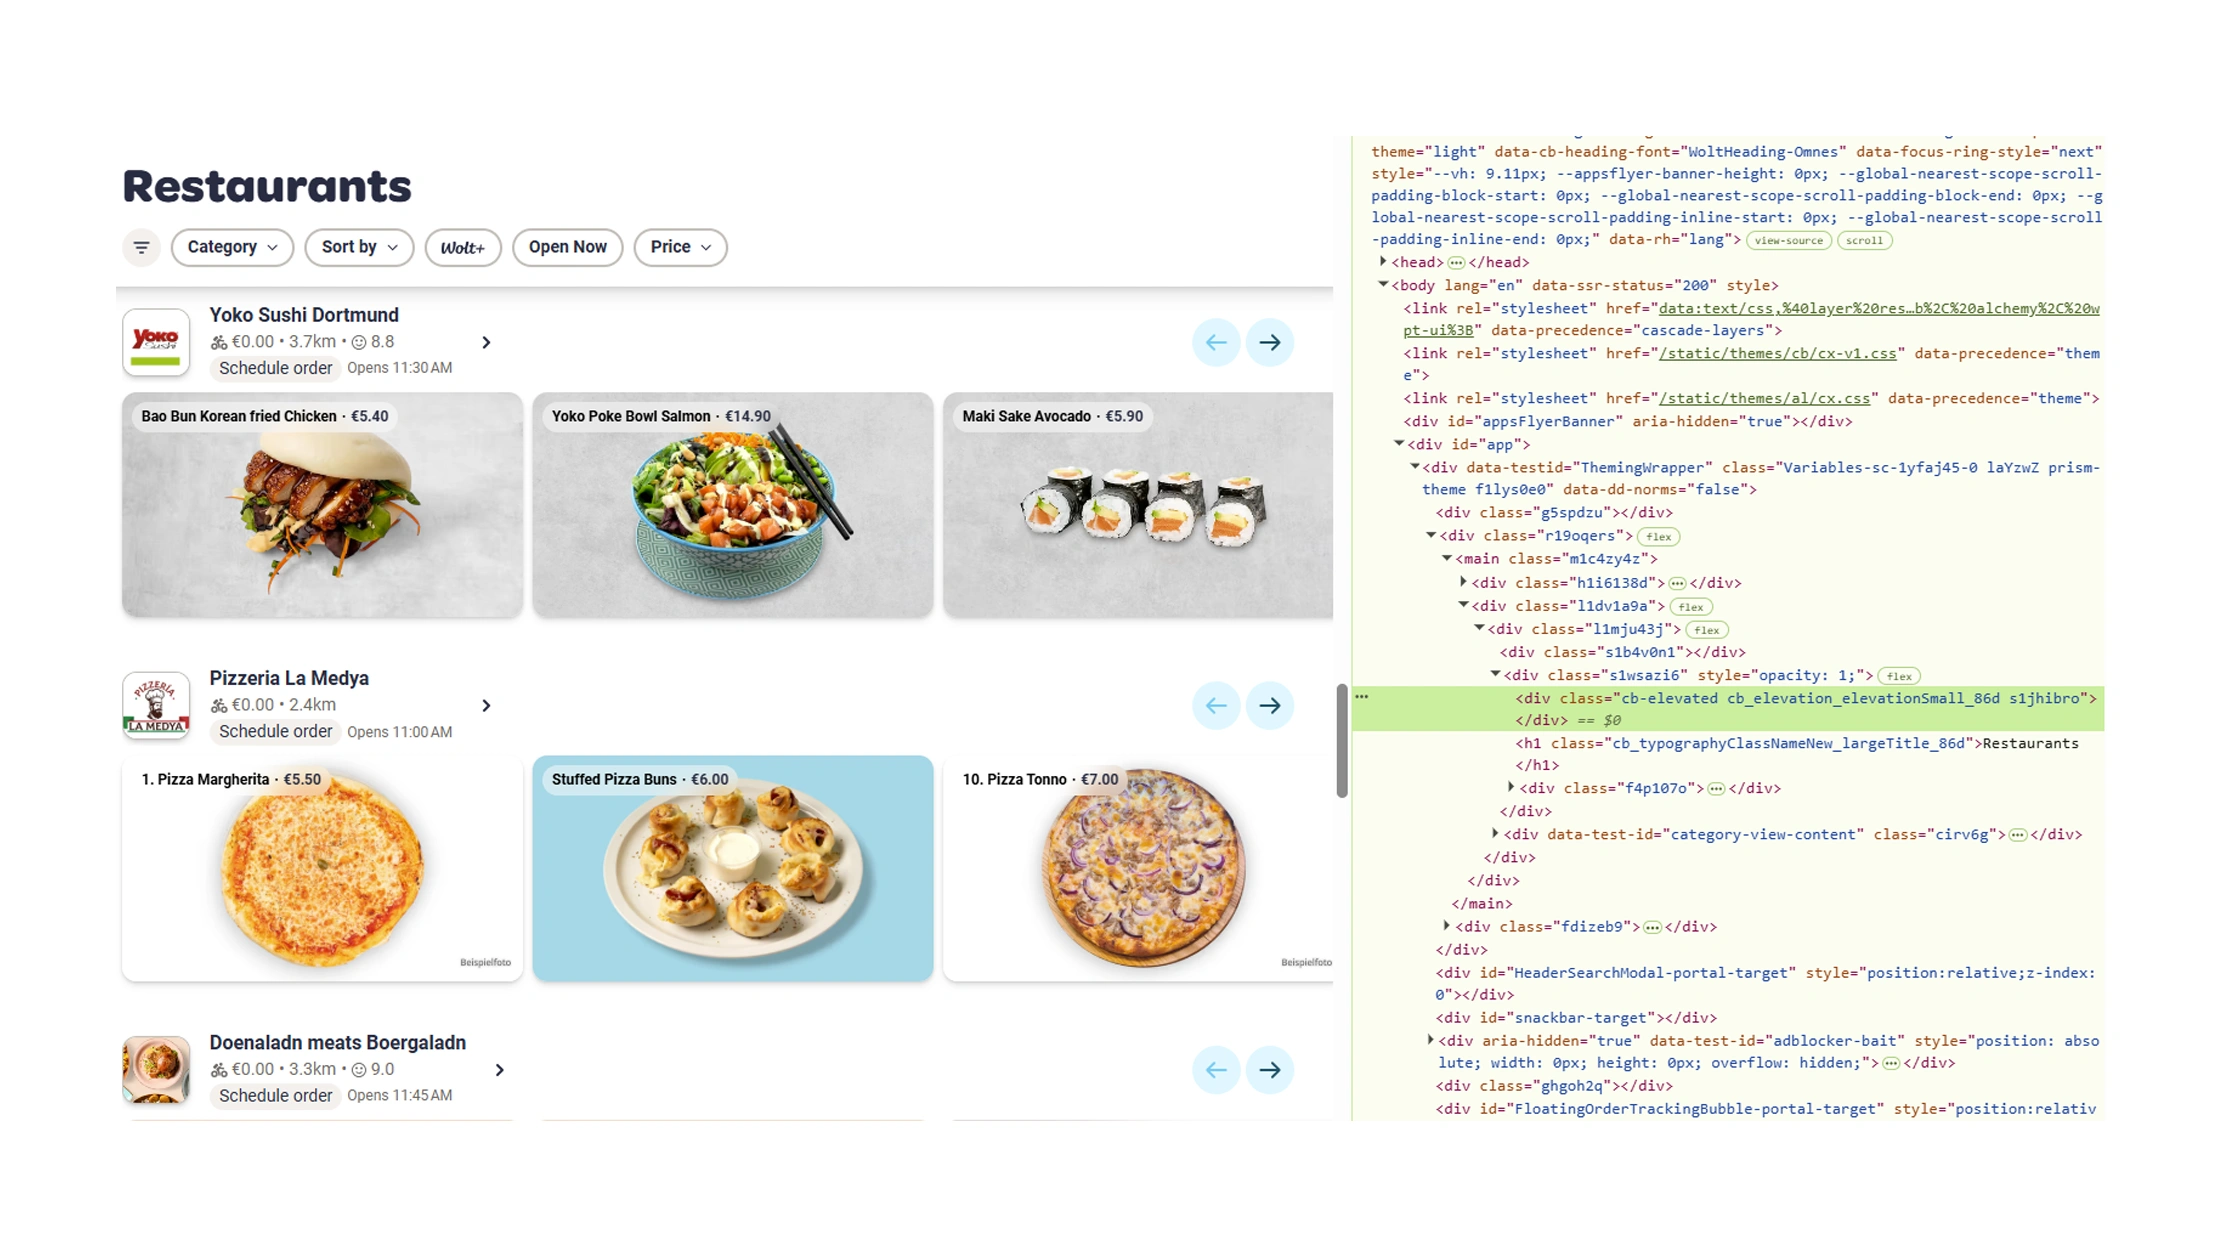
A Wolt Delivery API can support automated workflows for businesses that need recurring restaurant and menu intelligence. An API-based workflow makes it easier to connect structured data with databases, dashboards, analytics platforms, and internal research systems.
This is important because European food delivery markets cover many restaurants, categories, cities, and price points. Manual collection becomes increasingly difficult as the research scope grows.
A scalable workflow can follow this structure:
Data collection → Structured records → Historical storage → Analytics → Dashboard → Business decision
| Year | Data requirement | API opportunity |
|---|---|---|
| 2020 | Restaurant discovery | Centralized collection |
| 2021 | Menu expansion | Structured catalog data |
| 2022 | Price monitoring | Recurring extraction |
| 2023 | Competitor analysis | Historical datasets |
| 2024 | Promotion tracking | Automated updates |
| 2025 | Multi-market research | Scalable pipelines |
| 2026 | Real-time intelligence | Faster monitoring |
The European online food delivery market is forecast to grow strongly through the decade. One 2025 analysis estimates a 9.38% CAGR from 2025 to 2033.
As the market expands, businesses need data systems that can scale with their research requirements.
API-driven collection can support recurring analysis of restaurant menus, prices, ratings, promotions, and locations. Teams can integrate these records into business intelligence tools instead of maintaining large manual spreadsheets.
For example, a food-tech company could create a dashboard that tracks average menu prices by city. A restaurant group could monitor competitor promotions across locations.
The API layer turns recurring data collection into an operational intelligence process.
What can a structured food dataset reveal?
A Food Dataset built from recurring Wolt data can reveal patterns that are difficult to identify through isolated research. The Wolt European food delivery market intelligence report becomes more useful when current records can be compared with historical observations.
A structured dataset can include:
- Restaurant name.
- Restaurant location.
- Cuisine.
- Menu categories.
- Menu item.
- Price.
- Discount.
- Rating.
- Review count.
- Availability.
- Collection date.
This structure allows researchers to analyze changes over time. They can compare average prices across years. They can identify new cuisines. They can measure restaurant expansion. They can detect menu additions and removals.
Europe's online food delivery market was estimated at $56.03 billion in 2024 and is projected to reach $91.24 billion by 2030.
| Year | Dataset focus | Potential insight |
|---|---|---|
| 2020 | Restaurant presence | Digital adoption |
| 2021 | Menu coverage | Category expansion |
| 2022 | Price changes | Inflation impact |
| 2023 | Promotions | Competitive tactics |
| 2024 | Restaurant ratings | Performance comparison |
| 2025 | Multi-city data | Market benchmarking |
| 2026 | Historical trends | Current market movement |
The dataset can also support predictive research. Analysts can use historical price movements to identify recurring patterns. They can study whether certain categories experience larger seasonal changes.
Market researchers can segment the data by country, city, cuisine, restaurant type, or price range.
Investors can use the dataset to examine competitive density. Food-tech companies can identify underserved areas. Restaurant brands can use it to compare their menus with local competitors.
The important point is consistency. Data collected using the same structure over time creates a reliable foundation for market intelligence.
Which business problems can food scraping solve?
Food Scraping API Use Cases extend beyond restaurant discovery. Structured food delivery data can support pricing, competitive research, market expansion, restaurant benchmarking, menu intelligence, and consumer trend analysis.
Europe's delivery sector is also entering a consolidation phase. In July 2026, Reuters reported Uber's planned $14.8 billion acquisition of Delivery Hero, a deal that would create one of the largest food-delivery groups outside China.
This changing competitive environment increases the value of timely market intelligence.
| Year | Business priority | Data application |
|---|---|---|
| 2020 | Digital transformation | Restaurant discovery |
| 2021 | Online expansion | Menu monitoring |
| 2022 | Cost management | Price tracking |
| 2023 | Competitive pressure | Benchmarking |
| 2024 | Market maturity | Promotion analysis |
| 2025 | Efficiency | Automated intelligence |
| 2026 | Consolidation | Competitive monitoring |
Key use cases include:
- Price benchmarking: Compare restaurant prices across locations.
- Menu intelligence: Track new and removed menu items.
- Promotion analysis: Monitor discounts and special offers.
- Cuisine research: Identify growing and declining categories.
- Restaurant benchmarking: Compare ratings, prices, and menu depth.
- Expansion research: Find cities with strong restaurant activity.
- Competitive intelligence: Track changes across major competitors.
- Investment research: Build market datasets for opportunity analysis.
- Trend analysis: Study how food delivery changes over time.
The data can also support restaurant strategy. A restaurant can identify whether its prices sit above or below local competitors. It can compare menu breadth. It can study how frequently competitors use discounts.
Food delivery platforms can use similar intelligence to understand market coverage and category gaps.
For researchers, the value lies in turning thousands of individual restaurant records into measurable market trends.
The Wolt European food delivery market intelligence report becomes more actionable when businesses have access to structured, recurring, and scalable data.
Real Data API can help companies transform food delivery information into datasets designed for analytics and competitive research. Instead of manually checking restaurant pages, teams can build repeatable data workflows.
A strong food data solution should support:
- Restaurant and menu data collection.
- Price monitoring.
- Historical snapshots.
- Promotion tracking.
- Rating and review analysis.
- Cuisine classification.
- Location-based research.
- Competitive benchmarking.
- API-based integration.
- Scalable data workflows.
This approach matters because market conditions can change quickly. The European online food delivery market is forecast to continue expanding, with multiple research firms projecting strong growth through 2030 and beyond.
Real Data API can help businesses turn these changes into measurable data points.
A restaurant chain can monitor competitors. A food-tech company can analyze market expansion. An investor can study restaurant density. A market researcher can build a historical dataset.
The common requirement is reliable and repeatable data collection.
Conclusion
The Wolt European food delivery market intelligence report shows why restaurant-level data has become important for understanding the European delivery ecosystem.
The market has moved through several stages. In 2020 and 2021, pandemic conditions accelerated online ordering. From 2022 onward, inflation and operating costs increased pressure on restaurants and consumers. By 2024 and 2025, the market had entered a more mature stage focused on pricing, efficiency, customer retention, and competitive positioning.
In 2026, consolidation has become another major theme. Reuters reported Uber's proposed $14.8 billion acquisition of Delivery Hero, demonstrating the scale of strategic activity in the sector.
Businesses therefore need more than market-size estimates. They need granular information.
They need to know:
- Which restaurants are active?
- What are they charging?
- Which cuisines are expanding?
- Which products are promoted?
- How are menus changing?
- Which locations have the strongest competition?
- How does pricing differ across cities?
- Which restaurants appear to be gaining market visibility?
A recurring data strategy can answer these questions.
Historical data creates the foundation for comparison. Real-time or frequent collection provides faster visibility. APIs make the information easier to integrate into existing systems.
For restaurants, this can improve competitive positioning. For food-tech companies, it can support expansion decisions. For investors, it can strengthen market research. For analysts, it can provide a consistent dataset for trend analysis.
The European market is expected to keep growing. Grand View Research projects revenue of $91.24 billion by 2030, while another 2026 market study forecasts $76.39 billion by 2034 under a different market definition. These differences show why researchers should clearly define their market scope and methodology.
The strongest intelligence combines market-level statistics with restaurant-level observations.
Want to build a reliable food delivery intelligence dataset? Connect with Real Data API to automate restaurant, menu, pricing, and competitive data collection and turn delivery-platform data into actionable European market insights!
Latest posts

How to Track Global Anime Viewing Trends via Crunchyroll Data Scraping for Smarter Audience Insights?

How to Scrape streaming content trends using HBO Max data for Smarter Content Strategy?

Traveloka Data Scraping For Travel Price Intelligence - How To Monitor Price Changes, Discounts, And Travel Demand
How Bolt Food Data Scraping for Food Delivery Market Trends Helps Businesses Overcome Delivery Market Intelligence Challenges?






.png)



